Get Indexology® Blog updates via email.

In This List

Measuring USD Leveraged Loans for the Brazilian Market

Ballots and Benchmarks: How Elections Shake Markets around the World

How and Why Institutions Are Evolving Their ETF Usage

Targeting the Drivers of Dividend Strength: A First Look at the S&P 500 Dividend Drivers Index

S&P TIP Global AllCap Index: A New Tool for Tracking Diversification and Limiting Concentration Risk in Global Equities

Measuring USD Leveraged Loans for the Brazilian Market

Contributor Image
Adrian Roseth

Analyst, Fixed Income Product Management

S&P Dow Jones Indices

The author would like to thank Sofia Lozada for her contributions to this blog.

Introduction: The Challenge

Brazilian institutional investors are increasingly looking beyond domestic markets in search of income. With local yields subject to monetary policy cycles and a concentrated domestic credit universe, global fixed income could offer diversification. Instruments with different risk drivers, such as USD-denominated senior secured loans, could complement a BRL-based fixed income view.

Yet investing abroad introduces a structural challenge: currency risk. For Brazilian market participants, USD-BRL movements can have as much influence on performance as the underlying asset itself. The question is how to reflect the yield characteristics of USD leveraged loans while managing that currency risk.

Why U.S. Leveraged Loans?

U.S. leveraged loans offer floating-rate coupons that reset with short-term U.S. rates, providing income and buffering against duration risk in a way that fixed-rate bonds do not.

Leveraged loans are senior secured instruments, sitting at the top of the borrower’s capital structure and backed by collateral. This gives lenders a priority claim in a restructuring or default scenario—a structurally defensive way to access credit spreads.

The U.S. leveraged loan market is large, liquid and well-established, and it is not replicated in Brazil’s domestic credit universe. Compared with the Brazilian fixed income market, this asset class provides diversification characteristics through different borrowers, different rate dynamics and a source of USD-denominated yield. The S&P USD Select Leveraged Loan BRL Hedge Carry Index measures the performance of the U.S. leveraged loan market through a currency-hedged framework, combining loan weighting with a built-in BRL hedge and BRL cash carry.

Why Currency Matters for Brazilian Investors

For a Brazilian strategy focused on USD-denominated leveraged loans, three forces drive performance: credit performance, coupon income and the USD-BRL exchange rate. Even when underlying loans perform well, currency moves can reshape the outcome once performance is converted back to BRL, making a systematic hedge a more targeted way to reflect the performance of the asset class.

Understanding the Index Construction

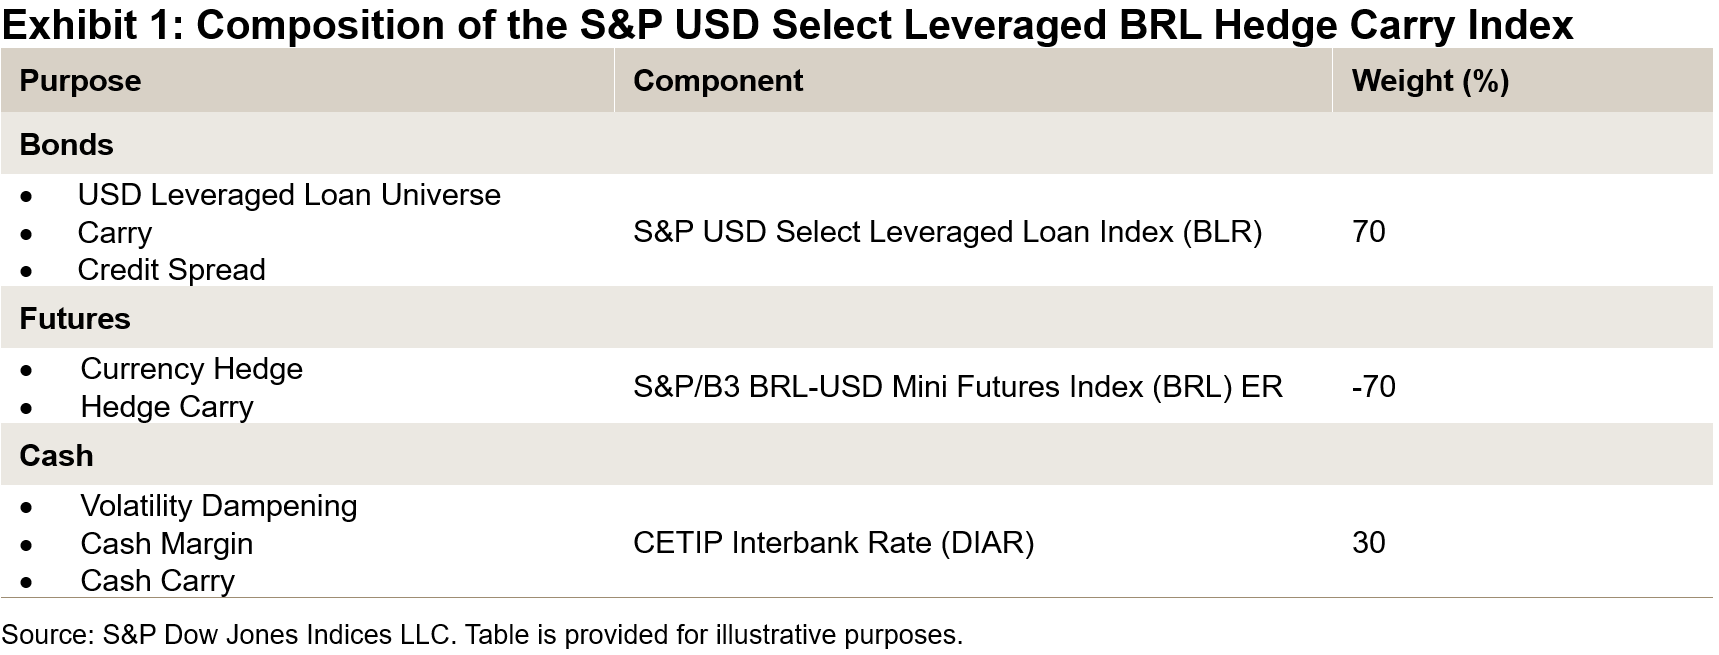
The S&P USD Select Leveraged Loan BRL Hedge Carry Index is built from three components. First, a 70% weight to the S&P USD Select Leveraged Loan Index (BRL) as the underlying benchmark for the U.S. leveraged loan market. Second, a 30% weight in the CETIP Interbank Rate (DIAR) provides a measure of BRL cash carry and serves as collateral support for the futures position. Third, a -70% short position in the S&P/B3 BRL-USD Mini Futures Index (BRL) ER forms the systematic currency hedge.

The hedge is intended to offset the USD-BRL currency risk embedded in the loan weighting. Rather than leaving performance subject to U.S. dollar movements, the short futures position seeks to reduce that unintended risk—with performance in Brazilian real terms reflecting the credit performance and yield of the underlying loans.

The index also incorporates a cash buffer mechanism to cover potential margin calls from the B3 exchange. A rebalance is triggered whenever the cash weight falls below 10% of the index weight, aiming to maintain sufficient liquidity for the futures position at all times. For more information, see the S&P Multi-Asset Indices Methodology.
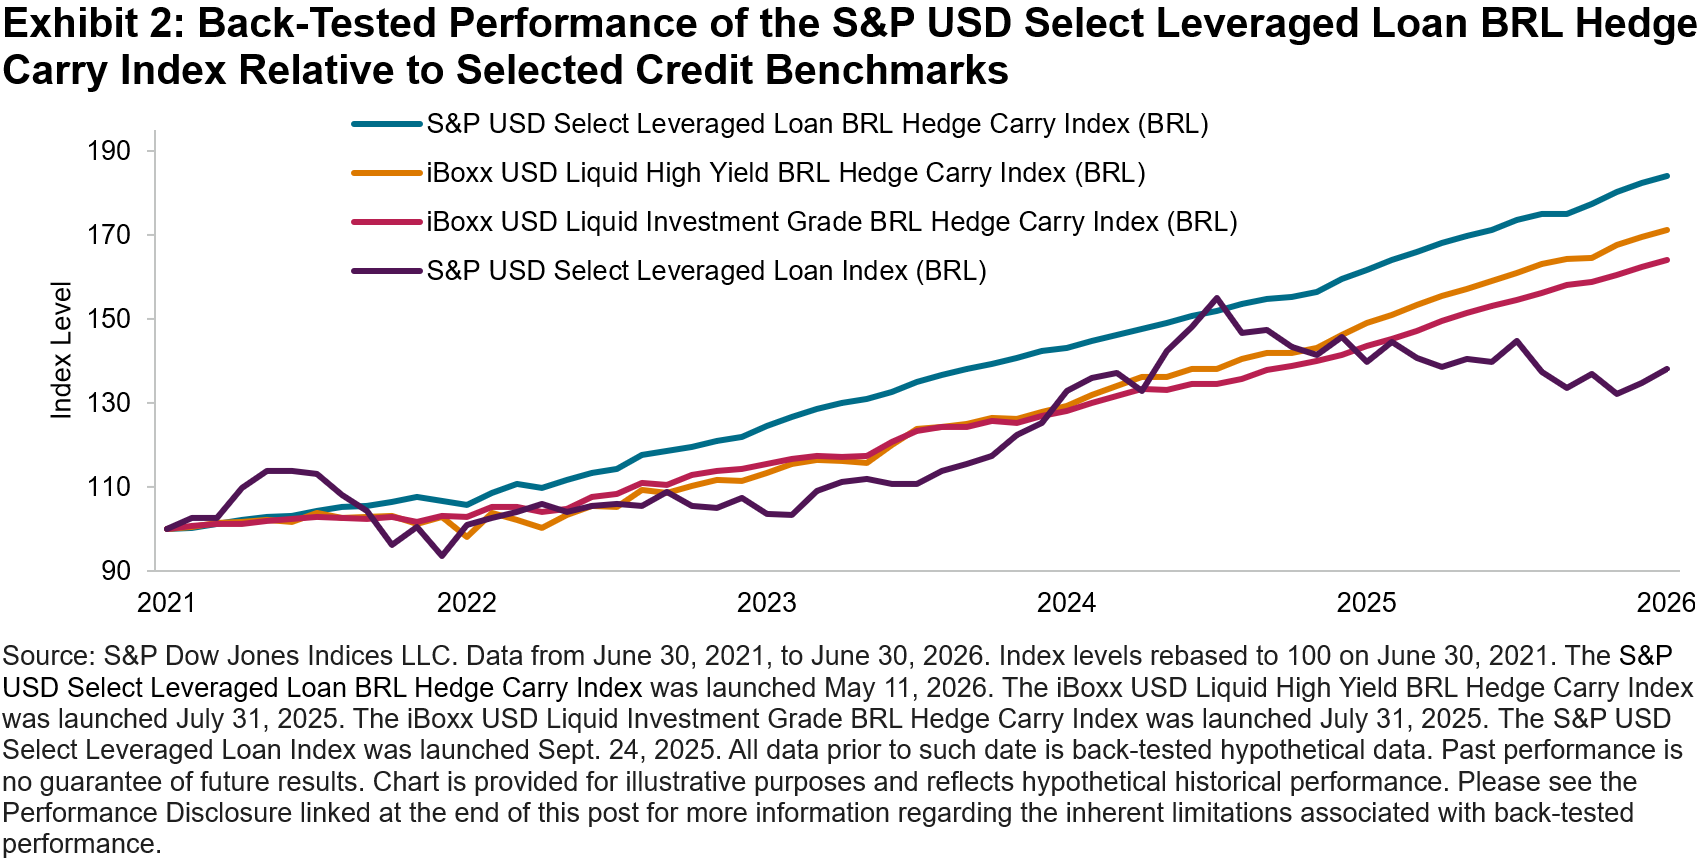
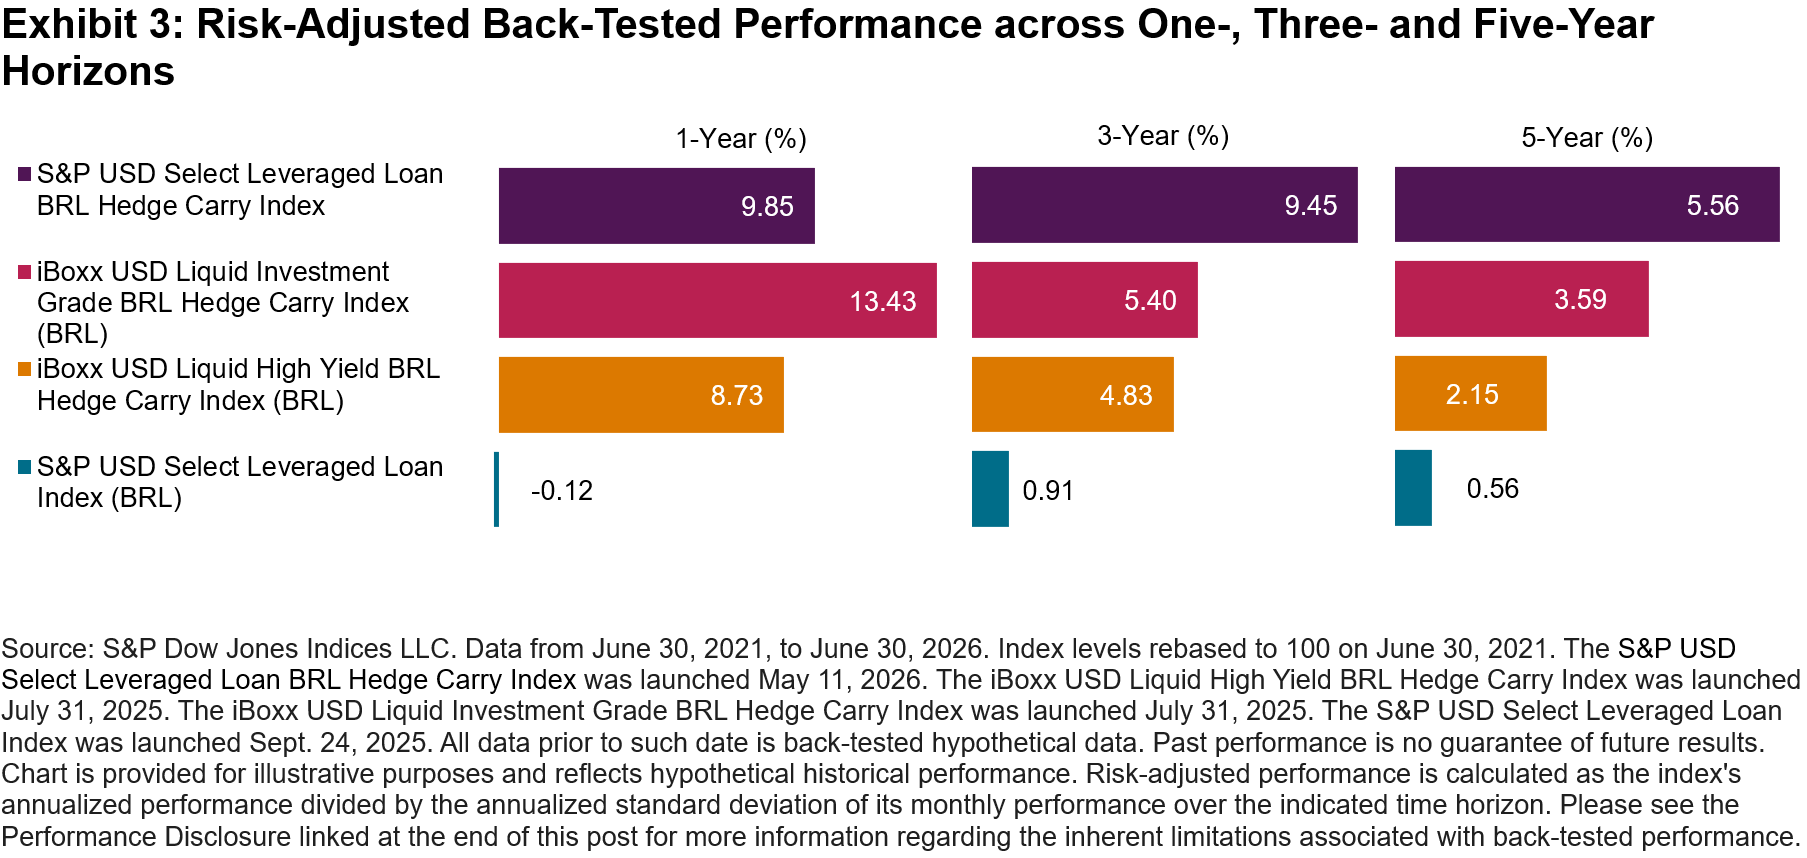
Comparing the S&P USD Select Leveraged Loan BRL Hedge Carry Index with its investment grade and high yield counterparts (the iBoxx USD Liquid Investment Grade BRL Hedge Carry Index and the iBoxx USD Liquid High Yield BRL Hedge Carry Index, respectively), illustrates how different U.S. credit segments have performed within a BRL-hedged framework. As shown in Exhibits 2 and 3, the back-tested analysis indicates that the leveraged loan strategy reported higher cumulative performance than the investment grade and high yield indices over the past five years, as well as higher risk-adjusted performance across the three- and five-year horizons. Over five years, the S&P USD Select Leveraged Loan BRL Hedge Carry Index gained 12.98% on an annualized basis with 2.34% annualized volatility, compared with 11.36% and 5.28% for the high yield index, and 10.43% and 2.90% for the investment grade index, respectively.

The comparison with the unhedged S&P USD Select Leveraged Loan Index (BRL) is equally notable: over five years, the S&P USD Select Leveraged Loan Index (BRL) gained an annualized 6.67% with 11.89% annualized volatility. The one-year comparison further illustrates this observation—the S&P USD Select Leveraged Loan BRL Hedge Carry Index gained 13.80%, while the S&P USD Select Leveraged Loan Index (BRL) posted -1.24%, as appreciation of the Brazilian real weighed on U.S. dollar-denominated performance.
S&P Dow Jones Indices brings extensive experience in index design, transparency and rules-based methodologies to this fixed income space. The S&P USD Select Leveraged Loan BRL Hedge Carry Index reflects S&P DJI’s ability to combine established market benchmarks—the S&P USD Select Leveraged Loan Index and the S&P/B3 BRL-USD Mini Futures Index—into a single index solution. This cross-market index innovation provides a transparent and replicable framework that may be used for benchmarking purposes or as the basis for index-linked products.

The posts on this blog are opinions, not advice. Please read our Disclaimers.

Ballots and Benchmarks: How Elections Shake Markets around the World

Contributor Image
Lucas Hyman

Quantitative Analyst, Index Investment Strategy

S&P Dow Jones Indices

Every election season brings a familiar ritual: wall-to-wall media coverage, confident predictions and no shortage of opinions about what a given outcome will mean for markets. But does the noise translate into measurably significant market movement? And if it does, does it matter equally everywhere?

To find out, we examined equity index performance around election dates across seven countries, spanning a selection of developed and emerging markets—and what we found challenges some common assumptions. Market reactions to elections are far from uniform, and not always as extreme as pundits predict.

How We Measured Election Effects

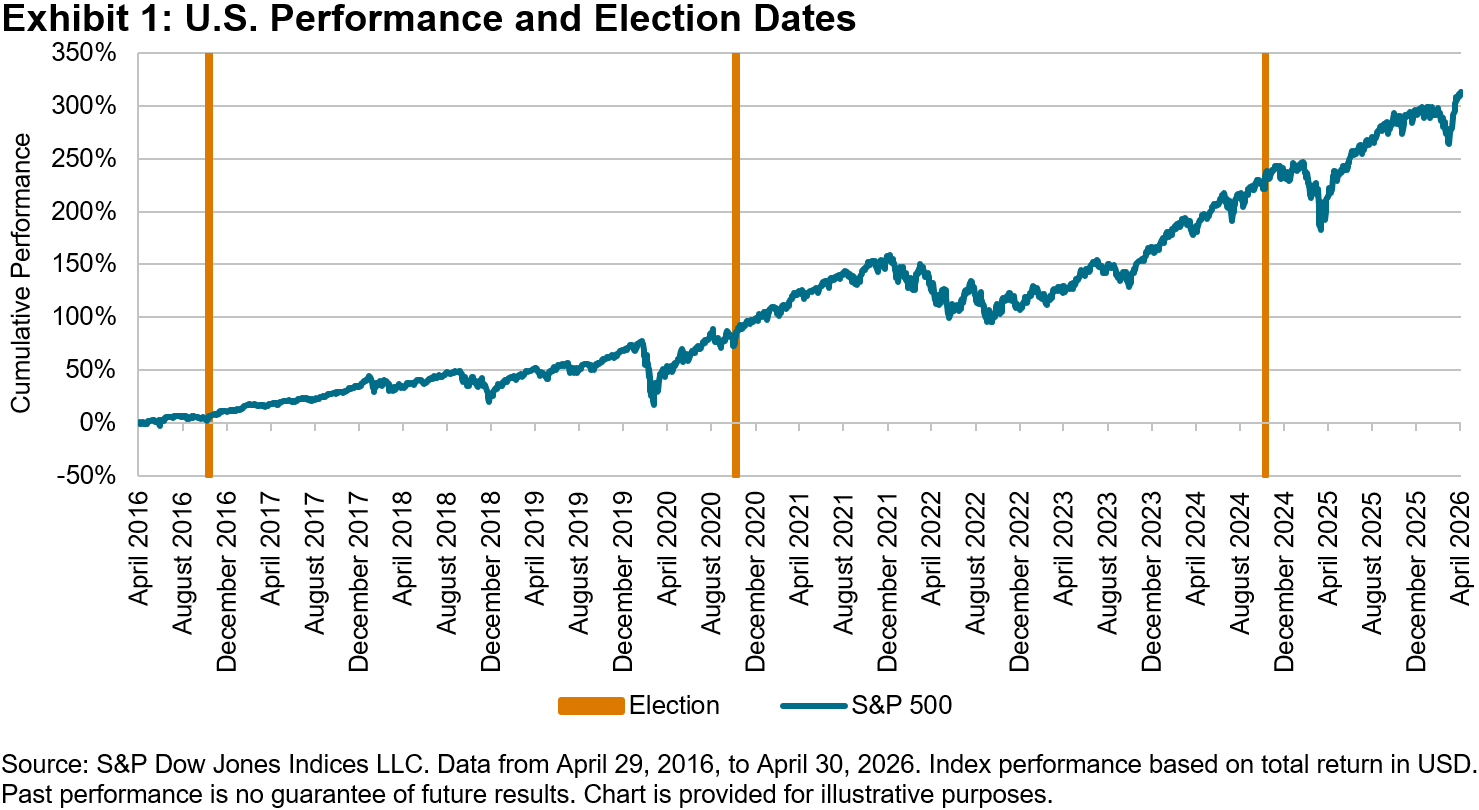
We analyzed performance of local benchmarks in the U.S. (S&P 500®), Mexico, Brazil, Chile, Japan, the U.K. and Germany (single-country indices from the S&P Global BMI) from April 2016 to April 2026. All indices are expressed in their local currencies.

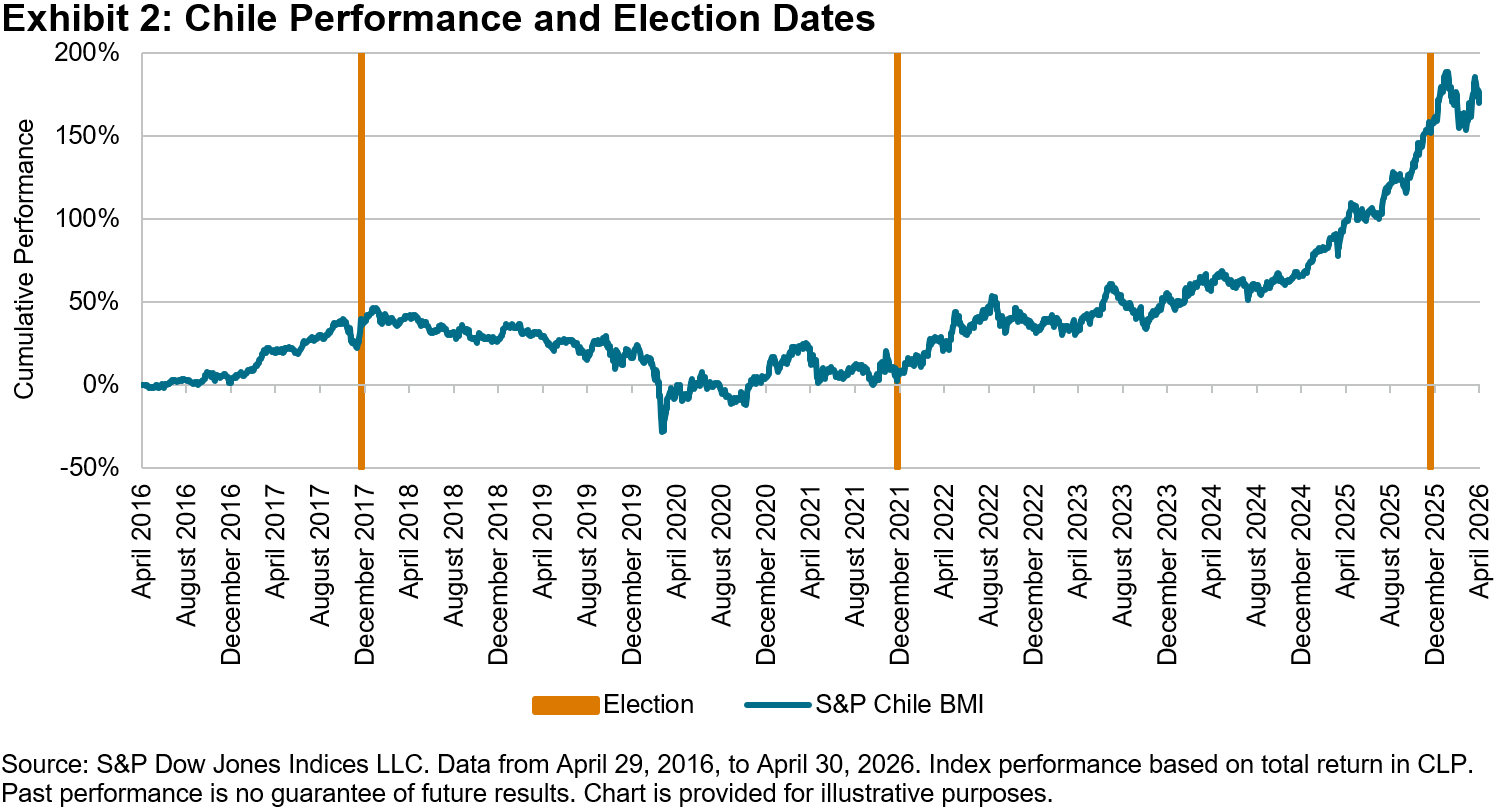
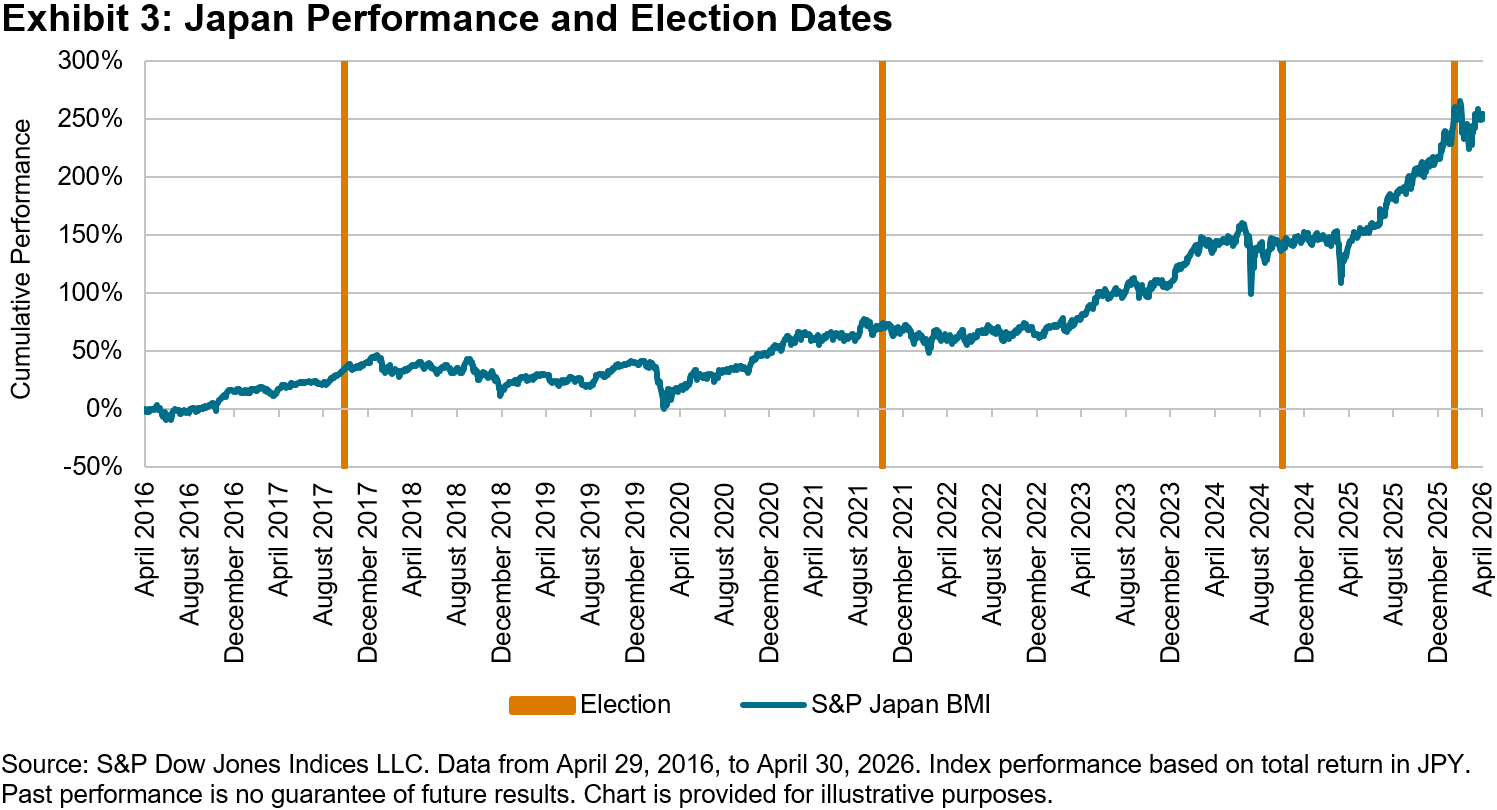
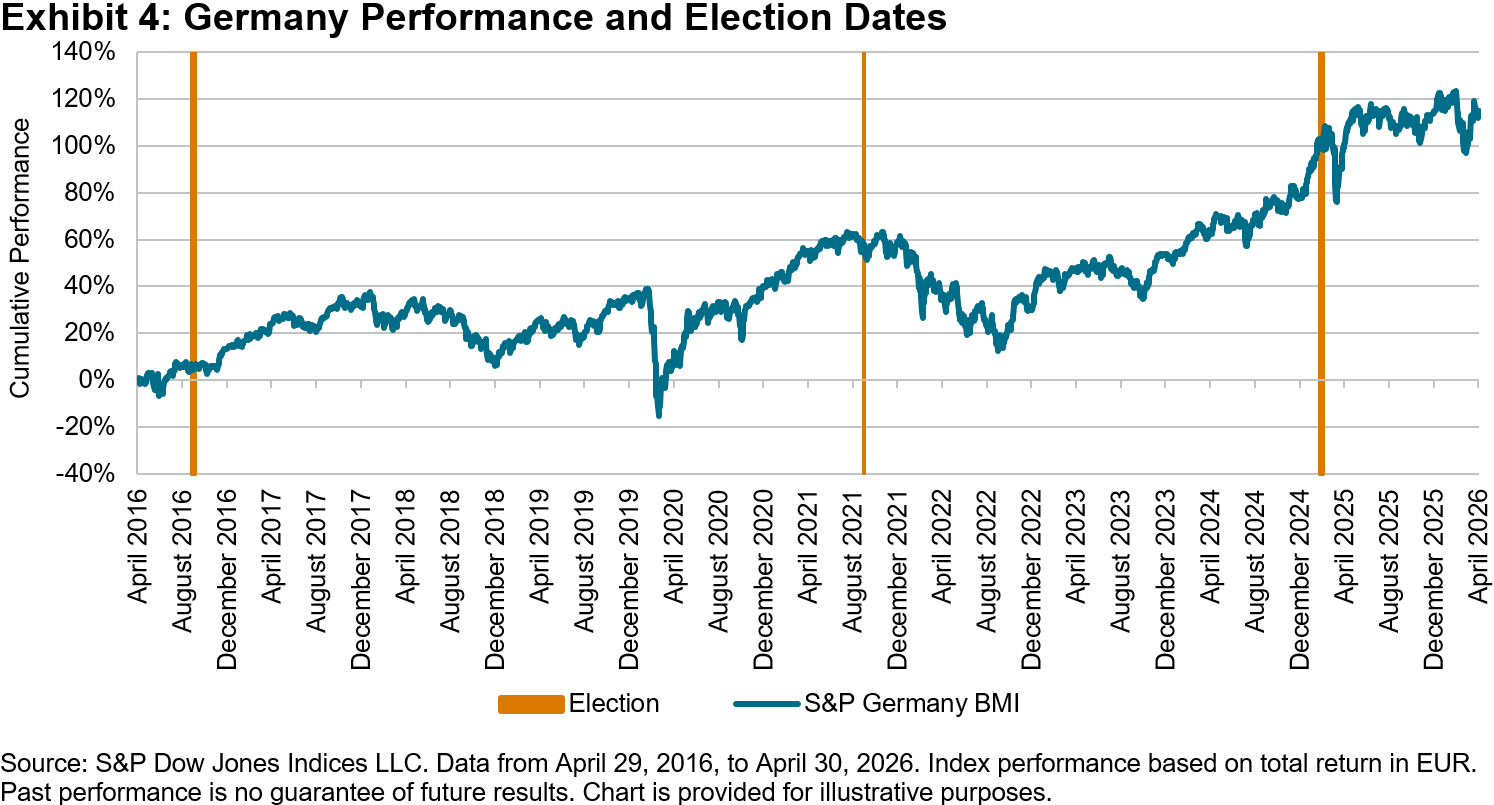
Performance of local indices indicate some seemingly significant fluctuations in performance around election dates, as shown in a sample of our observed countries in Exhibits 1-4, but similar bouts of volatility outside of election cycles suggest other factors may drive market changes even more.

To standardize analyses of short-term election effects, we measured the absolute value of performance over the five-day period following federal election dates for new leaders in each selected country and compared them to a baseline of non-election periods across the same time frame.

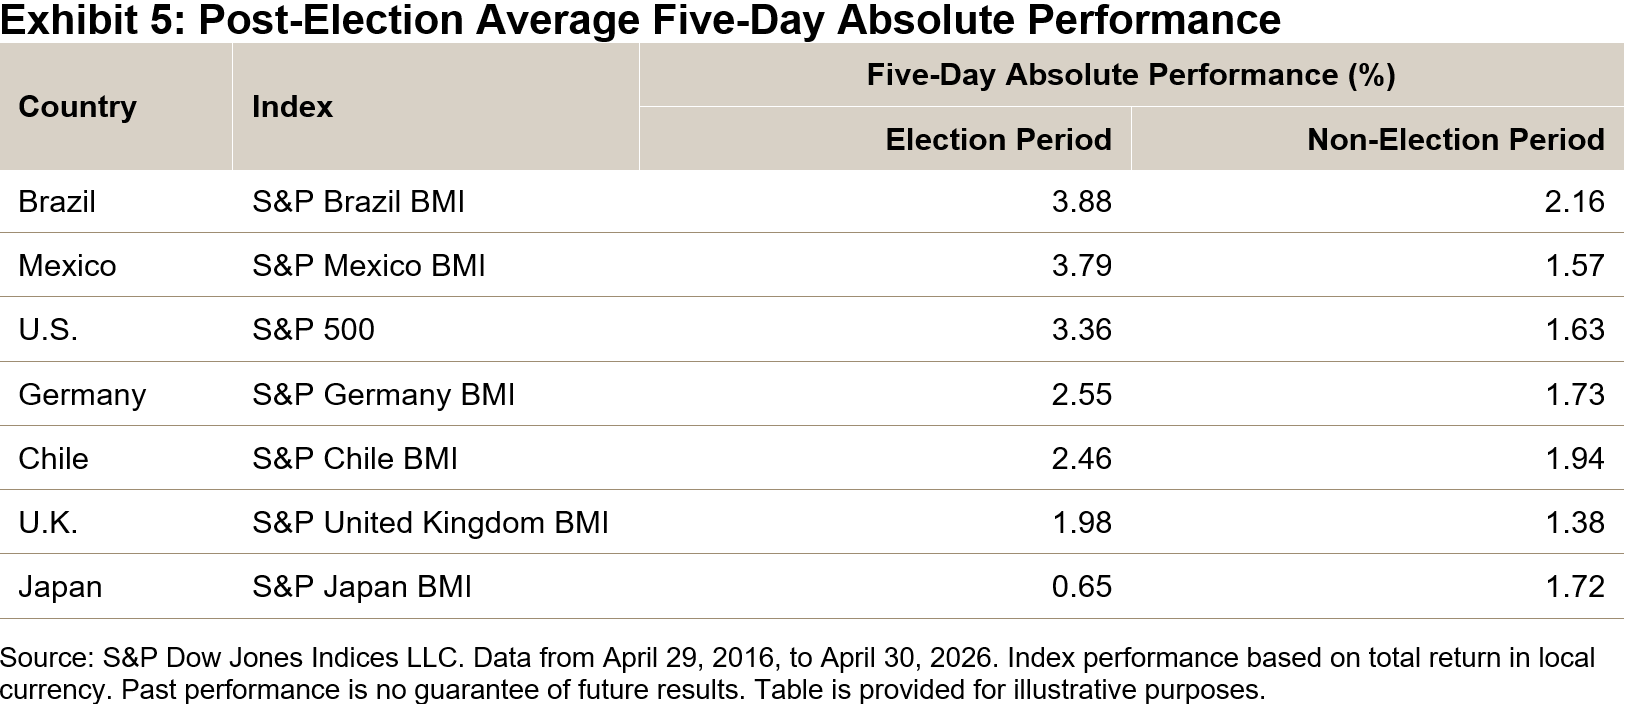
The clearest pattern in the data indicated that short-term election effects varied significantly, as shown in Exhibit 5.

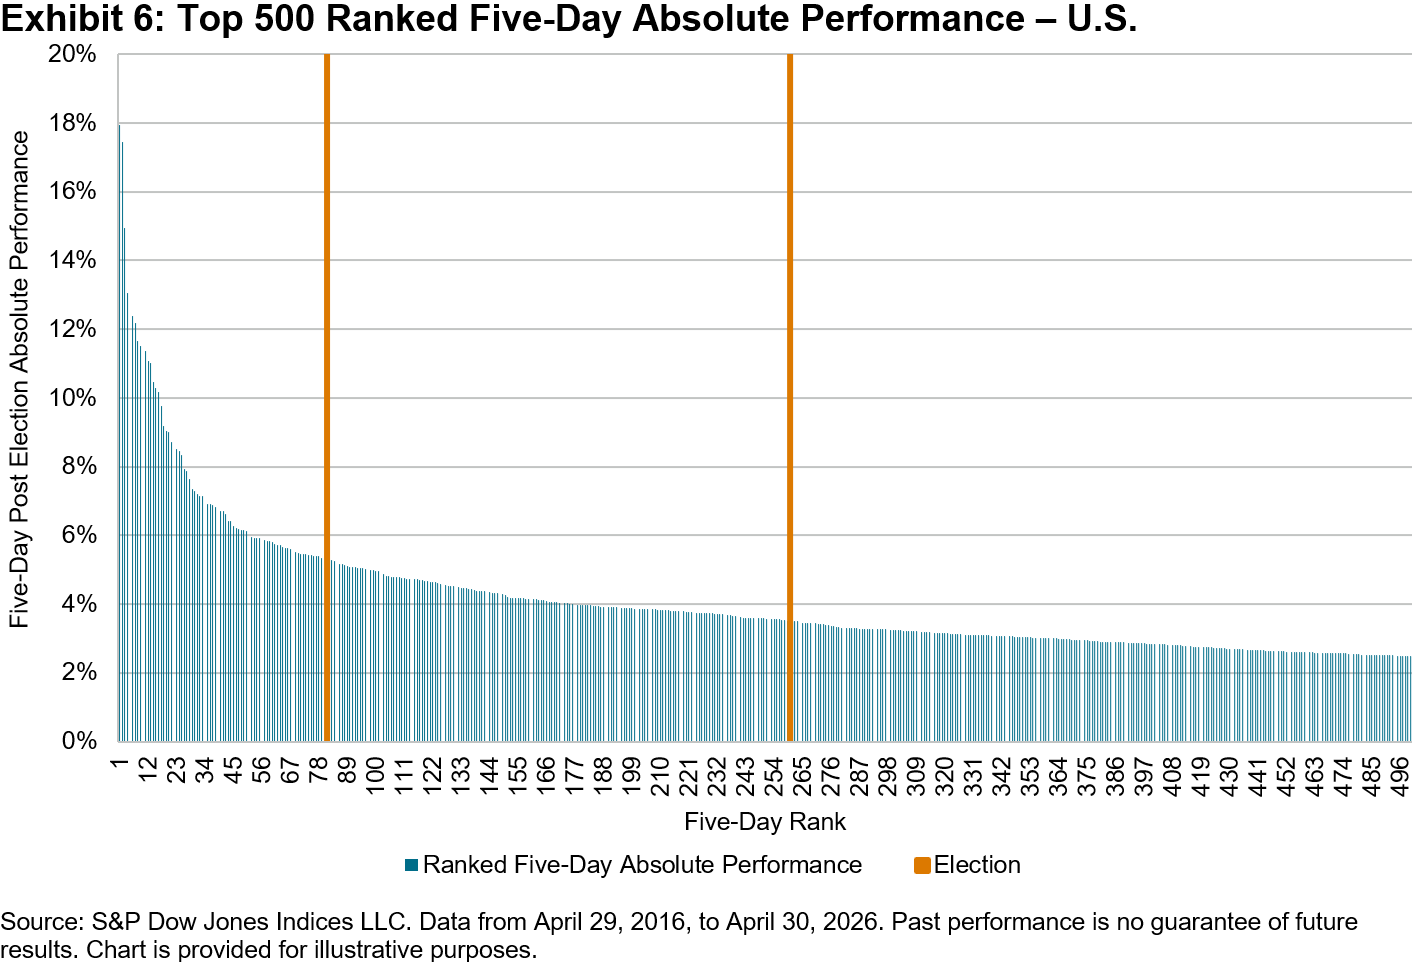
Looking beyond the averages and examining periods with the highest absolute index movement, we find that many election periods rank highly, but they are far from the most volatile periods encountered in these markets, as shown through the top 500 ranked five-day periods in the U.S. as shown in Exhibit 6.

Among our seven observed countries, five-day post-election market performance ranked in the top half of observed periods slightly more than half the time, suggesting national elections indeed are associated with above-average short-term volatility. However, there are plenty of volatile periods of more extreme market performance that underscore the impact of unexpected non-election events as well.

The implication is clear; election effects are real, but difficult to predict in direction, magnitude and timing. Investor reactions to expected election outcomes may occur well before or even well after election days, as polling and other news is taken into account. Markets may move for a variety of reasons, including elections, but drivers may be more nuanced. Analyzing which stocks, industries and sectors are most affected by local market events can paint a clearer picture of how investors are responding to all types of news, whether it’s related to the ballot box or not.

The posts on this blog are opinions, not advice. Please read our Disclaimers.
How and Why Institutions Are Evolving Their ETF Usage

What’s driving the continued growth of ETF adoption among institutional investors? Explore the expanded range of ETF applications across portfolio types and objectives. 


The posts on this blog are opinions, not advice. Please read our Disclaimers.
Targeting the Drivers of Dividend Strength: A First Look at the S&P 500 Dividend Drivers Index

Contributor Image
George Valantasis

Director, Factors and Dividends

S&P Dow Jones Indices

S&P Dow Jones Indices is pleased to introduce the new S&P 500® Dividend Drivers Index, which offers a holistic approach to identifying dividend-paying companies within the S&P 500. Unlike traditional approaches that emphasize a single metric—such as high yield or dividend growth—the index focuses on the key drivers of dividend strength. It combines historical and forward-looking dividend growth, current dividend yield, and profitability to deliver a three-dimensional assessment that encompasses past, present and future potential.

In this first blog post, we’ll explore its methodology and compare its performance, dividend characteristics and profitability profile with those of its underlying universe, the S&P 500.

Methodology

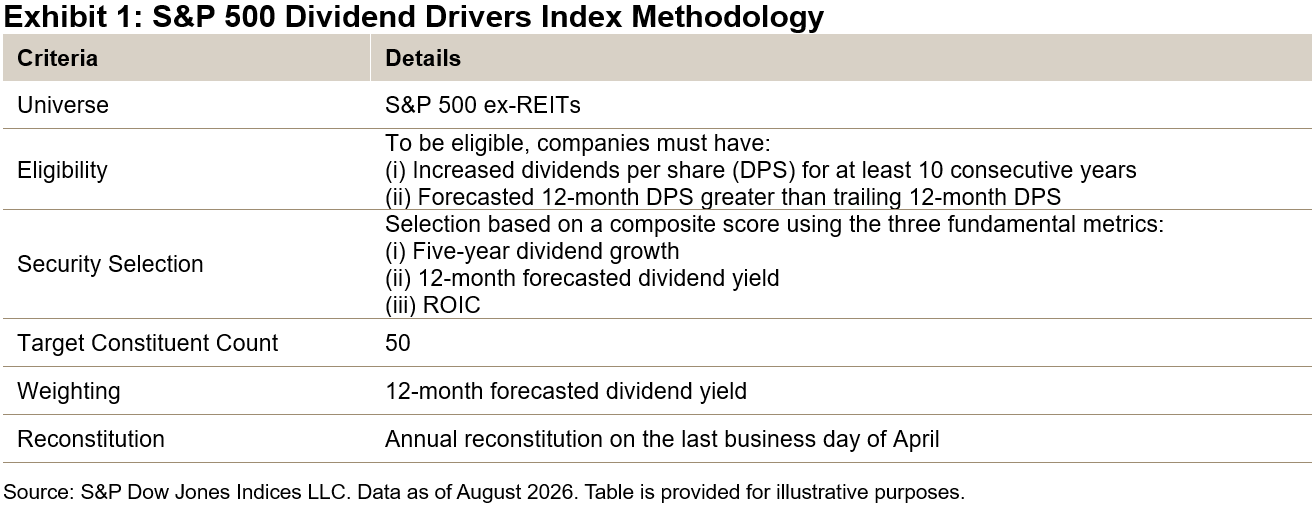
To be eligible, companies must have increased their dividends for at least 10 consecutive years. They must also have an expected dividend increase for the upcoming year, based on S&P Global Market Intelligence’s Dividend Forecasting dataset.

Eligible companies are then selected using a composite score that combines three fundamental measures: five-year dividend growth, 12-month forecasted dividend yield and return on invested capital (ROIC). Final index weights are then determined based on each constituent’s 12-month forecasted dividend yield.

Performance Overview

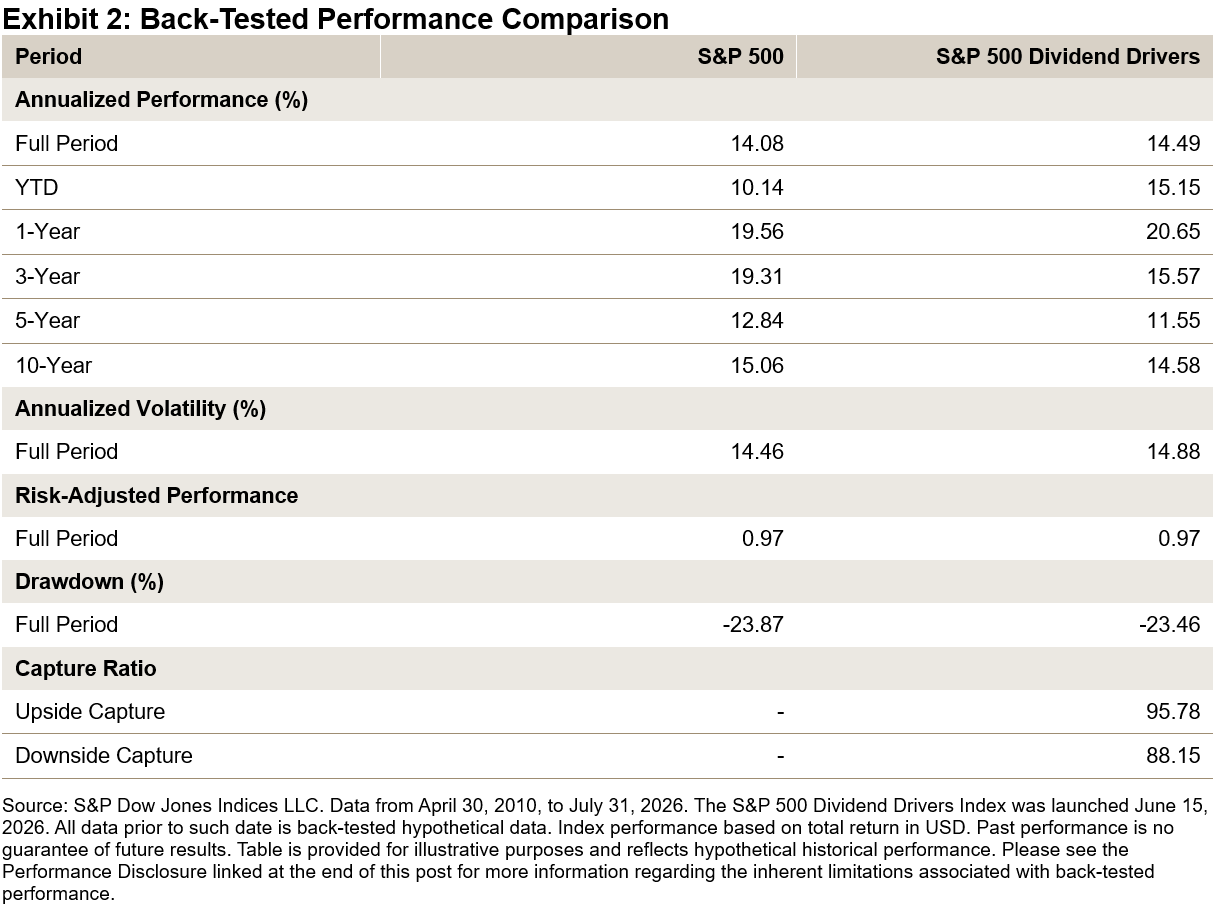
Based on the back-tested period from April 30, 2010, to July 31, 2026, the S&P 500 Dividend Drivers Index outpaced the S&P 500 by approximately 41 bps on an annualized basis. This result is notable given that dividend-oriented stocks generally lagged during the long bull market over this period, which was largely driven by lower-yielding growth and technology companies. While the S&P 500 Dividend Drivers Index exhibited slightly higher volatility than the S&P 500, its defensive characteristics were reflected in its lower capture ratios, particularly its 88.15 downside capture ratio over the period.

Dividend Characteristics

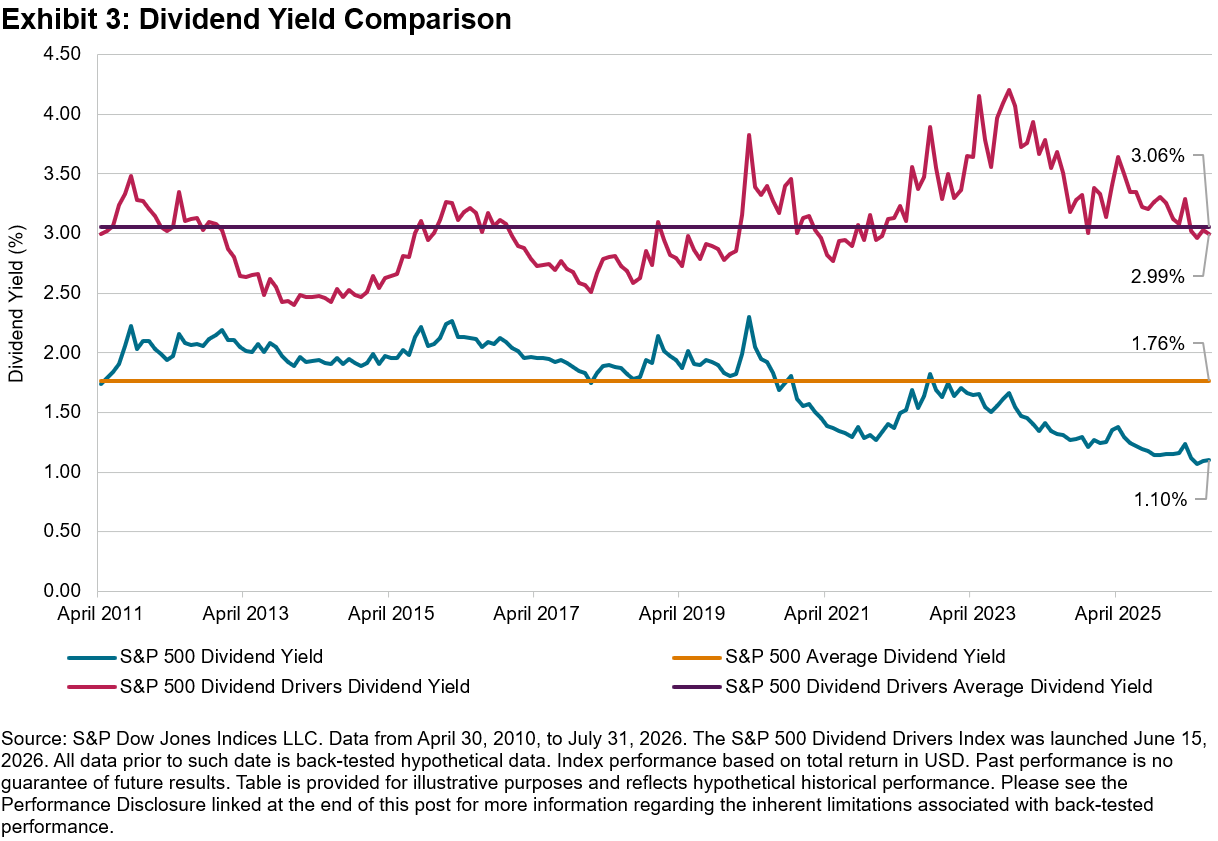
Across the full back-tested period, the S&P 500 Dividend Drivers Index had an average dividend yield of 3.06%, significantly higher than the S&P 500’s 1.76%. With the S&P 500’s current yield at 1.10% and well below its historical average, the S&P 500 Dividend Drivers Index’s current yield of 2.99% stands out in today’s low-yield equity market environment.

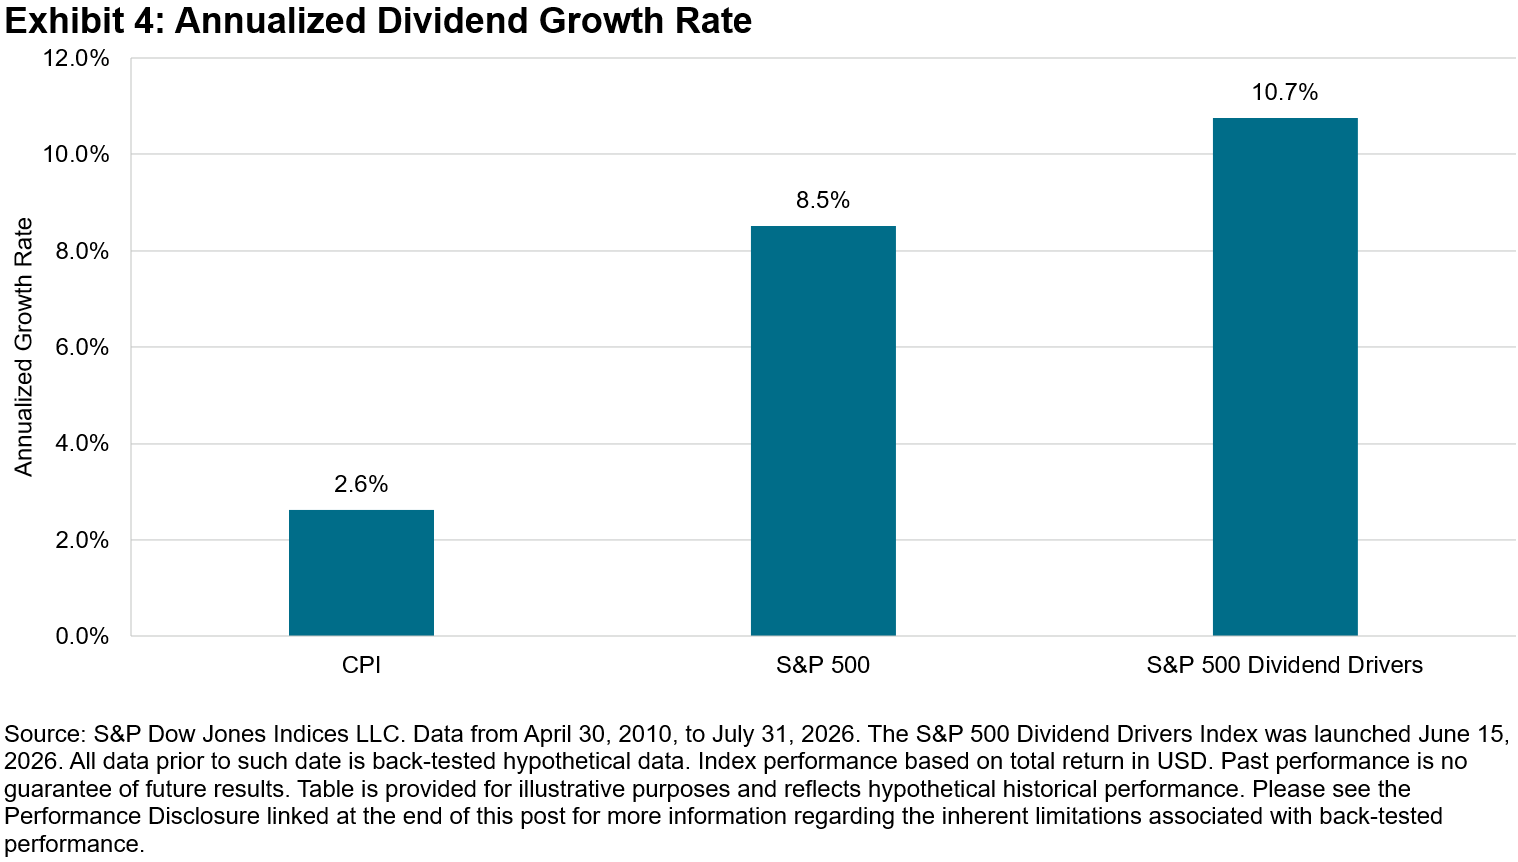
The back-tested results also indicated stronger dividend growth. Over the same period, the S&P 500 Dividend Drivers Index posted an annualized dividend growth rate of 10.7%, outpacing both the S&P 500 (8.5%) and the CPI inflation rate (2.6%). The gap between dividend growth and CPI inflation—about 8 percentage points—corresponded to a 3.2-fold increase in purchasing power since April 2011, after accounting for inflation.

Profitability Comparison

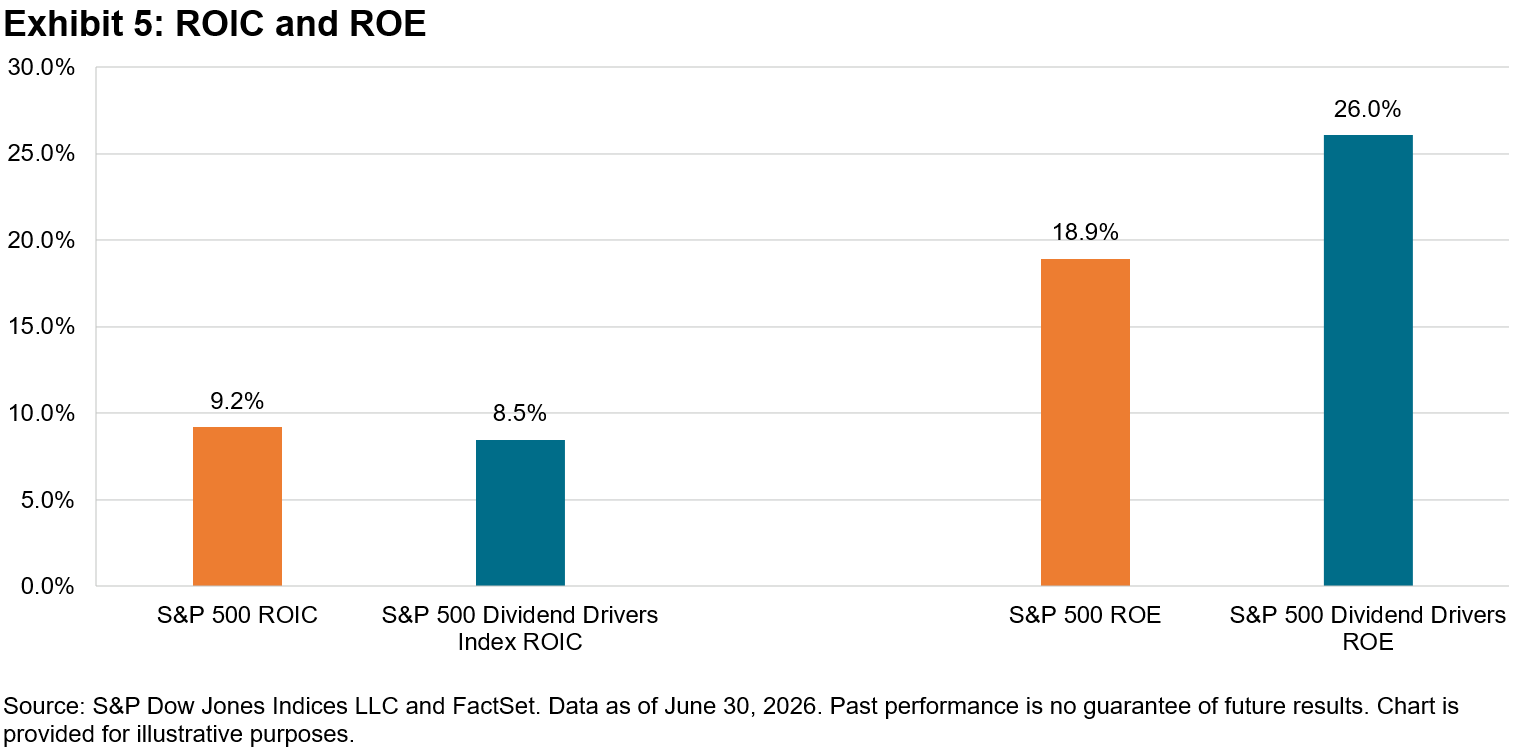
A distinctive feature of the S&P 500 Dividend Drivers Index as a dividend strategy is its emphasis on profitability. Exhibit 5 shows that, as of June 30, 2026, the S&P 500 Dividend Driver Index’s ROIC was broadly in line with that of the S&P 500, while its return on equity (ROE) of 26.0% was significantly higher. High profitability is a defining characteristic of the index, as it has historically been associated with earnings growth, a key factor in supporting long-term dividend growth potential.

Conclusion

The S&P 500 Dividend Drivers Index provides a more comprehensive view of dividend drivers across multiple characteristics and time horizons. The index modestly outperformed the S&P 500 over the back-tested period and exhibited significantly higher dividend yield, dividend growth and profitability. Overall, these results suggest that incorporating multiple drivers in the selection process led to both differentiated performance outcomes and distinct index characteristics relative to the benchmark.

The posts on this blog are opinions, not advice. Please read our Disclaimers.
S&P TIP Global AllCap Index: A New Tool for Tracking Diversification and Limiting Concentration Risk in Global Equities

How does an index framework built with diverse constituents from 48 global markets help address concentration concerns in an efficient, simplified way? 

The posts on this blog are opinions, not advice. Please read our Disclaimers.