












How does an index framework built with diverse constituents from 48 global markets help address concentration concerns in an efficient, simplified way?
The posts on this blog are opinions, not advice. Please read our Disclaimers.S&P TIP Global AllCap Index: A New Tool for Tracking Diversification and Limiting Concentration Risk in Global Equities
Mondo Mashups
The S&P Developed Ex-North America Dividend Growers Index: Dividend Discipline, Defensive Characteristics and Outperformance
Indexing Autocalls
Broadening the Base
S&P TIP Global AllCap Index: A New Tool for Tracking Diversification and Limiting Concentration Risk in Global Equities
Mondo Mashups

Whether you call it soccer or football, there’s no denying the World Cup was a blast for North Americans and visitors alike. Off the field, one of the most enjoyable spectator sports was watching camaraderie emerge from road trips and cultural mashups. Whether it was the Tartan Army firing up the Miami Marlins, Samurai Blue fans discovering Buc-ee’s brisket, or Lawrence, Kansas embracing all-things Algeria, unexpected combinations often bring the greatest results.
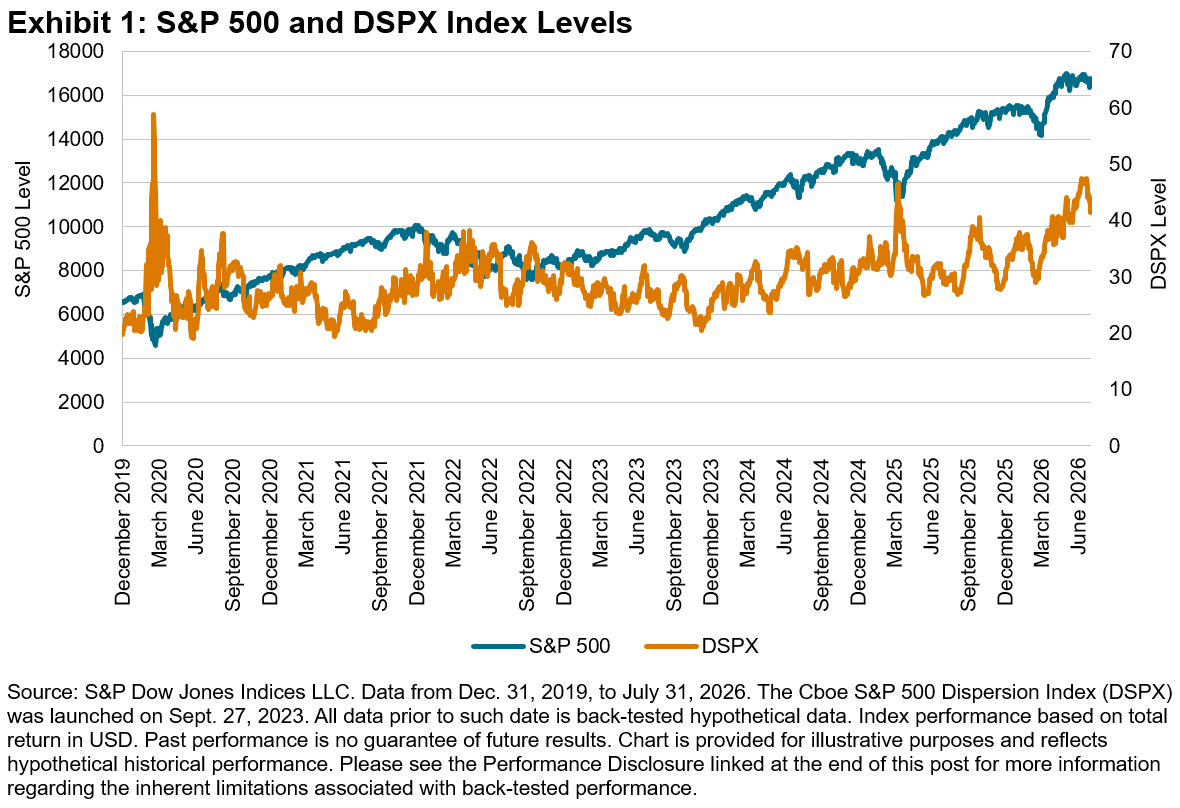
From a U.S. equities perspective, the first seven months of 2026 combined to produce sound results, but with strong headline index performance masking underlying macroeconomic uncertainty and broadening market leadership. A defining indicator of this current regime is the Cboe S&P 500® Dispersion Index (DSPX). As of July 21, 2026, the DSPX reached 47.5, its highest level since March 2020, as shown in Exhibit 1. Elevated dispersion indicates significant variance in constituent performance, potentially creating a more favorable environment for factor-based strategies.
Among the multiple factors that have benefitted from a high-dispersion environment, the S&P 500 Momentum Index stands out, rising 20.2% YTD (see Exhibit 2).
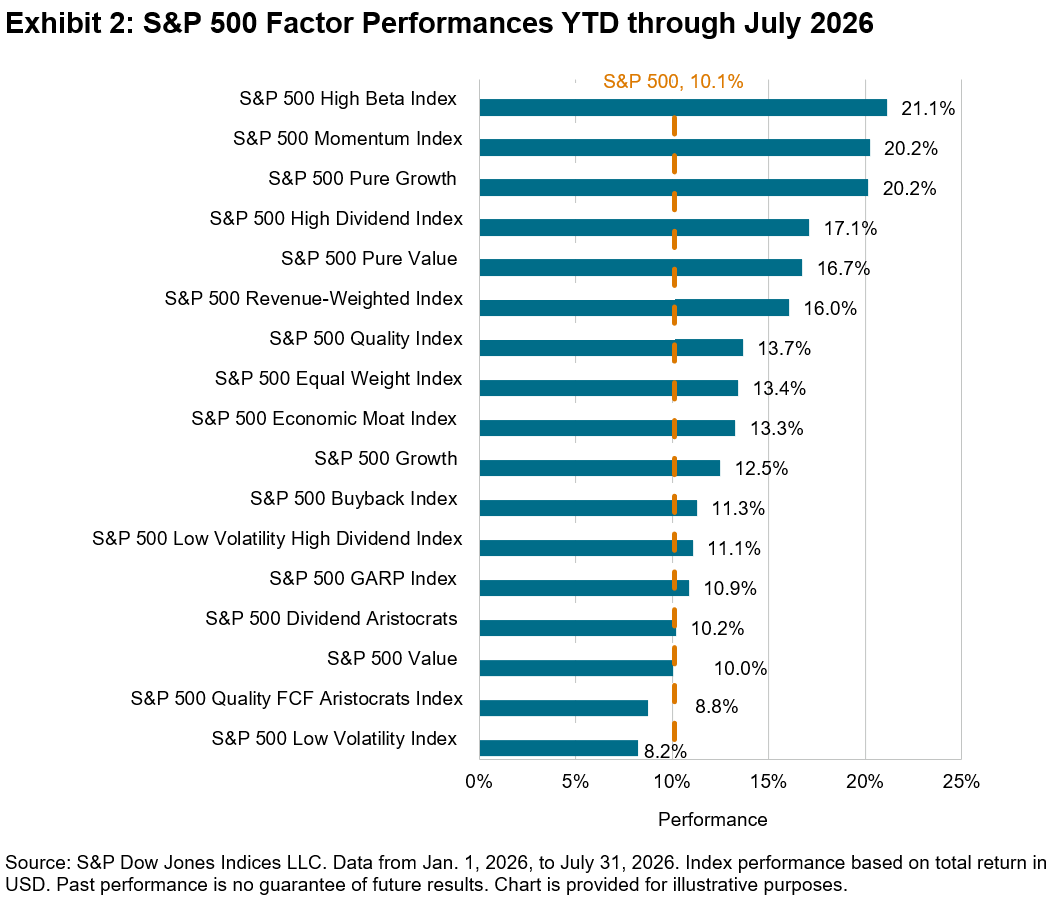
While the S&P 500 Momentum Index’s outperformance so far in 2026 has owed much to its current selection of semiconductors stocks, further down in Exhibit 2 sits a less discussed factor that has fared relatively well YTD despite completely eschewing the Semiconductor & Semiconductor Equipment industry group—the S&P 500 Low Volatility Index.
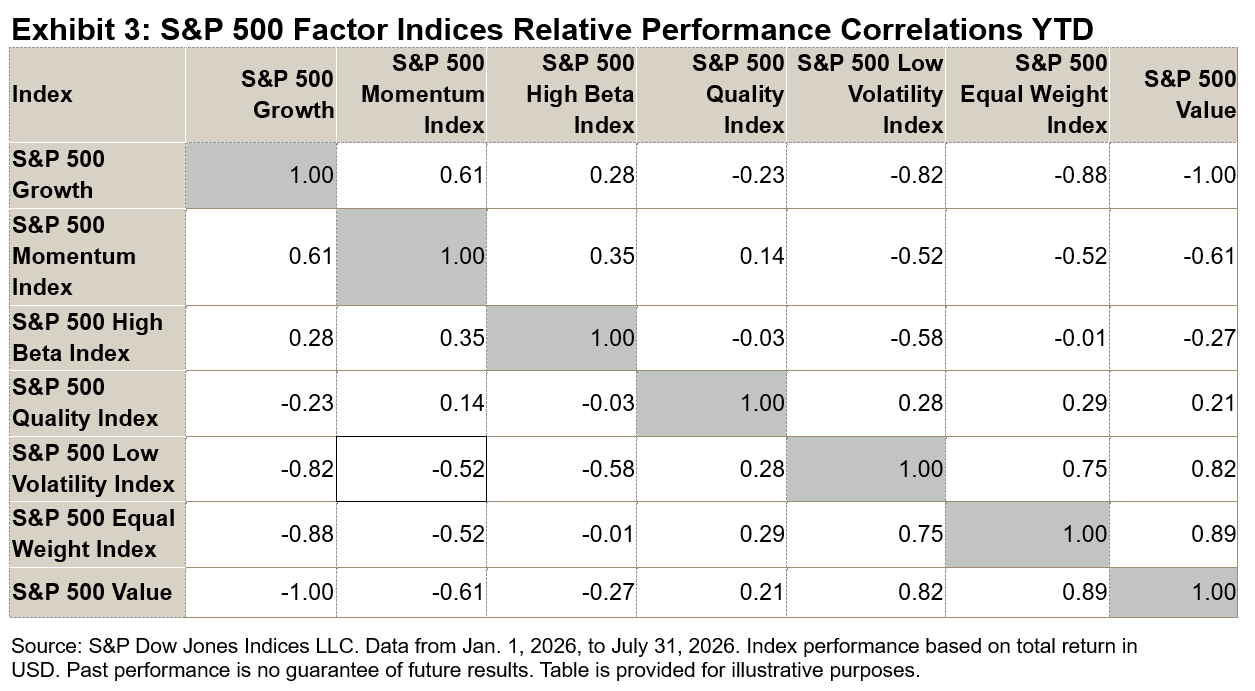
As the AI narrative cooled in July and the S&P 500 Momentum Index pulled back, the S&P 500 Low Volatility Index generated outperformance, a short-term result that points to a longer-term pattern of low, and even negative, correlation with the S&P 500 Momentum Index. As of July 2026, the one-year rolling correlation coefficient between the excess performance of the S&P 500 Low Volatility Index and the S&P 500 Momentum Index stood strongly negative, at -0.52 (see Exhibit 3).
In Exhibit 4, we take a closer look at these two factors through the lens of trailing one-year performance, underscoring how the S&P 500 Low Volatility Index and S&P 500 Momentum Index have behaved quite differently depending on the market regime.
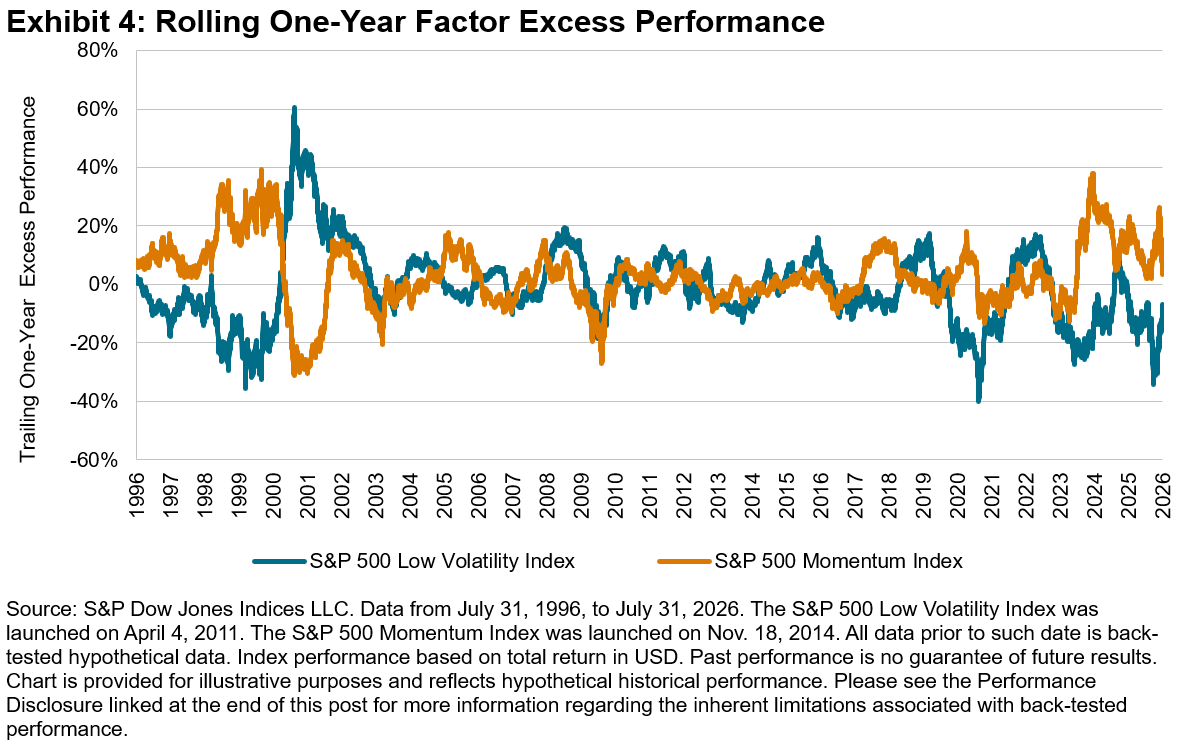
We’ve previously discussed the S&P 500 Momentum Index’s historical pattern of outperformance in up-cycles and the S&P 500 Low Volatility Index’s resilience in market downturns. Indeed, both factors have historically reflected slightly more upside than downside, yet remained uncorrelated, suggesting a possibility for performance improvement and diversification through combination.
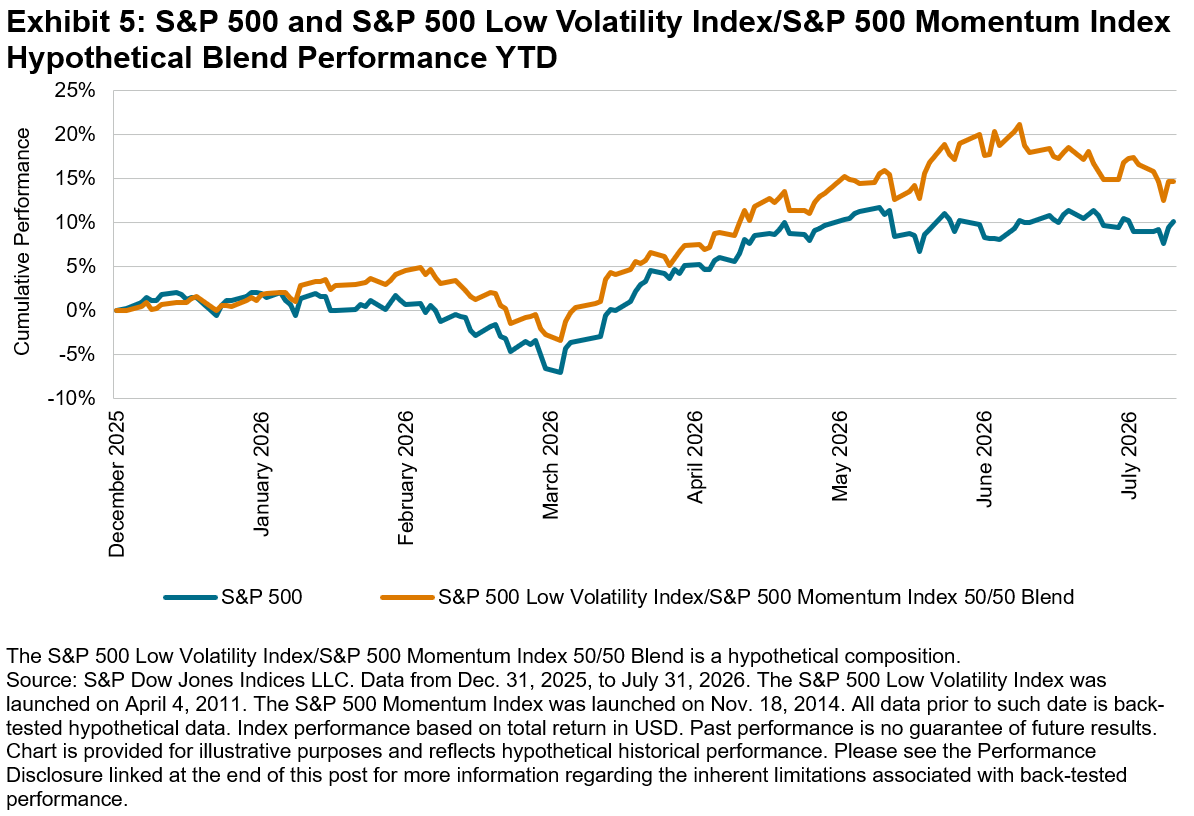
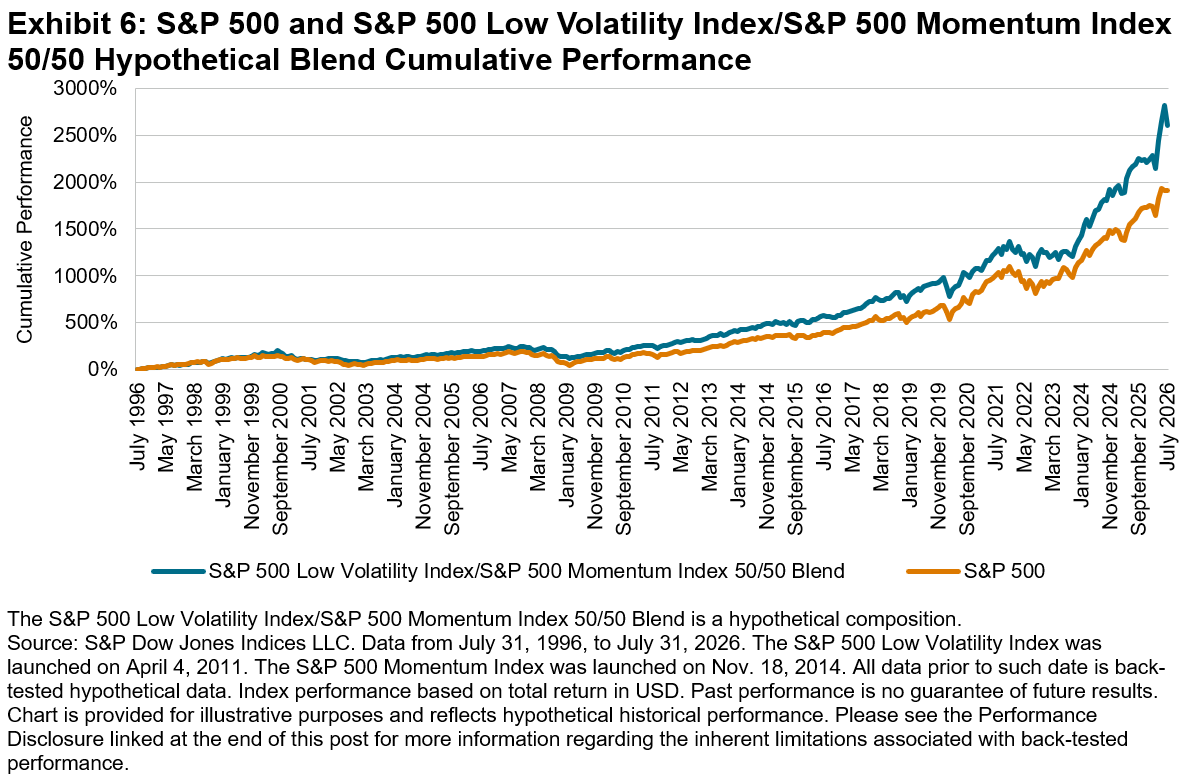
To investigate this thesis, we created a hypothetical index blend consisting of a 50% weight in the S&P 500 Low Volatility Index and a 50% weight in the S&P 500 Momentum Index, then measured its performance relative to the S&P 500 over a 30-year time horizon as well as the YTD 2026 period.
Exhibit 5 illustrates the 2026 YTD performance of the unrebalanced hypothetical blend, which outperformed the S&P 500 benchmark by 4.5% and outperformed for most of the period.
Perhaps owing to the S&P 500 Low Volatility Index’s track record of asymmetric upside/downside capture (i.e., reflecting less downside than upside) combined with the S&P 500 Momentum Index’s demonstrated tendency to outperform in rising markets, the hypothetical blend exhibited a mix of the two factors’ traits, on average reflecting 87.8% of upside during the 12-month periods in which the S&P 500 rose and 61.0% of downside when the benchmark fell over the 30-year back-tested period. It should be no surprise that compounding this hypothetical differential through the ups and downs generated cumulative performance exceeding that of The 500® while also producing less volatility, as illustrated in Exhibit 6.
Individually, factor indices each tell interesting stories about behavioral and economic forces driving global markets. Like travelers of the world, they each come with their own unique histories full of ups and downs. They each evolve and reflect underlying trends, and their differences point toward the intriguing possibilities of new and diverse combinations waiting to be explored.
The author thanks Luke Twum-barima for his research contributions to this blog.
This content may be AI-assisted and is composed, reviewed, edited, and approved by S&P Global.
The posts on this blog are opinions, not advice. Please read our Disclaimers.The S&P Developed Ex-North America Dividend Growers Index: Dividend Discipline, Defensive Characteristics and Outperformance

In November 2025, S&P DJI expanded its S&P Dividend Growers Index Series by launching the S&P Developed Ex-North America Dividend Growers Index. Like its counterparts, the index focuses on companies with a consistent history of dividend payments, while excluding those with the highest yields to help reduce the risk of yield traps.1 Over the back-tested period, this disciplined approach generated robust long-term outperformance and strong defensive characteristics relative to its universe, the S&P EPAC BMI.
In this blog, we will provide an overview of the index’s methodology—including its rigorous criteria—and showcase its outperformance and key defensive characteristics.
Methodology
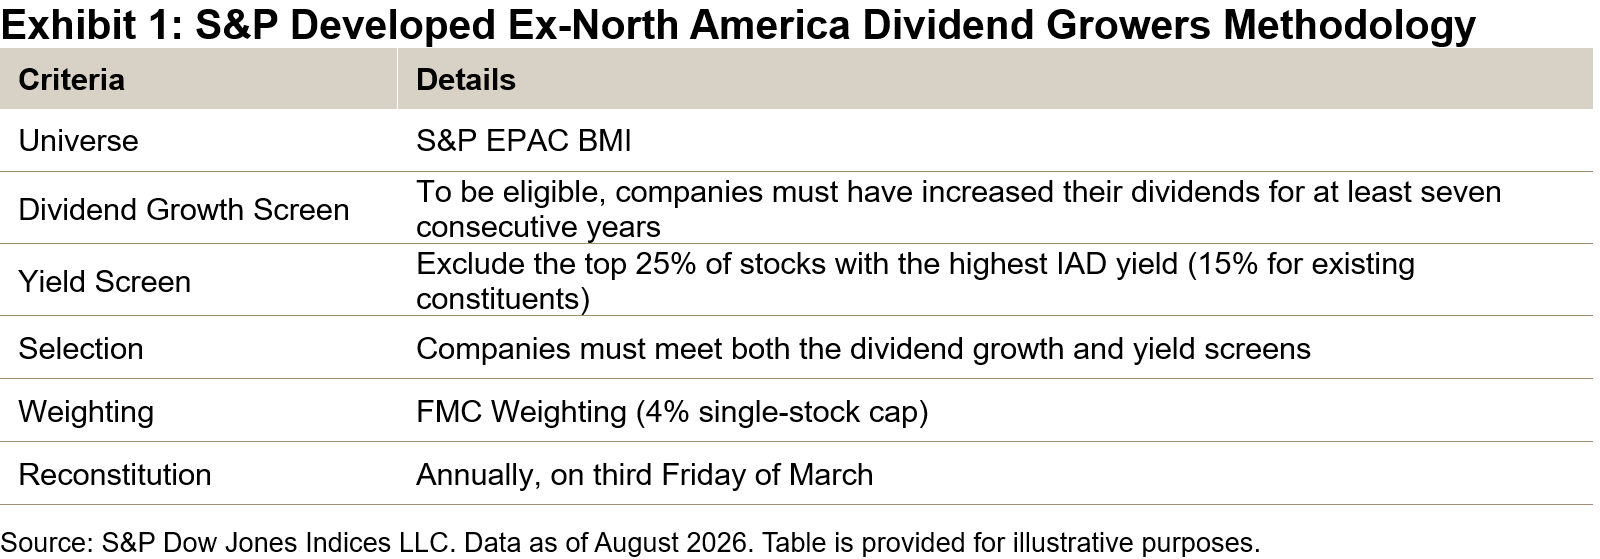
To qualify for inclusion, companies must have raised their dividends for at least seven consecutive years. Next, those ranked in the top 25% by indicated annual dividend (IAD) yield are excluded to help mitigate the risk of yield traps. Companies passing these screens are selected for the index and weighted by float-adjusted market capitalization (FMC).
The dividend growth and yield screens are the defining features of the S&P Dividend Growers Index Series. By working in tandem, these filters aim to enhance the overall quality of the index and drove its strong performance and defensive characteristics over the back-tested period, which will be explored in the following sections.
Performance
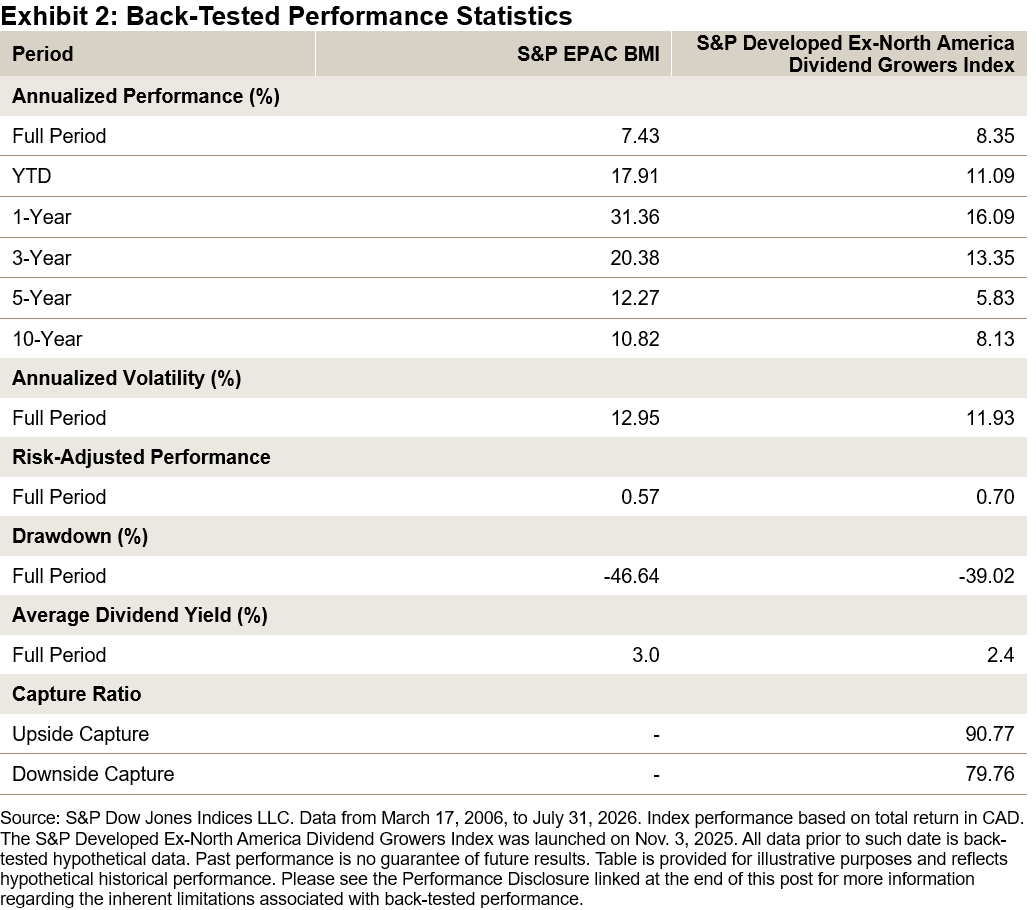
Over the 20 years of back-tested data since its inception, the S&P Developed Ex-North America Dividend Growers Index outpaced the S&P EPAC BMI by approximately 92 bps on an annualized basis. Notably, it delivered this outperformance while demonstrating defensive characteristics, including lower volatility (11.93% versus 12.95%), a smaller maximum drawdown (39.0% versus 46.6%) and more favorable capture ratios (90.77 upside and 79.76 downside) relative to the S&P EPAC BMI.
Beyond these standard measures of defensive characteristics, the next section delves deeper into how the index behaved during past drawdown events and across different macroeconomic environments.
Defensive Characteristics
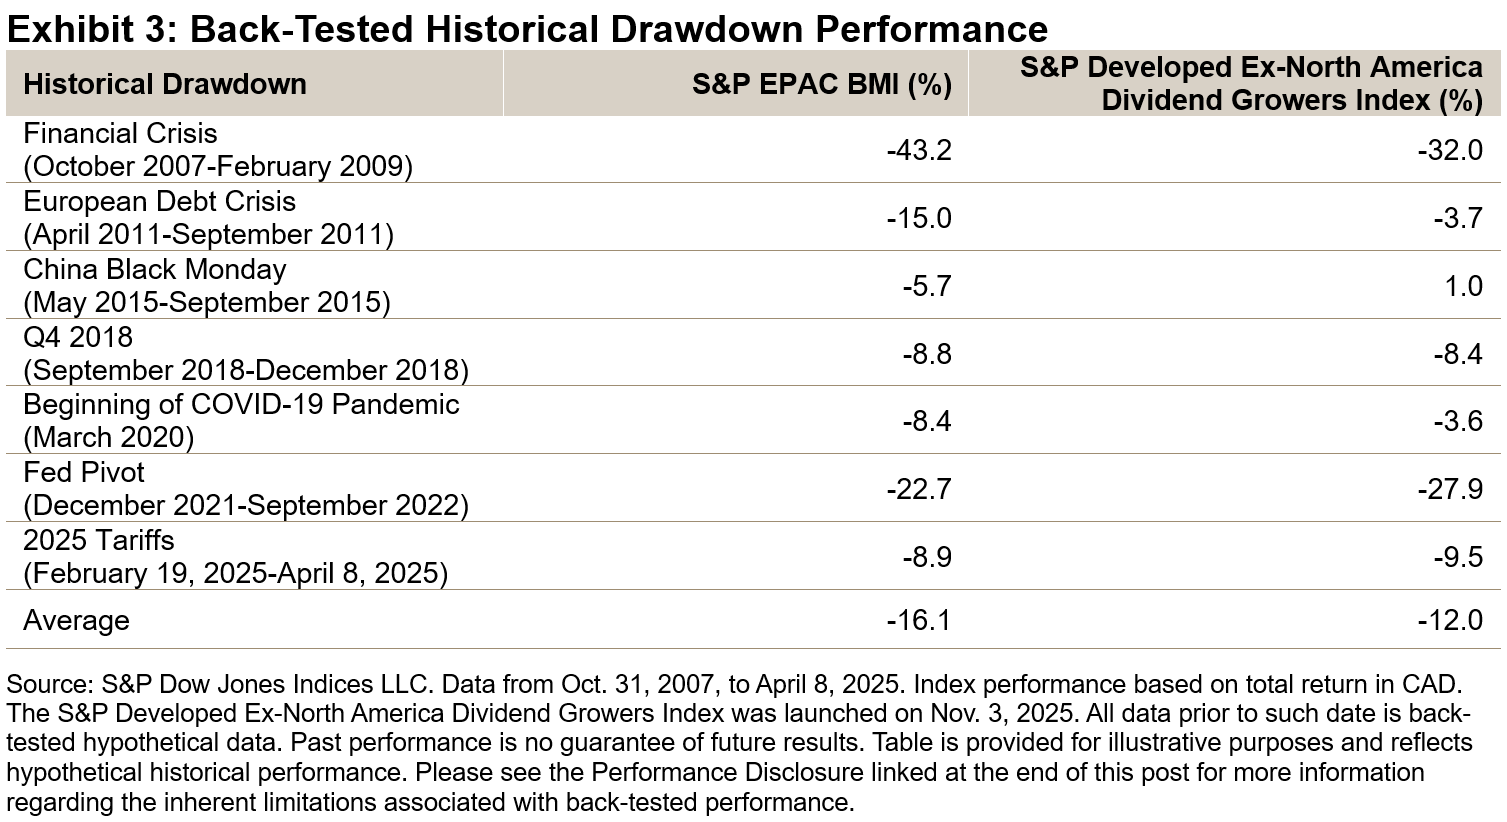
Over the back-tested period, the S&P Developed Ex-North America Dividend Growers Index outperformed the S&P EPAC BMI in five of the last seven major drawdown periods. During these drawdowns, it demonstrated downside protection, with an average decline of 12.0% compared with 16.1% for the S&P EPAC BMI.
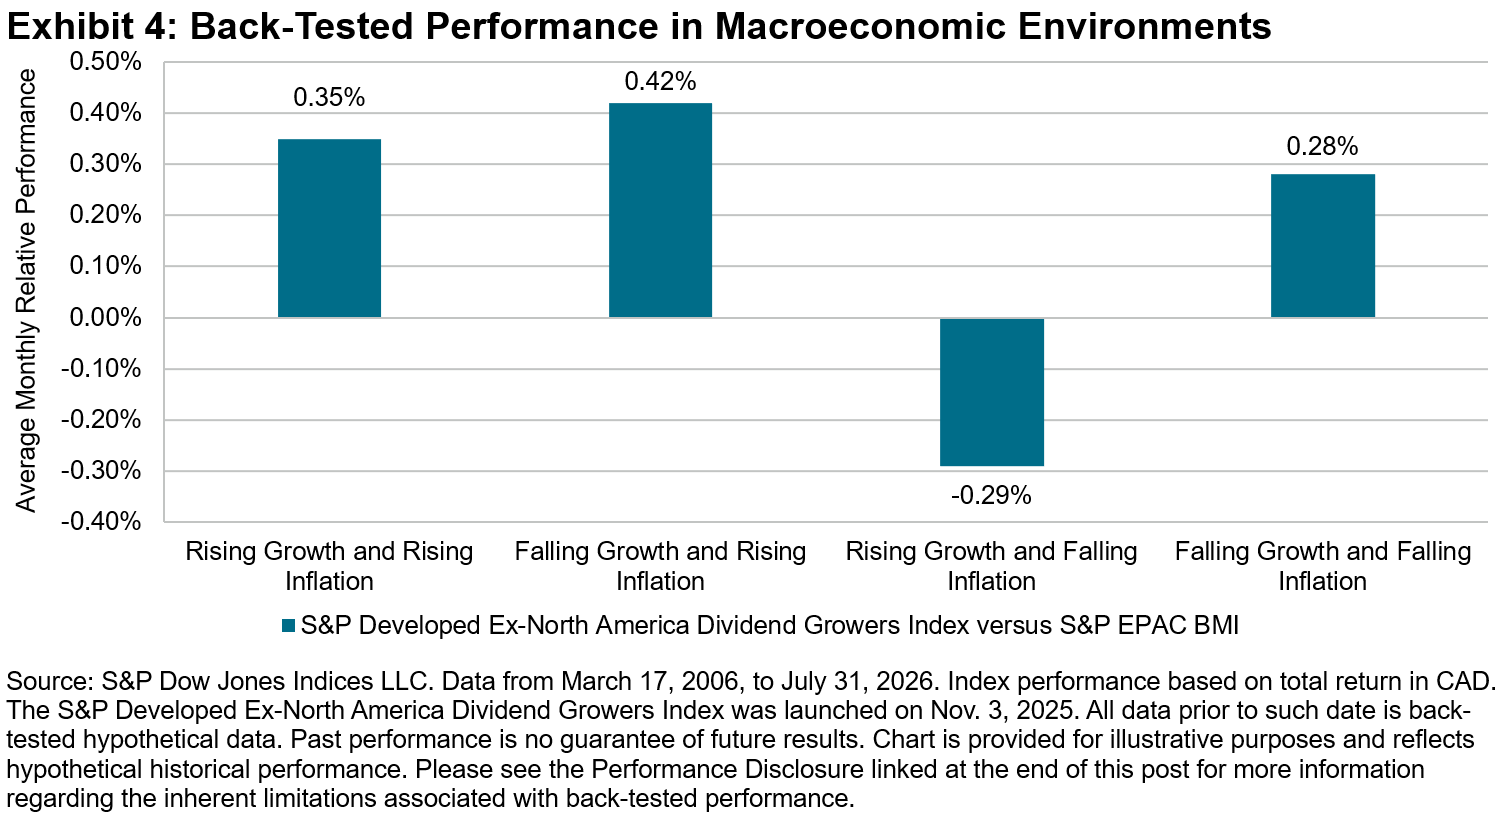
Defensive characteristics are further highlighted in Exhibit 4, which shows the index’s outperformance or underperformance across four macroeconomic environments defined by rising or falling inflation and growth. The index’s defensive profile is underscored by its outperformance in three of the four regimes, with its strongest results in the “risk-off” stagflationary environment (falling growth, rising inflation), while it lagged only in the “risk-on” regime characterized by rising growth and falling inflation.
Consistent Outperformance
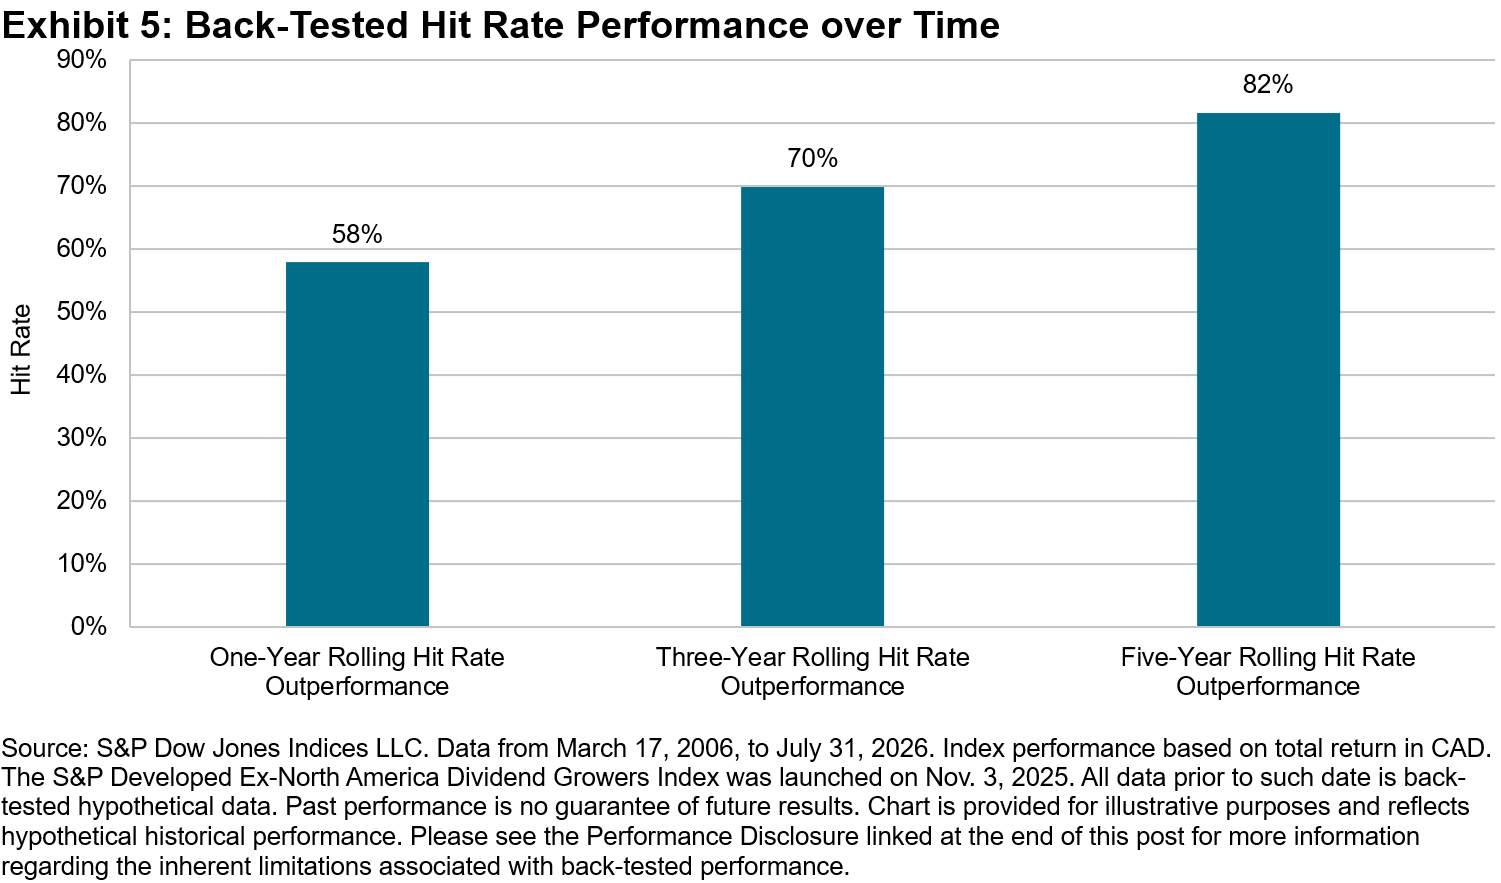
A key highlight from the back-tested period is the consistent outperformance of the S&P Developed Ex-North America Dividend Growers Index, which becomes more pronounced over longer investment horizons. The index outperformed the S&P EPAC BMI in 58% of one-year rolling periods, 70% of three-year rolling periods and a notable 82% of five-year rolling periods.
Conclusion
S&P DJI is pleased to expand the S&P Dividend Growers Index Series with the S&P Developed Ex-North America Dividend Growers Index. Like others in the broader series, the index’s rigorous methodology has led to strong long-term performance and defensive characteristics throughout the back-tested period.
1For more information about yield traps, please see: https://www.vanguard.com.au/personal/learn/smart-investing/investing-strategy/avoid-dividend-yield-traps
The posts on this blog are opinions, not advice. Please read our Disclaimers.Indexing Autocalls

Income-oriented indexing has entered a new phase. What began with relatively straightforward option-writing indices has evolved into a broader toolkit of rules-based strategies designed to reflect more targeted outcomes. This evolution reflects a shift in investor demand beyond pure beta exposure and toward outcome-oriented solutions. In recent years, systematic derivative income strategies have grown meaningfully across both ETFs and structured products.
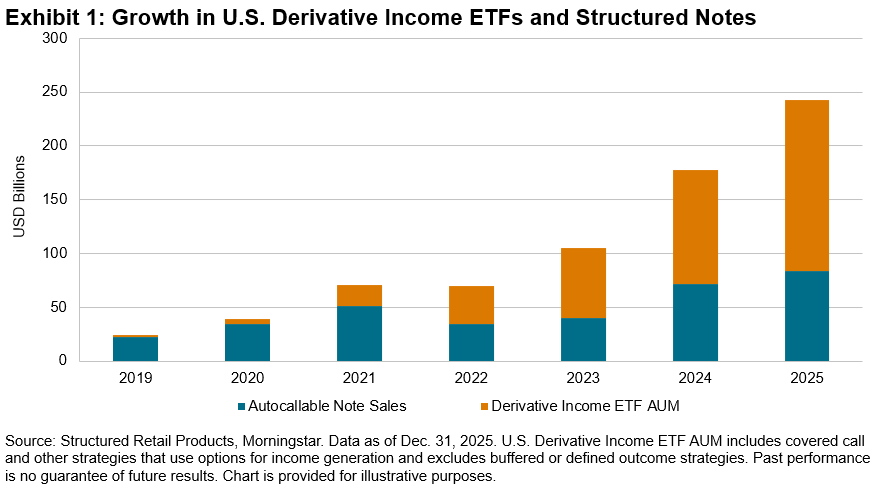
With the launch of the first autocallable ETF in 2025, sophisticated payoff structures that were once only accessible to a limited set of market participants via structured products are now available to the broader market. Indexing has helped make this innovation possible. Today, a single rules-based index can theoretically replicate the payoff structure of an autocallable—also referred to as an autocall—by combining multiple forms of optionality into a rules-based methodology incorporating features such as hypothetical contingent income, observation dates, barriers and potential early redemption. Recall that an index is not an investment product; one cannot invest directly in an index but rather an investment product based on an index.
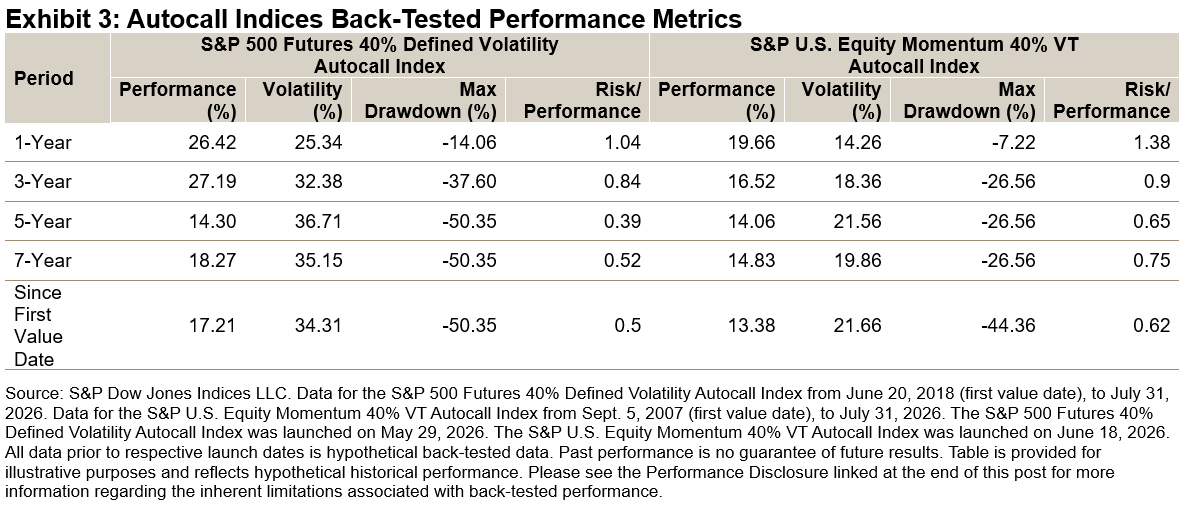
S&P Dow Jones Indices recently launched two autocall indices: the S&P 500 Futures 40% Defined Volatility Autocall Index and the S&P U.S. Equity Momentum 40% VT Autocall Index. Each index takes a different approach to replicating an autocall payoff structure reflecting potential income generation. For more information, please see the S&P 500 Futures 40% Defined Volatility Autocall Index Methodology and the S&P U.S. Equity Momentum 40% VT 4% Decrement Autocall Index Methodology.
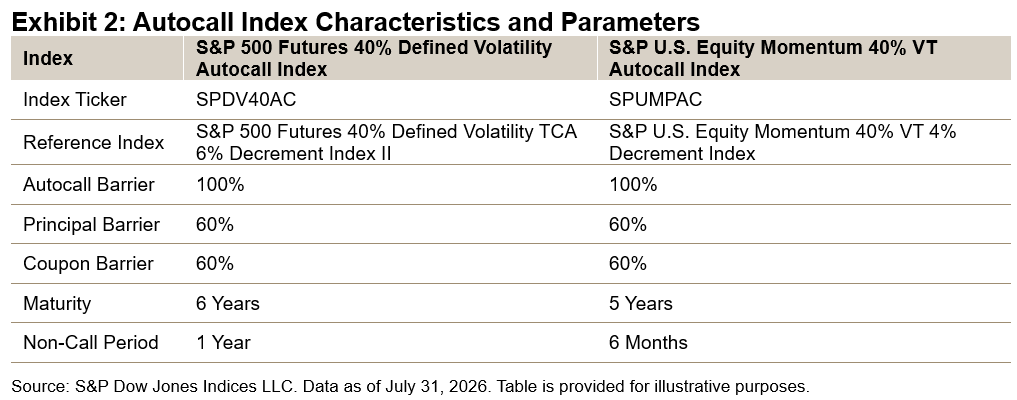
To better understand these indices, it’s necessary to understand how autocalls work. Autocall notes link coupon payments to the performance of a reference asset—in this case an underlying index. If the reference index remains above a predetermined level, the autocall pays a coupon. If the reference index experiences a certain decline, coupon payments may cease or principal may be at risk. In this way, autocall structures reflect tradeoffs; market participants may enjoy income derived from equity markets in exchange for some downside risk.
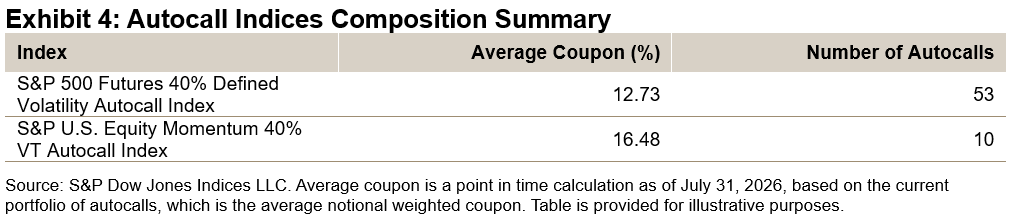
The S&P 500 Futures 40% Defined Volatility Autocall Index features a “dual yield” structure, with the potential for simulated income generation both from coupons and 50% of the upside participation of the reference index’s performance. This additional upside participation aims to mitigate the opportunity cost that an autocall structure may face during equity market rallies.
The S&P U.S. Equity Momentum 40% VT Autocall Index features a memory coupon that lasts for 12 months. For an eligible coupon as of a point in time, the memory coupon will also reflect any missed coupons from the past 12 months. The index also features a “pruning” mechanism that serves to systematically replace underperforming autocalls.
Both autocall indices employ a laddered structure whereby new autocalls are initiated on a staggered basis to help mitigate the impact of entry point risk and tail risk.
As investor demand for defined outcome strategies continues to evolve, indices may play an increasingly important role as a tool in making sophisticated payoff structures accessible via linked investment products to a broader set of market participants.
The posts on this blog are opinions, not advice. Please read our Disclaimers.Broadening the Base

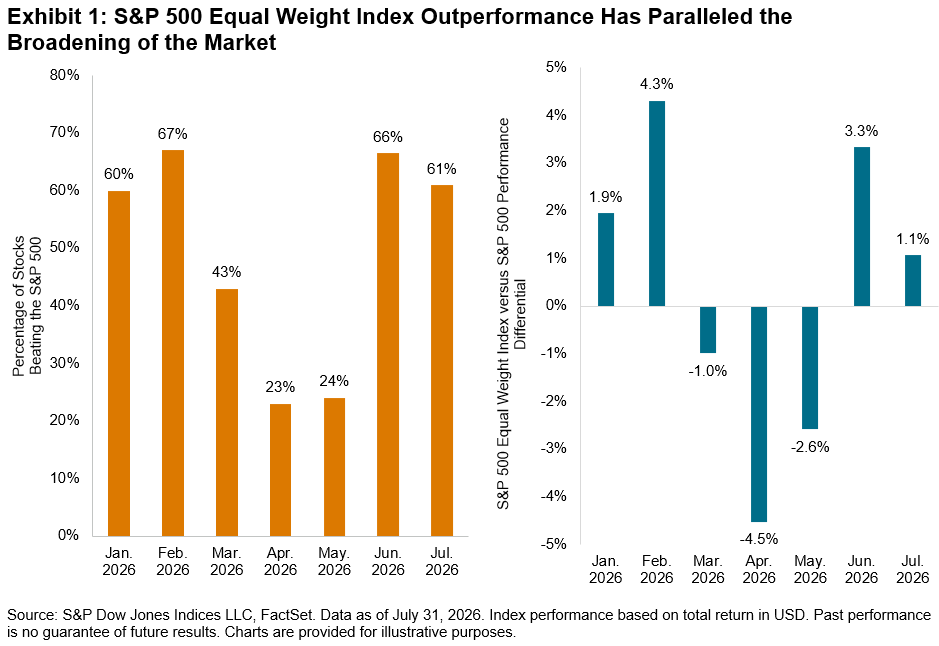
Despite recent declines upon renewed geopolitical concerns, the S&P 500® hit two all-time closing highs last week thanks to reduced expectations for a Fed rate hike after a soft jobs report and robust corporate earnings. One of the tailwinds of the market’s rally has been the broadening of performance beyond the mega cap hyperscalers,1 a much-needed panacea for those concerned about the dominance of the AI trade by a handful of companies. Exhibit 1 shows that more than 60% of stocks beat the S&P 500 in June and July.
We’ve previously discussed the movement of the rewards of investment in AI infrastructure toward the rapidly growing semiconductors industry.2 But the huge capital expenditure investments on AI appear to be benefiting the market at large. Aside from its slight underperformance month-to-date,3 the S&P 500 Equal Weight Index, which measures the performance of the average stock, outperformed the S&P 500 in June and July.
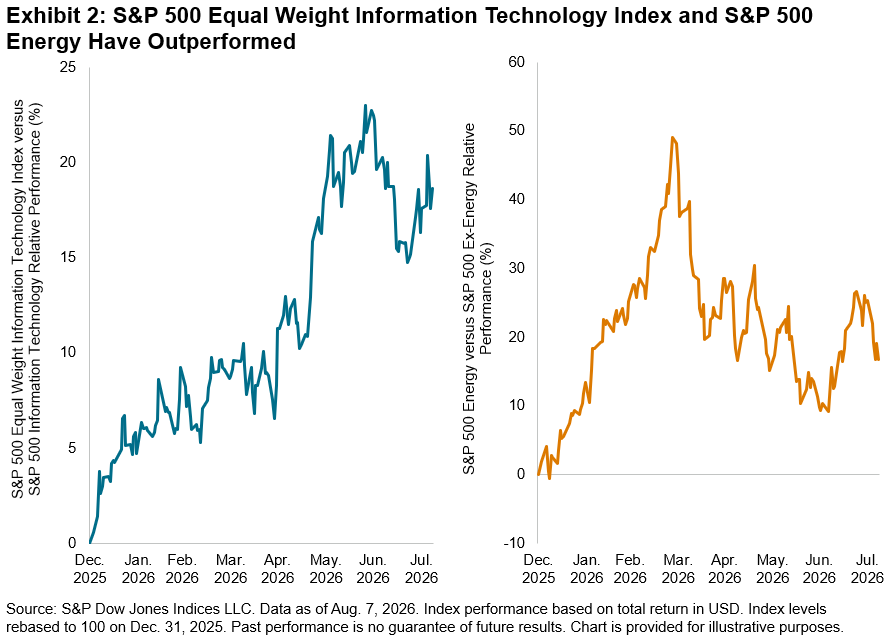
Stock- and sector-level dynamics can help explain the path to the S&P 500 Equal Weight Index’s outperformance. Market participation has expanded toward smaller companies in Information Technology, as illustrated in Exhibit 2, with the S&P 500 Equal Weight Information Technology Index outperforming its cap-weighted counterpart by 19% YTD.4 Another contributor has been the index’s overweight to the outperforming Energy sector, a key catalyst of which has been rising crude oil prices stemming from the ongoing conflict in the Middle East. The S&P 500 Energy outperformed the S&P 500 Ex-Energy by 17% YTD.
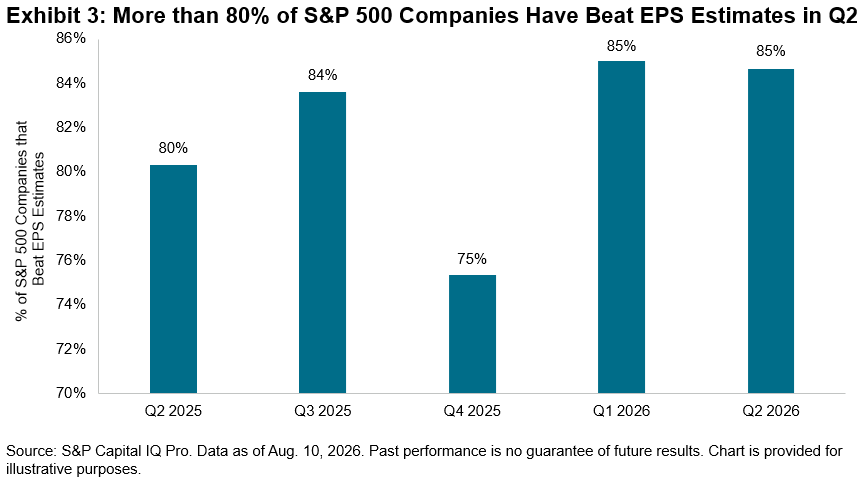
But the blockbuster earnings season in Q25 is evidence that the winners fueling the rise in market breadth are no longer housed solely in the Information Technology or Energy sectors. Of the S&P 500 companies that have reported so far, we observe in Exhibit 3 that roughly 85% have beat analysts’ estimates, consistent with Q1 and higher than the three quarters prior to that. Winners include companies situated in Health Care, Industrials and Real Estate.
A natural outcome of rising market breadth has been the rise in dispersion, which measures how differently stocks are performing relative to each other. S&P 500 dispersion has reached historically high levels, and Exhibit 4 shows that S&P 500 Equal Weight Index dispersion has tracked closely with its cap-weighted peer. This is not surprising given the increased scrutiny faced by companies across the size spectrum, which is typical during an earnings season.
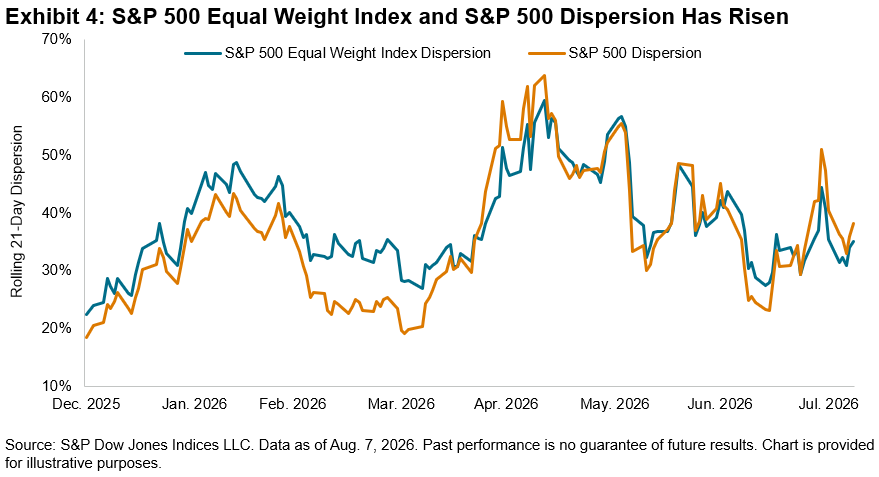
Given the broadening of the rally amid a backdrop of rising market dispersion and shifting performance among members of the AI value chain, understanding the stock and sectoral drivers behind the S&P 500 Equal Weight Index’s outperformance can be relevant as we approach the culmination of the Q2 earnings season.
1 Yue, Frances, “The number of stocks beating the S&P 500 is the highest in 4 years. Why that number should rise,” MarketWatch, Aug. 9, 2026.
2 See Ganti, Anu, “Regimes, Reversals and Risk,” S&P Dow Jones Indices LLC, July 9, 2026.
3 Data as of Aug. 7, 2026.
4 See S&P Equal Weight Sector Indices Dashboard, S&P Dow Jones Indices, July 2026.
5 Dinesh, Shradha, “Blockbuster Earnings Bolster Stocks’ Record Run,” The Wall Street Journal, Aug. 9, 2026.
This content may be AI-assisted and is composed, reviewed, edited, and approved by S&P Global.
The posts on this blog are opinions, not advice. Please read our Disclaimers.