The U.S. market has been buffeted by swings in the performance of semiconductor companies, as investors have become increasingly anxious about the outlook for the tech sector and whether a regime change is in store. The choppiness has been global in nature, sparked by a steep sell-off in Korean chipmakers, with the S&P Korea BMI down 10.9% for the month as of July 15, 2026. The parallel between the two countries is notable, and although both markets vary widely in size, outperformance in both has been driven by a handful of semiconductor companies.1, 2, 3 The connections between the two markets strengthened upon the debut of chipmaker SK Hynix’s ADR listing, which shed more than 10% on its second trading day before rising more than 25% the following day.4
Exhibit 1 demonstrates how the weight of the three top-performing companies within each index have grown. The S&P Korea BMI’s performance, up 169% over the past year through June 30, 2026, was driven by chipmakers and hardware suppliers including PSK, SK Hynix and its holding company SK Square.5 The S&P 500® was up 22% over the same time frame, and its top three performers—Sandisk, Western Digital and Micron—were, perhaps not coincidentally, also chipmakers. Though smaller in absolute terms, the relative growth in index weight of the U.S. companies was significantly higher than their Korean counterparts.
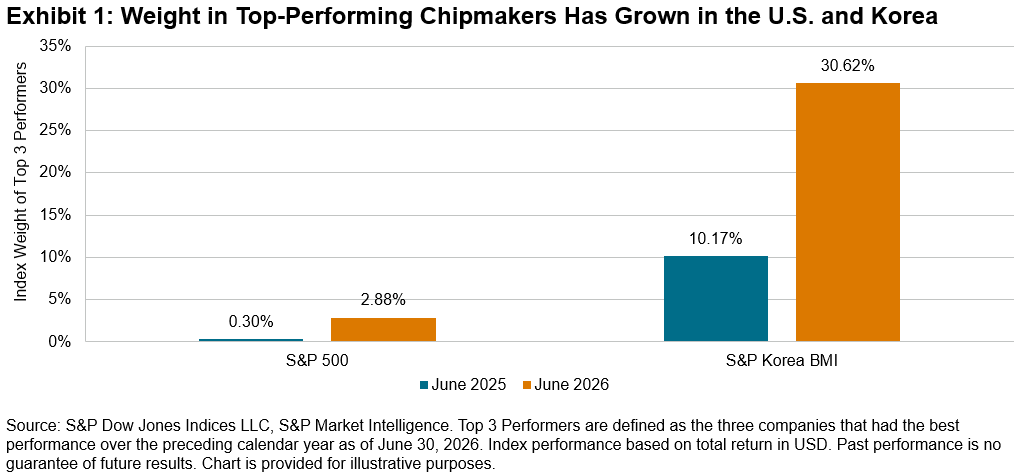
Offering a historical perspective and consistent with the rising weights of top-performing tech companies, Exhibit 2 shows that the weight of the Information Technology sector in the S&P 500 and S&P Korea BMI has grown considerably in recent years. As of June 30, 2026, Information Technology’s weight within the S&P Korea BMI was 69%, towering over the sector’s 38% weight in the S&P 500.
We can also examine the sources of U.S. and Korea index performance from an industry lens. As of Dec. 31, 2019, the Semiconductors & Semiconductor Equipment industry held 4% and 6% of the weight in the S&P 500 and S&P Korea BMI, respectively. By June 30, 2026, those weights had ballooned to 19% and 29%, respectively. Exhibit 3 demonstrates that the S&P Semiconductors Select Industry Index and the S&P Korea BMI Semiconductors & Semiconductor Equipment have significantly outperformed their respective sectors and country benchmarks.
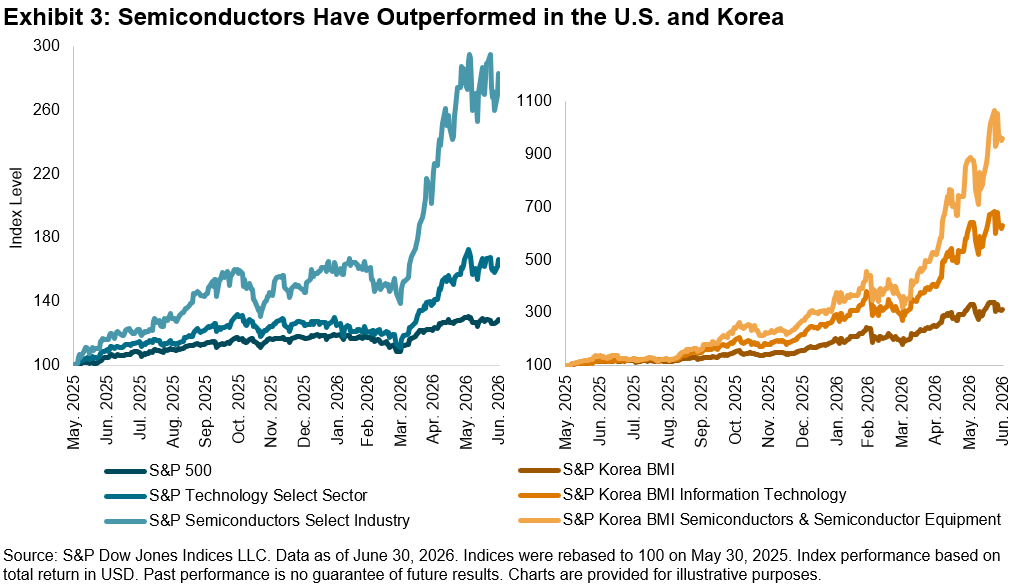
While the U.S. equity market is almost 20 times larger than that of South Korea in terms of market capitalization, the countries are similar in terms of the increasing weight of chipmaker companies in their respective indices. Understanding the similarities and differences between both markets may be helpful for navigating whether semiconductors will continue to play an increasing role in the AI value chain and global markets overall.
1 Ganti, Anu, “Cashing in the Chips?” S&P Dow Jones Indices LLC, June 2, 2026.
2 Agarwal, Purvi, “Micron overtakes Meta, Tesla in market value amid relentless AI infrastructure demand,” Reuters, June 25, 2026.
3 Shan, Lee Ying, “SK Hynix surges 12% after Micron earnings; blockbuster Nasdaq listing,” CNBC, June 25, 2026.
4 Tan, Huileng, “Why SK Hynix’s wild swings aren’t only an AI story,” Business Insider, July 15, 2026
5 Samsung affiliated businesses were not included due to lower aggregate performance.
This content may be AI-assisted and is composed, reviewed, edited, and approved by S&P Global.
The posts on this blog are opinions, not advice. Please read our Disclaimers.