Get Indexology® Blog updates via email.

In This List

Measuring the Managers

The Dow: 130 Years as the Original Index Icon

The Market Measure: In the Shadows of Giants

130 Years of The Dow: Why It Still Matters to Asia-Pacific

Latin Markets: Still Dancing to the Same Beat

Measuring the Managers

Contributor Image
Anu Ganti

Head of U.S. Index Investment Strategy

S&P Dow Jones Indices

The measurement of active manager performance versus benchmarks is not new. The earliest study dates back to more than 90 years ago, when Alfred Cowles found that “statistical tests of the best individual records failed to demonstrate that they exhibited skill, and indicated that they more probably were results of chance.”1

Forty years later, by the 1970s, financial markets increasingly became dominated by professional investors rather than the retail investors of Cowles’ day. In “The Loser’s Game,” Charles Ellis found that “contrary to their oft articulated goal of outperforming the market averages, investment managers are not beating the market: The market is beating them.”2

Less than 30 years later, the SPIVA® Scorecard launched in 2002, and it continues to serve as the de facto scorekeeper of the long-standing active versus passive debate. Beating the market is a tall order,3 with only three years of majority outperformance versus the S&P 500® over a 25-year history. For our largest and most closely watched category, 2025 was no exception, with 79% of all active large-cap U.S. equity funds underperforming the S&P 500.4
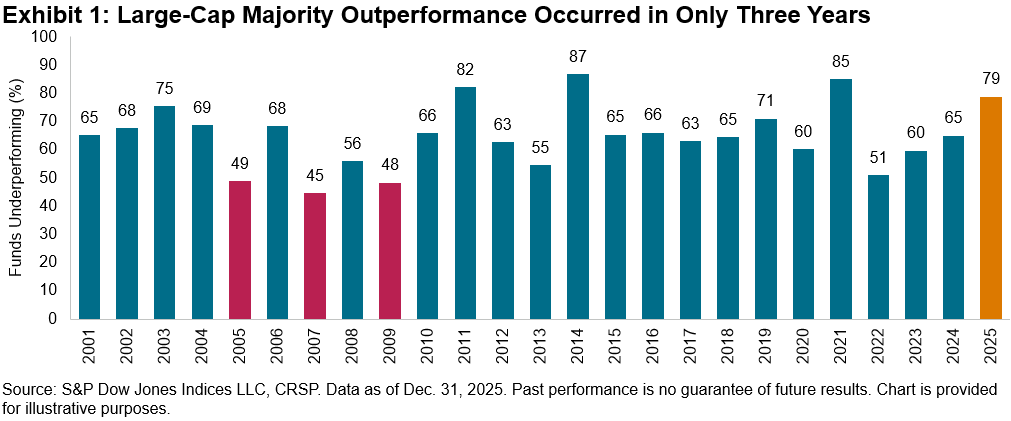
It is important to note that the underperformance rates shown in Exhibit 1 use the opportunity set available at the beginning of the period as the denominator to account for survivorship bias. We take a simple count of the funds that have survived and beat the index and then report the index outperformance percentage. Therefore, merged or liquidated funds are counted as underperformers.

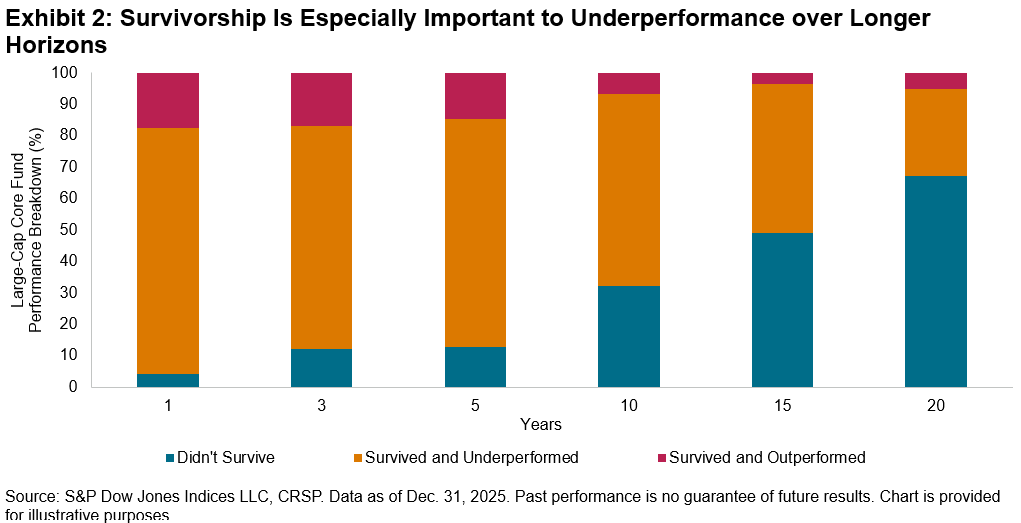
To better understand the impact of survivorship on underperformance, Exhibit 2 shows the breakdown of Large-Cap Core fund performance into three categories: funds that did not survive, funds that survived and underperformed and those that survived and outperformed. Over a one-year period, 82.5% of Large-Cap Care funds underperformed The 500®. Notably, most of this underperformance came from funds that survived but still underperformed, an indication of the challenges of benchmark outperformance regardless of the treatment of merged or liquidated funds.

Over a 20-year period, however, most of the category’s underperformance came from funds that did not survive, highlighting the importance that survivorship plays over longer time horizons. These trends are also indicative of the competitive nature of the business of active management, where winners tend to be rewarded with inflows by asset owners, but losers are generally punished with terminations and are less likely to survive over longer periods.5
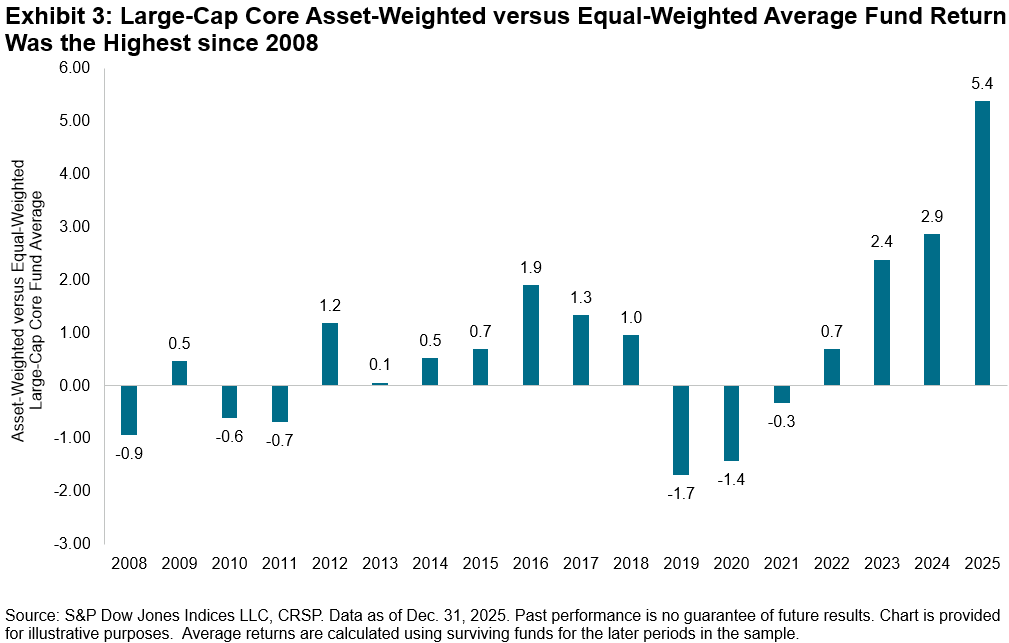
Another feature of our methodology of calculating fund underperformance is that funds of all sizes are treated equally. However, our scorecards show both equal- and asset-weighted average performance for comparison purposes. We observe in Exhibit 3 that the difference in 2025 of 5.4% between Large-Cap Core’s asset-weighted average return of 19.7% and the corresponding equal-weighted average return of 14.3% was the highest since 2008. The fact that larger funds have performed better in recent years, perhaps due to economies of scale or an information advantage, is typical, but unusually heightened compared to history.
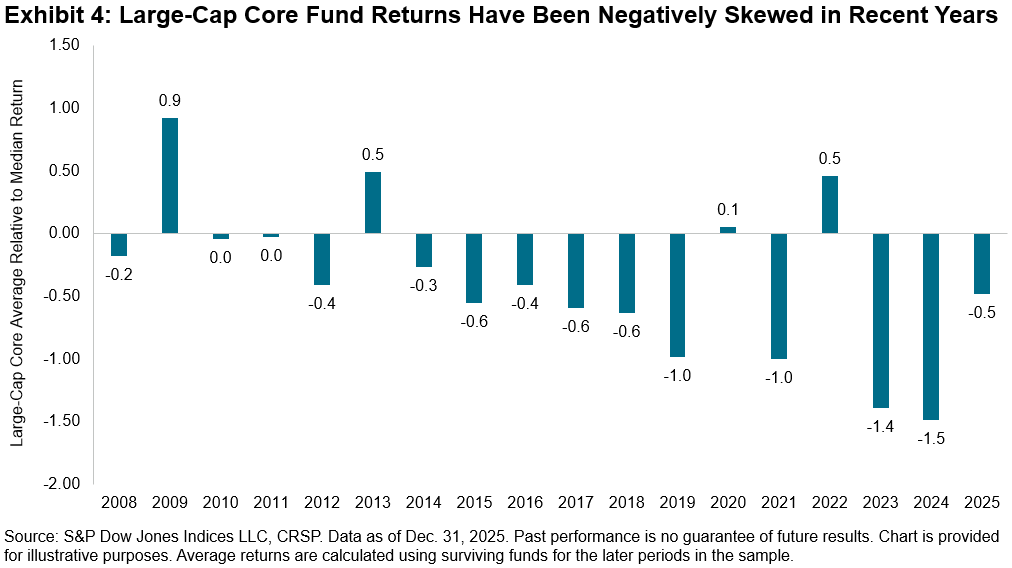
While larger funds have been among the winners in recent years, a negative skew has accompanied the cross section of fund returns. In other words, when a fund’s performance differed significantly from the median, it was more likely to be a significant underperformer. Exhibit 4 shows one measure of the historical skewness of fund excess returns for the Large-Cap Core category—specifically comparing the average return to the median return (reported as the second quartile breakpoint). While the skew was lower than in the prior two years, 2025 continued to witness an average return lower than the median.
Thanks to the rich data set backed by a robust methodology that SPIVA offers, including underperformance rates, survivorship statistics, equal and asset-weighted average returns, quartile breakpoints and more, readers across the globe can measure active manager performance versus the appropriate market benchmarks in a holistic manner. As the scorecard has evolved to expand to 11 regions with coverage across equities and fixed income, the message remains consistent regardless of geography or asset class: Most active managers underperform most of the time.  Alfred Cowles would not be surprised.

1 Cowles 3rd, Alfred, “Can Stock Market Forecasters Forecast?” Econometrica, July 1933.

2 Ellis, Charles D., “The Loser’s Game,” Financial Analysts Journal, July/August 1975.

3 For more detail on why active underperformance happens, see Ganti, Anu R., and Craig J. Lazzara, “Shooting the Messenger,” S&P Dow Jones Indices LLC, Nov. 22, 2022.

4 Ganti, Anu R. et al., “SPIVA U.S. Year-End 2025 Scorecard,” S&P Dow Jones Indices LLC, March 3, 2026.

5 Over consecutive five-year periods, in almost every single reported equity and fixed income category, the worst-performing quartile saw the highest proportion of funds that were subsequently merged or liquidated.  See Ganti, Anu R. et al., “U.S. Persistence Scorecard: Year-End 2025,” S&P Dow Jones Indices, May 7, 2026.

The posts on this blog are opinions, not advice. Please read our Disclaimers.

The Dow: 130 Years as the Original Index Icon

The Dow’s longevity has been earned through sustained attention to governance, methodology and relevance. Explore how this global index icon’s continued evolution helps it track a changing market. 

The posts on this blog are opinions, not advice. Please read our Disclaimers.
The Market Measure: In the Shadows of Giants

How has index concentration shifted historically and why might a diversified, cap-weighted benchmark like the S&P 500 already be tracking tomorrow’s market giants? S&P DJI’s Ben Vörös sits down with Tim Edwards to discuss Tim’s latest research, In the Shadows of Giants, and examine whether the dominance of a few large companies may be a signal of risk or opportunity for market participants. 

The posts on this blog are opinions, not advice. Please read our Disclaimers.
130 Years of The Dow: Why It Still Matters to Asia-Pacific

Contributor Image
Amit Pathak

Head of U.S. Equity Product Management Asia-Pacific

S&P Dow Jones Indices

How Wall Street’s Oldest Barometer Impacts Markets from Singapore to Seoul

When Charles Dow published his first industrial average on May 26, 1896, Asia’s great stock exchanges had barely been born. Tokyo’s bourse was just 15 years old; Hong Kong’s exchange had yet to open its doors. Today, many Asian markets take cues from the close of the Dow Jones Industrial Average® (DJIA) before trading begins the next morning. That overnight signal—whether positive or negative—often influences sentiment across Asia-Pacific markets at the open.

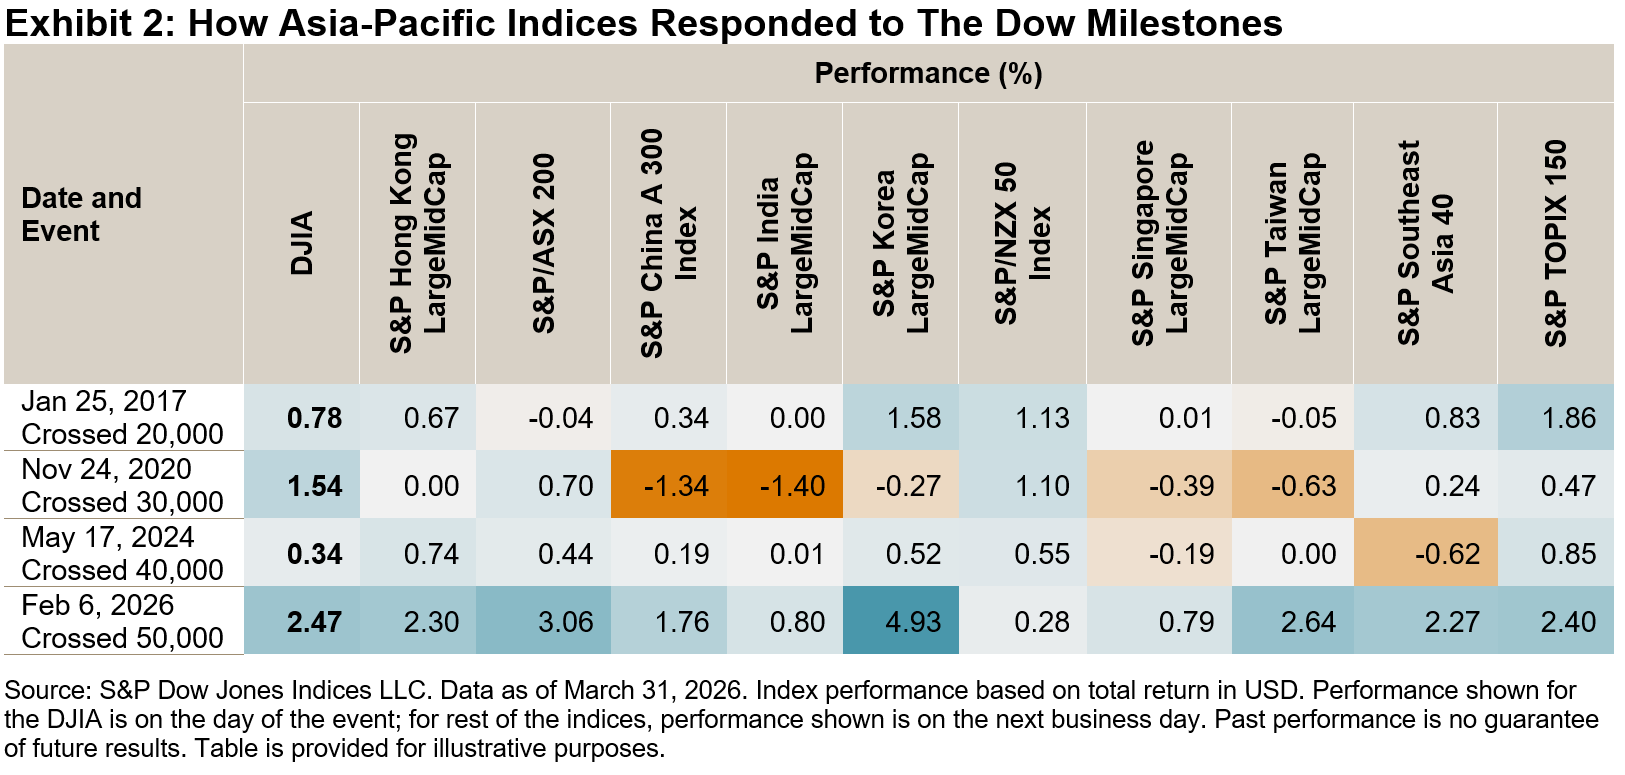
The Dow® crossed 50,000 for the first time on Feb. 6, 2026, a milestone that triggered a surge across Asia-Pacific indices the following session. The relationship between The Dow and the Asia-Pacific region has only deepened over 130 years as supply chains, capital flows and technology have woven the East and West into a single market fabric.

Why the DJIA Matters More than Ever for Asia-Pacific

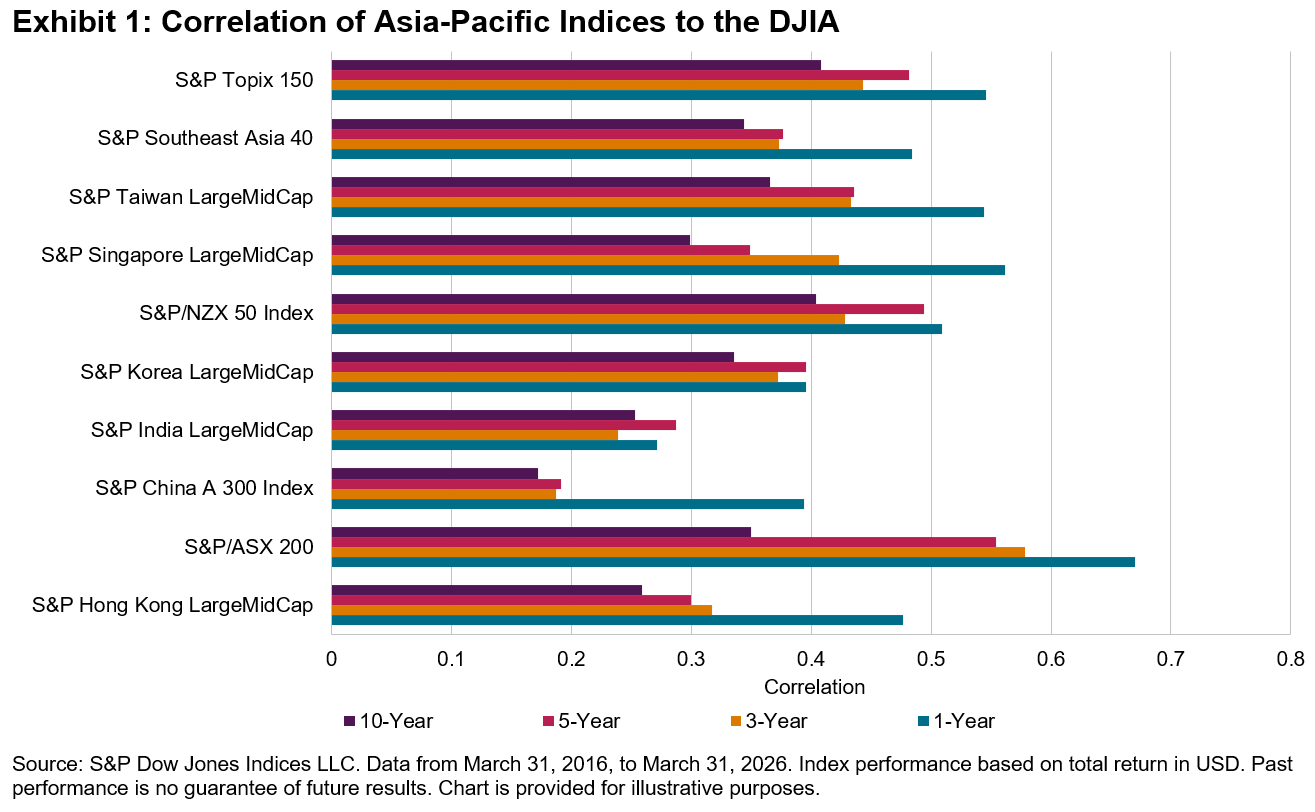
Asia-Pacific markets open hours before Wall Street closes, making the prior U.S. session a critical input. Markets like Hong Kong, Japan, South Korea, Singapore, Australia, New Zealand and India show statistically significant correlation with The Dow, particularly during periods of global stress such as the 2008 Financial Crisis and the 2020 COVID-19 pandemic shock. Sharp moves in U.S. equities often influence the next trading session in Asia-Pacific.

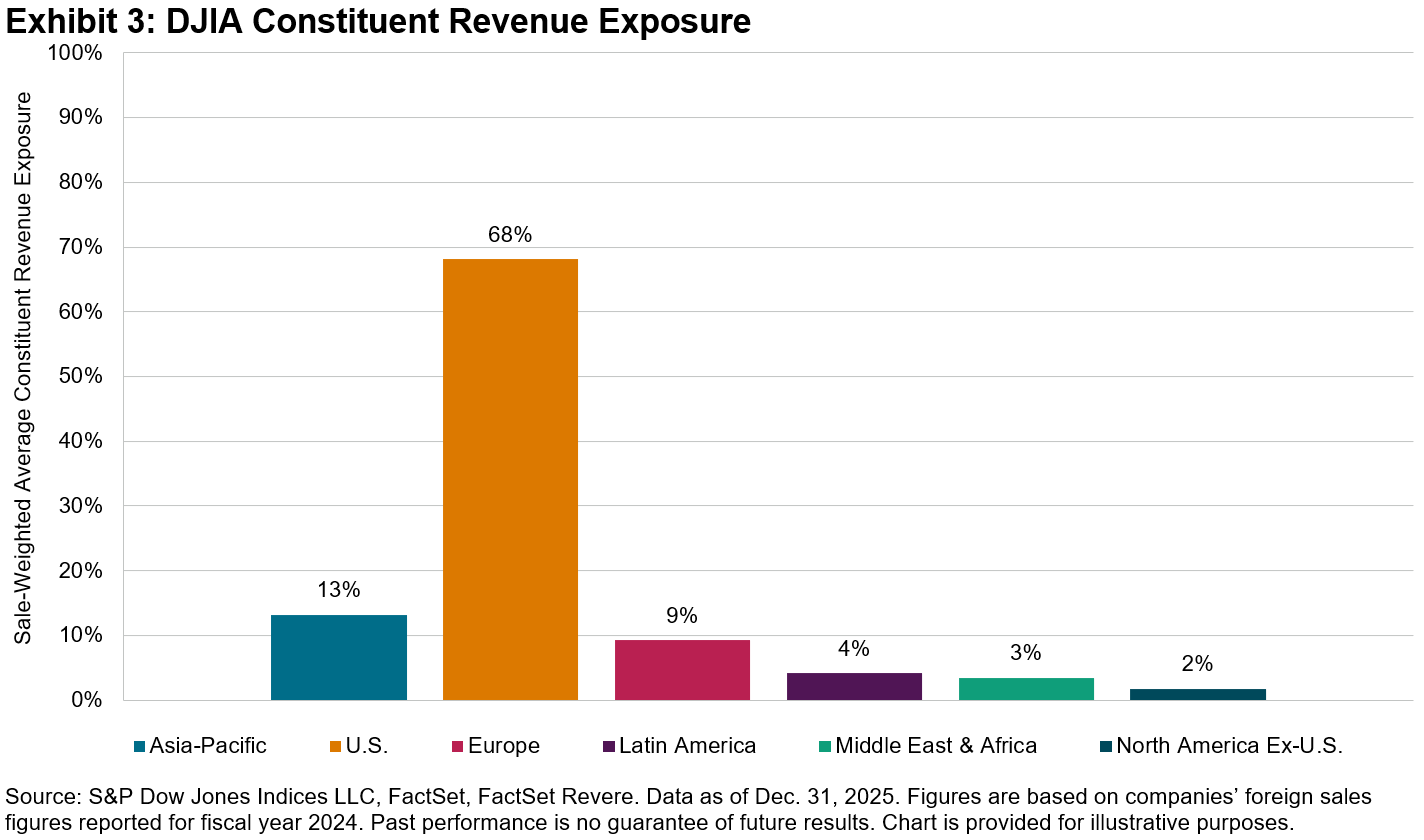
Additionally, the 30 DJIA components derive significant revenues from Asia-Pacific. In fact, outside of the U.S., Asia-Pacific is the region from which DJIA companies derive the largest revenue.

Perhaps the most tangible measure of the DJIA’s relevance to Asia-Pacific is the growing shelf of locally listed ETFs and funds that give retail and institutional investors in the region direct access to the index. Over the past two decades, global and regional asset managers have steadily expanded access to products that track The Dow for Asian market participants.1

What began with the first listed product in Singapore in 2002 has since evolved into a broader regional presence, with DJIA-related products now listed in markets including Taiwan, Japan and South Korea. This expansion not only offers market participants greater choice, but also reflects the enduring popularity and influence of The Dow across Asia-Pacific markets.

Conclusion

After 130 years, the Dow Jones Industrial Average remains a reference point for Asia-Pacific markets. Its daily movements serve as vital signals, influencing trading sentiment from Singapore to Seoul before the local exchanges even open. The Dow’s milestones—like crossing 50,000—have at times been reflected in regional market performance, underscoring the ties between Wall Street and the East. With DJIA companies generating a meaningful share of revenue from Asia-Pacific and the proliferation of The Dow-linked investment products in the region, the index’s relevance has only grown. As global markets become ever more interconnected, The Dow’s legacy endures—not just as a historic barometer, but as a living bridge between economies, helping to guide Asia-Pacific through both calm and crisis.

1 For a complete list of products linked to S&P DJI indices, please visit our Index-Linked Products page.

The posts on this blog are opinions, not advice. Please read our Disclaimers.
Latin Markets: Still Dancing to the Same Beat

Contributor Image
Sara Pineros

Quantitative Analyst, Index Investment Strategy

S&P Dow Jones Indices

Just as Latin American musicians dominated global charts in 2025, the region’s equities delivered quite the performance last year. While markets navigated shifting interest rates and economic transitions, Latin America stood out as a top-performing region worldwide. The S&P Latin America BMI hit a high note, surging by 53.8% for the year, outperforming the S&P Global BMI by 31.8% in U.S. dollar terms.

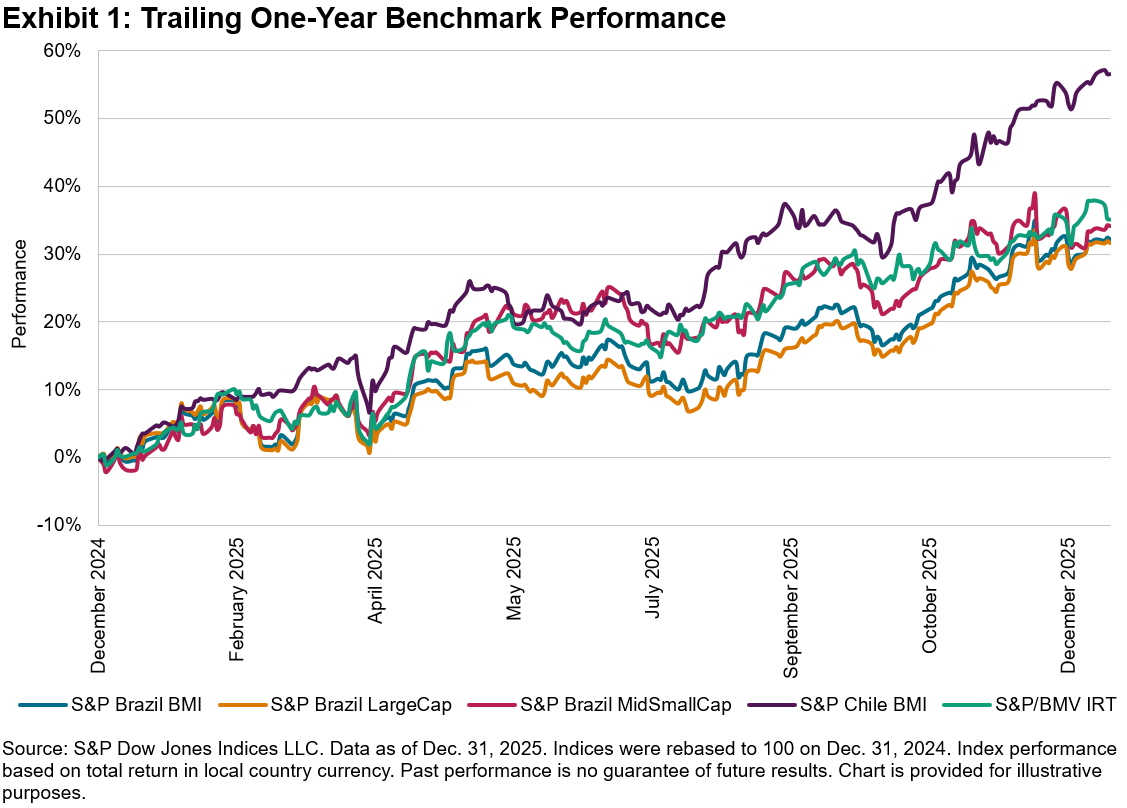
As Exhibit 1 illustrates, this growth was widespread. Chile was the clear standout, with the S&P Chile BMI rising 56.6%, followed by Mexico’s S&P/BMV IRT at 35.2%. Brazil also experienced a robust recovery from its 2024 slump, with the S&P Brazil BMI up 32.2%.

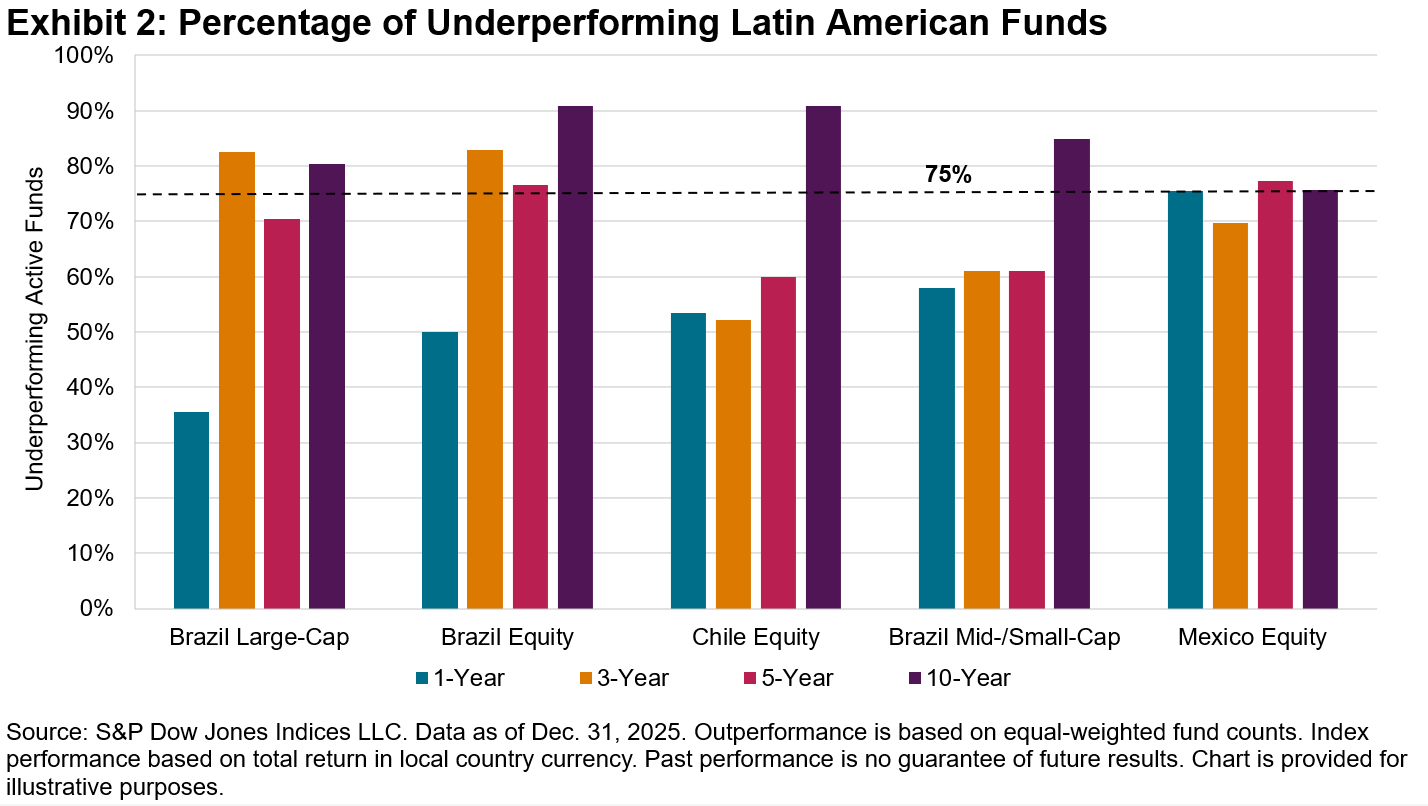
Did active funds sing in tune with the broad rally or end up off-key? The results, detailed in the SPIVA Latin America Year-End 2025 Scorecard, were mixed. While active large-cap equity funds in Brazil fared relatively well, the majority of active funds in all other regional categories failed to capture the full extent of the 2025 surge. As Exhibit 2 shows, over a 10-year horizon, high underperformance (over 75%) remained the undeniable norm across all categories.

To understand why active managers struggled in some countries but succeeded in others in the short term, we can start by looking at market skew and leadership concentration.

In 2025, Latin American markets experienced notable disparities in performance distributions. In Mexico, for example, the S&P/BMV IRT exhibited moderately positive skew. Only 10 stocks (27.0%) outperformed the benchmark, meaning active managers faced a high probability of selecting underperformers. Chile showed a similar, albeit slightly less skewed outcome, with the strongest performers heavily concentrated among the highest-weighted stocks.

Brazil offered a fascinating case study in active management dynamics. While the broader Brazilian equity market saw a relative absence of positive skewness, with over half of its components (51.6%) outperforming the S&P Brazil BMI, the S&P Brazil LargeCap told a different story.

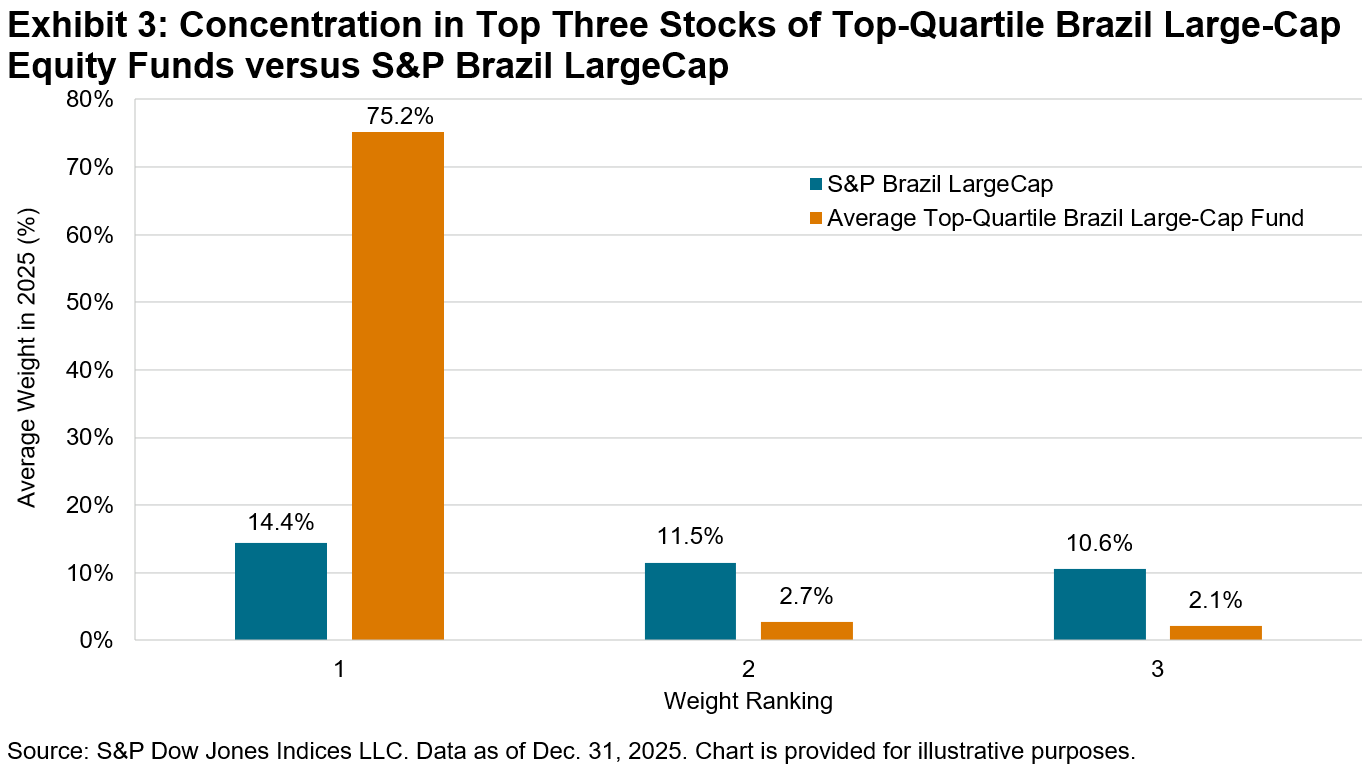
Typically, when a few mega-cap stocks drive a market’s index performance, active funds struggle to keep pace due to portfolio diversification tendencies that shift them away from significant concentration. In 2025, however, Brazil proved to be an exception. Active Brazil Large-Cap funds posted their best results since 2021, aided by highly concentrated positions. While the S&P Brazil LargeCap’s top three constituents accounted for 36.5% of its weight, the average total weight of the top three holdings among top-quartile Brazil Large-Cap equity funds was 80.0%, as shown in Exhibit 3. Perhaps even more remarkably, the average weight of the largest holding in top-quartile Brazil Large-Cap equity funds was 75.2%, illustrating a tilt toward massive single-stock concentration in the pursuit of outperformance.

While riding the momentum of a few large stocks provided a winning ticket for Brazilian large-cap managers in 2025, history serves as a cautionary tale. Relying heavily on a concentrated handful of stocks has carried significant risk when market leadership rotates.

The newly released Latin America Persistence Scorecard Year-End 2025 highlights this exact challenge, answering a critical question: Can these pockets of outperformance be attributed to genuine skill, or are they the result of fleeting luck?

If outperformance were driven by repeatable skill, we would expect it to persist. Instead, the data shows that active management success is overwhelmingly short-lived. Among the 405 funds across Brazil, Chile and Mexico that placed in the top quartile in 2021, a mere 1.2% managed to remain in the top tier over the following four years.

Looking closely at the equity markets, the drop-off was stark. For broad Brazil Equity funds, only 1 out of 81 top-quartile funds from 2021 (1.2%) maintained its status through 2025. In Chile and Mexico, the persistence rate completely vanished; not a single top-quartile equity fund from 2021 maintained its ranking over the subsequent four years.

Furthermore, the data highlighted the possible severe long-term consequences of getting caught on the wrong side of market concentration. Over two consecutive five-year periods, for example, 57.1% of top-quartile Chile Equity funds did not just lose their top-tier status; they fell to the bottom quartile or were liquidated entirely.

Ultimately, 2025 was a record-breaking year for Latin American equities in an absolute sense. Yet, from a relative perspective, the underlying mechanics of skew and concentration proved difficult for most active managers to navigate. The past year may have offered brief pockets of active success in markets like Brazil, but the long-standing results from the SPIVA and Persistence Scorecards continue to remind us that the song remains the same; over the long term, luck has proven fleeting, and consistent outperformance has remained rare.

The posts on this blog are opinions, not advice. Please read our Disclaimers.