2025 was full of memorable moments, from tariff tensions and continued AI advancement, to pop stars in space and billionaire weddings. For U.K. active equity funds, however, 2025 may well be a year to forget. Across the three relevant categories measured in the SPIVA Europe Year-End 2025 Scorecard (U.K. Equity, U.K. Large-/Mid-Cap Equity and U.K. Small-Cap Equity), 90% of funds failed to beat their category benchmark. Markets, perhaps more than usual, offered opportunities to positively deviate from market-cap-weighted indices, but return distributions made this a feat easier said than done.
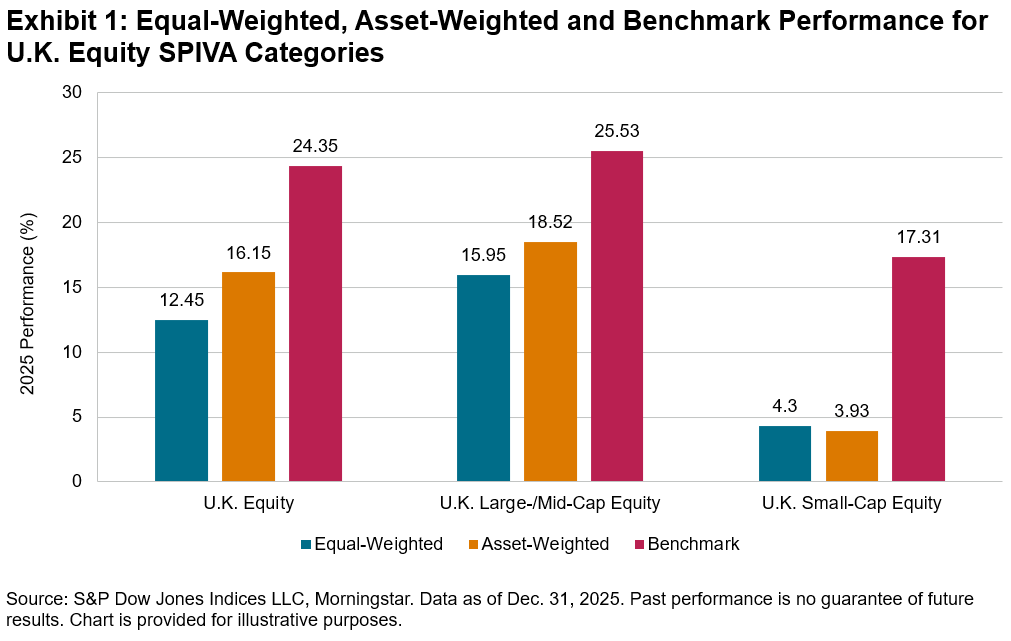
In an absolute sense, 2025 was a fine year for U.K. equity active funds. Exhibit 1 shows that all three capitalization categories measured in the SPIVA Europe Year-End 2025 Scorecard produced positive returns in aggregate. This becomes far less impressive, however, when analyzing benchmark-relative performance. On both an equal- and asset-weighted basis, the active categories significantly lagged their benchmarks. The gap was especially wide for small-cap funds, which produced less than a quarter of the return of their benchmark, the S&P United Kingdom SmallCap.
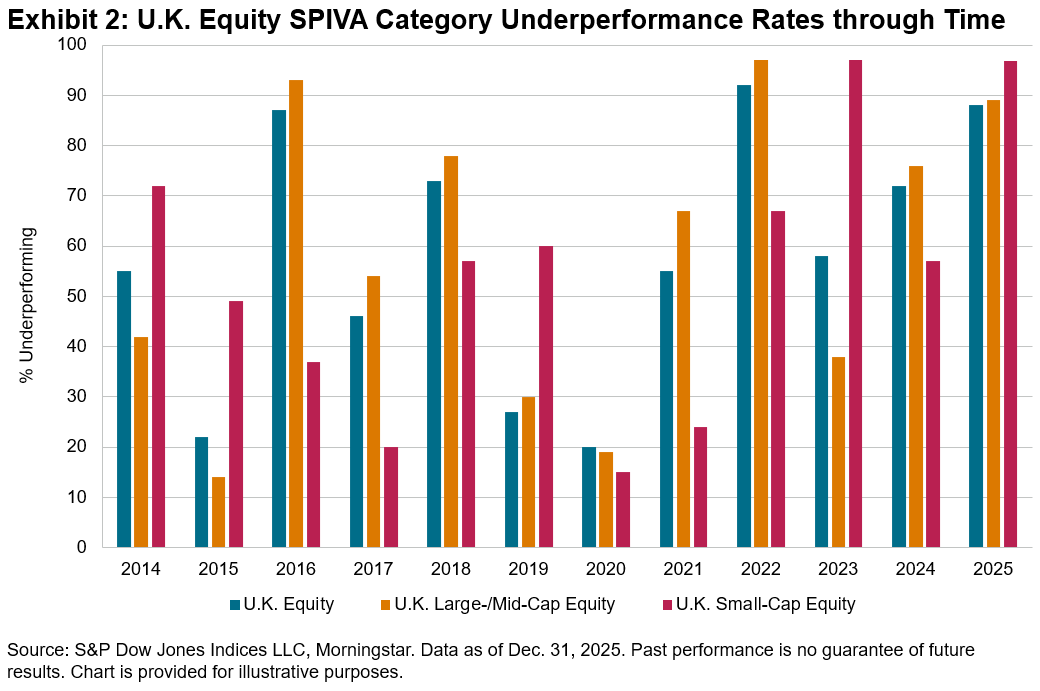
The extent of this underperformance was historic. In 2025, 88% of broad U.K. Equity, 89% of U.K. Large-/Mid-Cap Equity and 97% of U.K. Small-Cap Equity funds failed to beat their benchmarks. As shown in Exhibit 2, it was a particularly bad year for the cohort, marking the second-worst, third-worst and second-worst years, respectively, across the three categories in the 14-year dataset.
As ever when debating the performance of active funds versus indices, there are likely to be two camps on this issue. Some may argue that 2025 was an exceptionally challenging year to navigate, full of macro headwinds, geopolitical turmoil and technologically driven paradigm shifts. From this perspective, active fund underperformance was driven by bad luck. Others may suggest that these are precisely the conditions where skilled active management should excel, and the fact that it generally did not is evidence of its rarity. Exhibits 3 and 4 may provide ammunition to both sides.
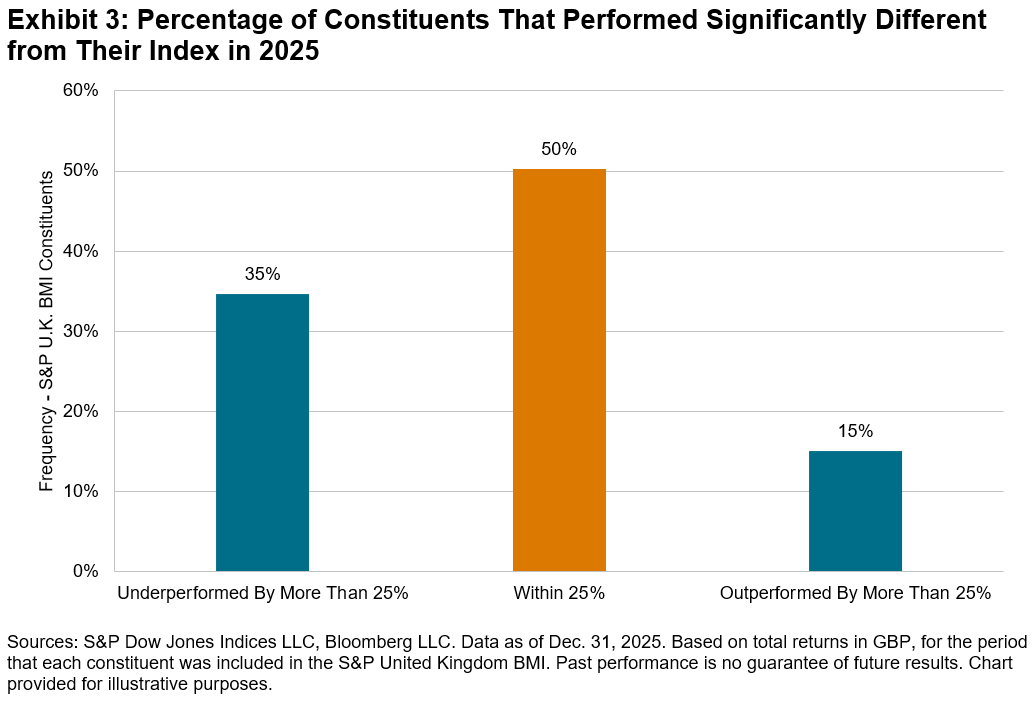
Exhibit 3 shows both the opportunity and perils of active management. In 2025, the performance of half of S&P U.K. BMI stocks differed from the index by more than 25%. There was, therefore, ample opportunity to generate outperformance by underweighting underperformers and overweighting outperformers. However, with significant underperformers more than doubling the number of outperformers, any deviation was likely to be negative.
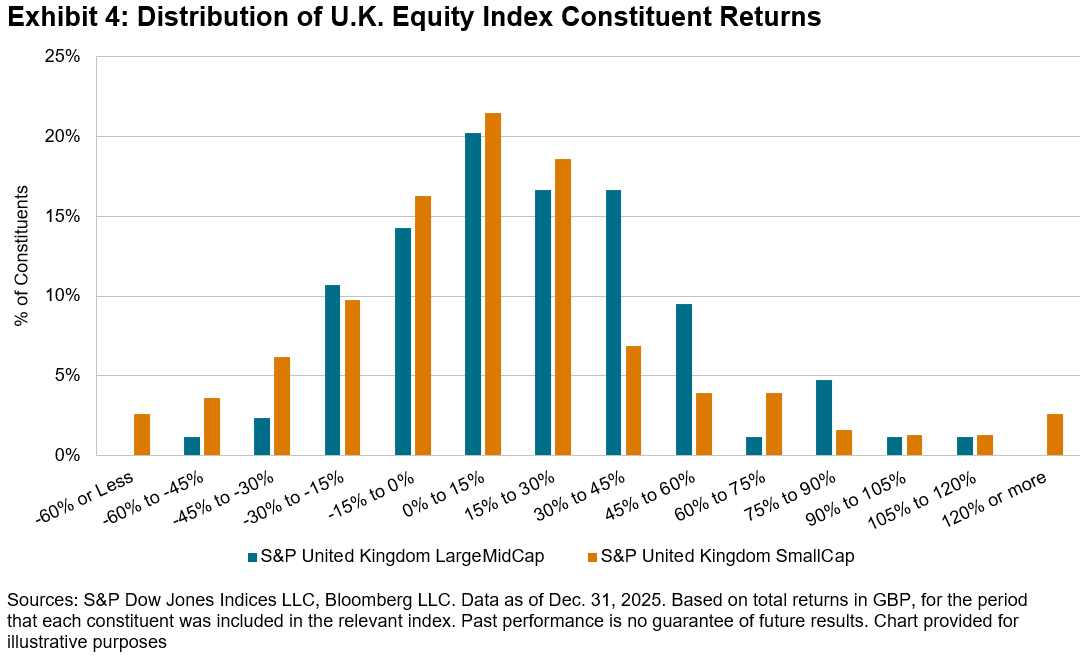
Exhibit 4 further supports this, showing the distribution of U.K. Equity index constituent performances within the S&P United Kingdom LargeMidCap and S&P United Kingdom SmallCap. The distribution of performance in both indices was positively skewed, meaning that a small number of stocks were responsible for much of the increase. Consequently, for active funds, failure to own the few key outperformers at or above their index weight could have led to underperformance.
2025 proved to be a particularly difficult year for U.K. equity active funds. Concentrated stock returns made it difficult to match index performance. Such a return distribution is not unique to the U.K. in 2025, nor is the tendency for the majority of active funds to struggle to outperform their indices. The past may not be precedent, but the long-standing results from the SPIVA Scorecards continue to document similar patterns of underperformance year after year in markets across the globe.
The posts on this blog are opinions, not advice. Please read our Disclaimers.