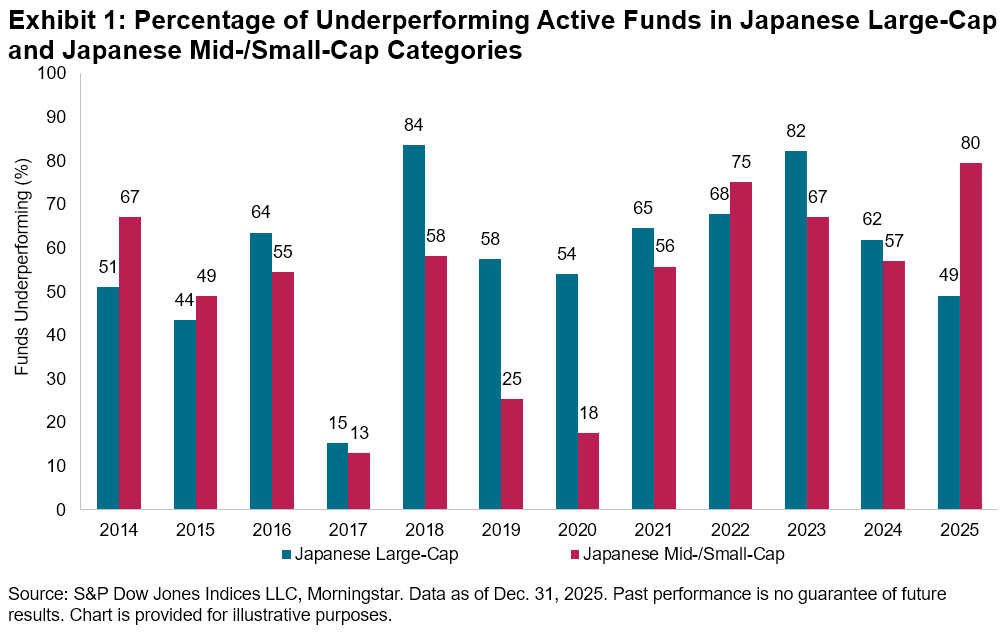
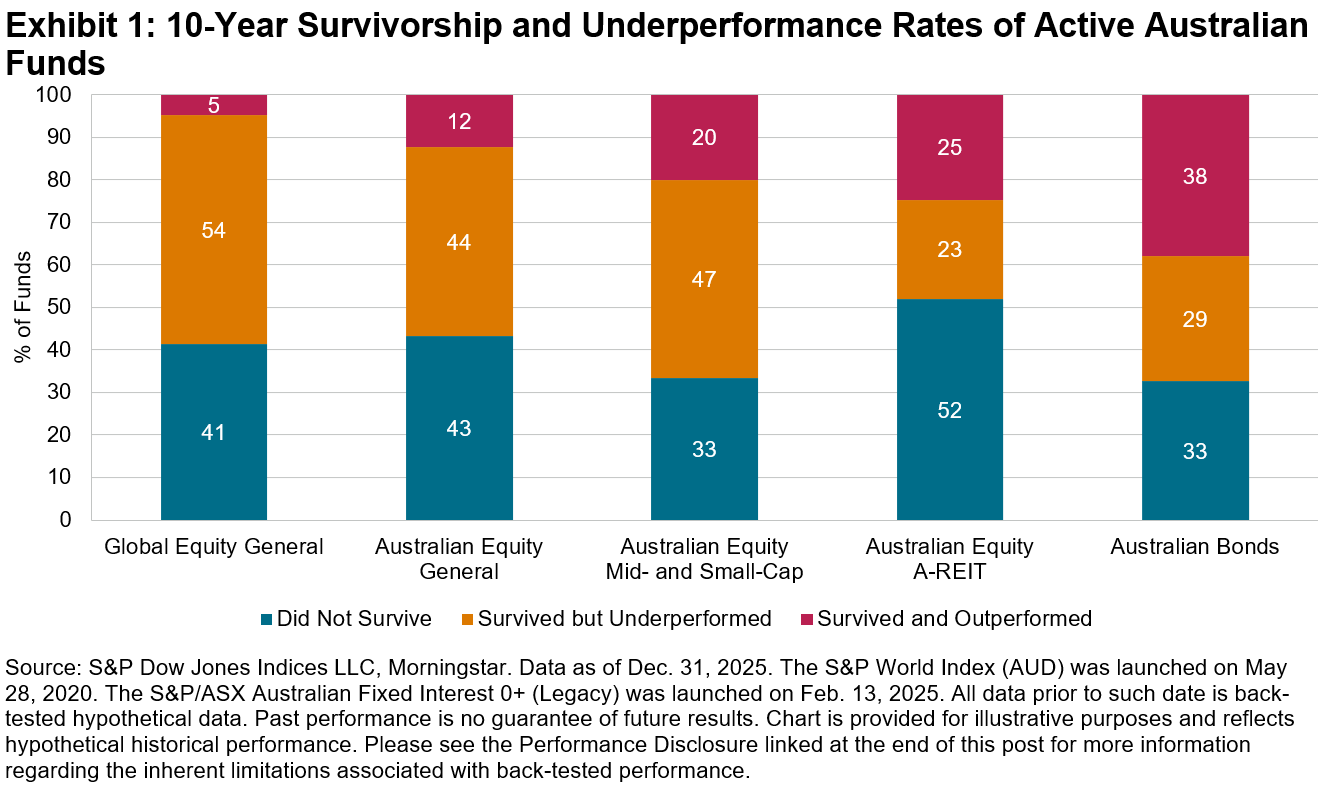
Our latest SPIVA® Australia Scorecard underscored the challenges that Australian active funds faced in converting a favorable stock-picking environment into meaningful results in 2025. Among the 831 active equity funds domiciled in Australia that we examined—spanning global equity, domestic equity and REITs—over two-thirds (570 funds) underperformed their category benchmarks. In contrast, active Australian bond funds extended their strong performance, with a majority outperforming for the third consecutive year. While the performance of active funds may fluctuate in the short term, longer-term results have remained disappointing across all categories, with many funds either underperforming or failing to survive (see Exhibit 1).
In practice, investors and advisors construct portfolios by selecting and allocating across multiple funds, and strong performance from just one active fund could more than compensate for lagging performance by others. Our latest research1 examines how portfolios of active funds stacked up against similarly weighted blends of indices. An analysis of hypothetical multi-asset portfolios of active funds domiciled in the U.S. revealed similar challenges: 96.9% of 60/40 equity/bond portfolios of U.S. active funds would have underperformed the equivalent index blend over 10 years.
How would Australian investors have fared if they selected active Australian funds to build a multi-asset portfolio? To answer this question, we simulate portfolio construction by randomly selecting funds from the four major fund categories2 included in the SPIVA Australia Scorecard (see Exhibit 2). We then assign fixed weights to the four chosen active funds—specifically 30% in the Global Equity General fund, 24% in the Australian Equity General fund, 6% in the Australian Equity Mid- and Small-Cap fund, and 40% in the Australian Bonds fund—to build a hypothetical 60/40 equity/bond portfolio. These weightings were heuristically chosen to reflect the typical home bias among Australian investors, with equal weightings in global equity and domestic equity, while the allocation between domestic general equity and mid- and small-cap equity (at a 4:1 ratio) is based on their benchmark market capitalizations. The same weights are applied to the hypothetical blend of comparison indices, and both the active portfolio and index blend are rebalanced every 12 months.3
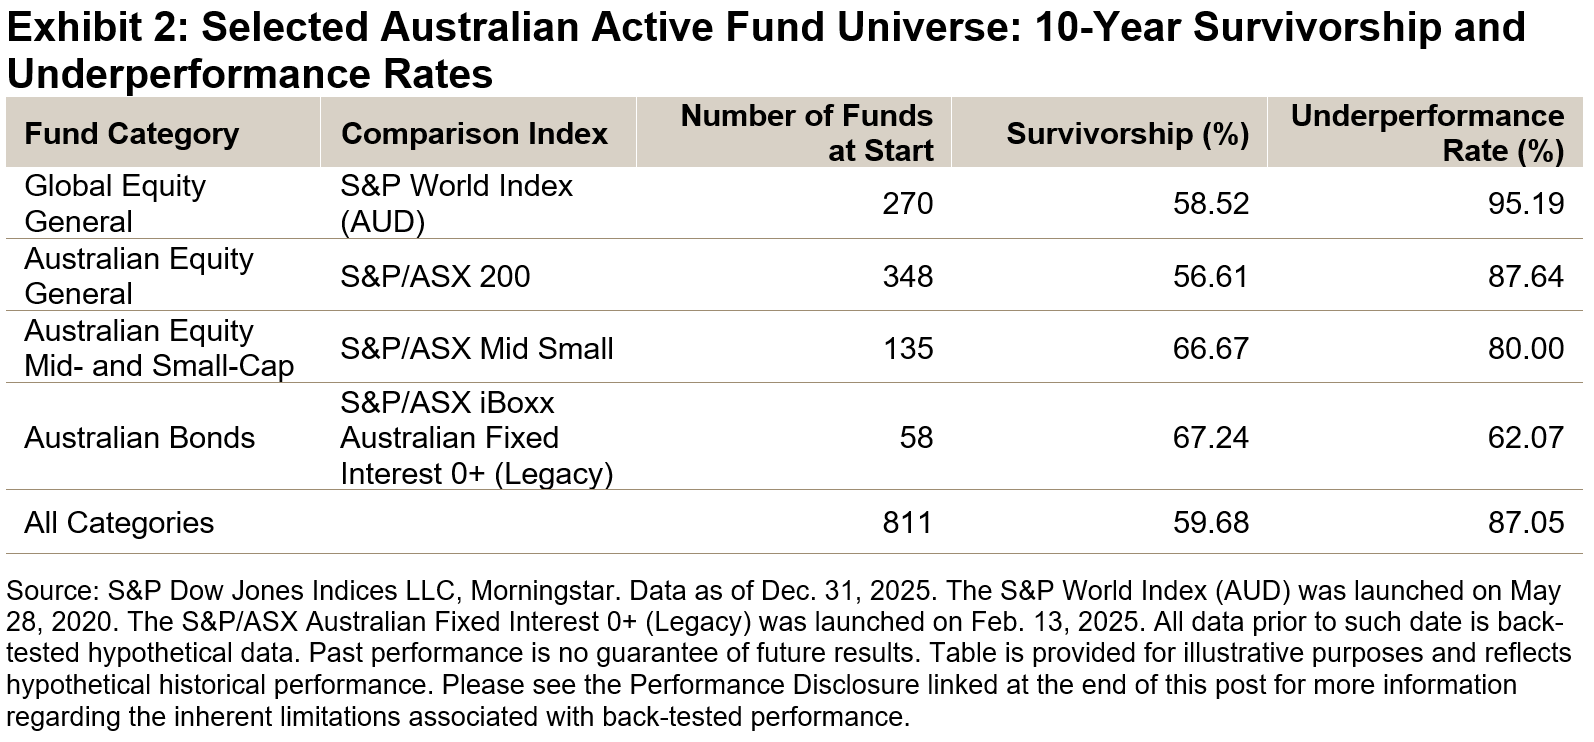
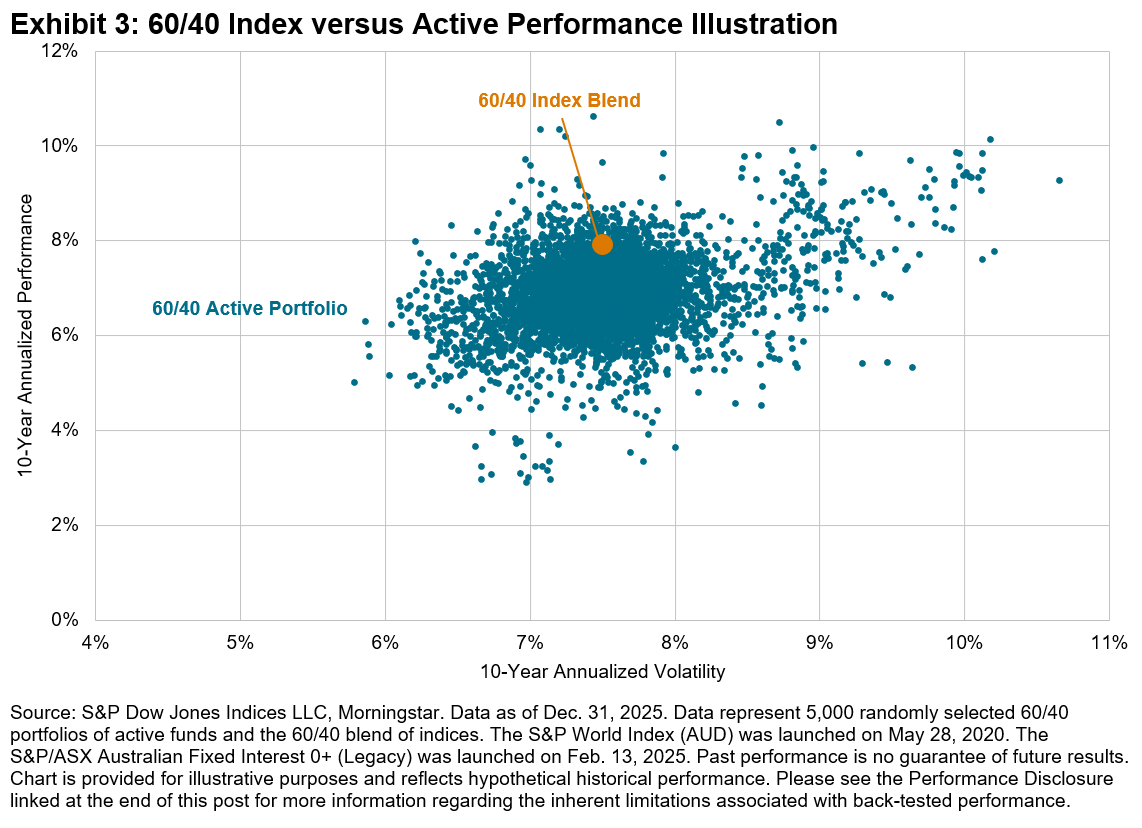
In cases where the selected active fund ceased to exist within the span of 10 years—which happened quite often as evidenced by the survivorship rates in Exhibit 2—the benchmark performance was assigned to that fund category from that month forward to the end of the 10-year period.4 We performed 5,000 simulations and their 10-year performance and volatility are shown in Exhibit 3, in comparison to the equivalent index blend.
The key observations from this analysis:
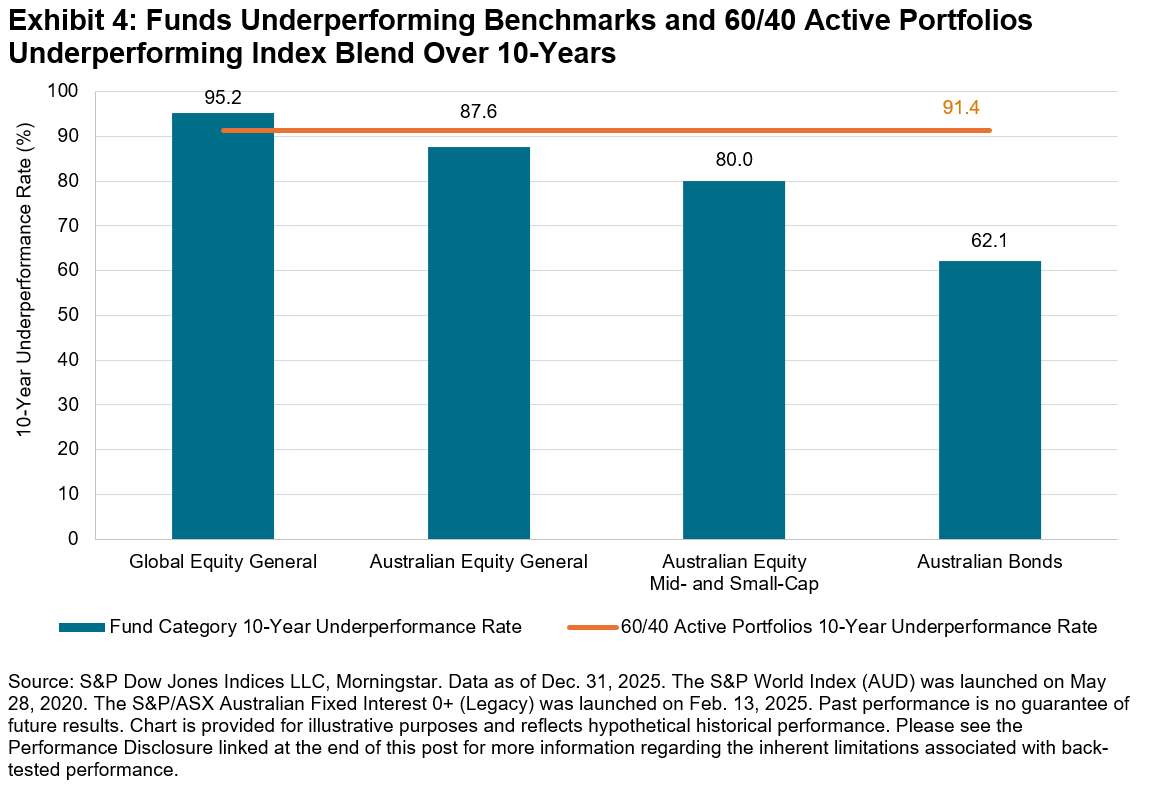
- Over the 10-year period, 91.4% of 60/40 portfolios of Australian active funds would have underperformed the equivalent index blend on an absolute return basis. This underperformance rate is lower than that of the Global Equity General category but higher than that of the other three fund categories (see Exhibit 4).
- The average performance (annualized) of active portfolios was 6.94%, well below 7.91% for the index blend.
- The average volatility of active portfolios was 7.51%, similar to 7.50% for the index blend.
- On a risk-adjusted return basis, 98.0% of 60/40 active portfolios would have underperformed the equivalent index blend.
- 8% of active portfolios contained at least one fund that merged or liquidated within the 10-year span.
S&P DJI’s SPIVA Scorecards have provided the Australian community with a data-driven perspective on the prospects for selecting active funds that outperform benchmark performance. This new analysis highlights equally significant challenges for Australian portfolio building. When a majority of active funds underperformed their benchmarks across different asset classes and segments, portfolios comprising these funds also tended to underperform blends of indices, with an even higher probability.
1 Edwards, Tim and Nelesen, Joseph. “Heroes in Haystacks: Index Comparisons for Active Portfolio Performance” S&P Dow Jones Indices. December 2025.
2 Note that the Australian Equity A-REIT category is excluded due to the relatively smaller size of this segment. As of Dec. 31, 2025, index market capitalization was AUD 120,910 billion for the S&P World Index, AUD 2,648 billion for the S&P/ASX 200, AUD 665 billion for the S&P/ASX Mid Small, AUD 1,711 billion for the S&P/ASX iBoxx Australian Fixed Interest 0+ (Legacy) and AUD 173 billion for the S&P/ASX 200 A-REIT.
3 S&P Dow Jones Indices is not a registered investment advisor and does not provide investment or other advice. In this analysis, fund category selection, fund combinations and weightings, are intended to represent broad allocations—not as a suggestion or endorsement of any fund recommendation. Instead, we employ a heuristic approach to approximate the fund allocation process and to estimate the hypothetical performance of a portfolio of Australian active funds compared to similarly weighted blends of indices over the long term.
4 Replacing a liquidated fund with the benchmark performance in the months subsequent to its demise has a positive impact on average active portfolio performance, relative to leaving the subsequent months empty with no return during the examined period.
The posts on this blog are opinions, not advice. Please read our Disclaimers.