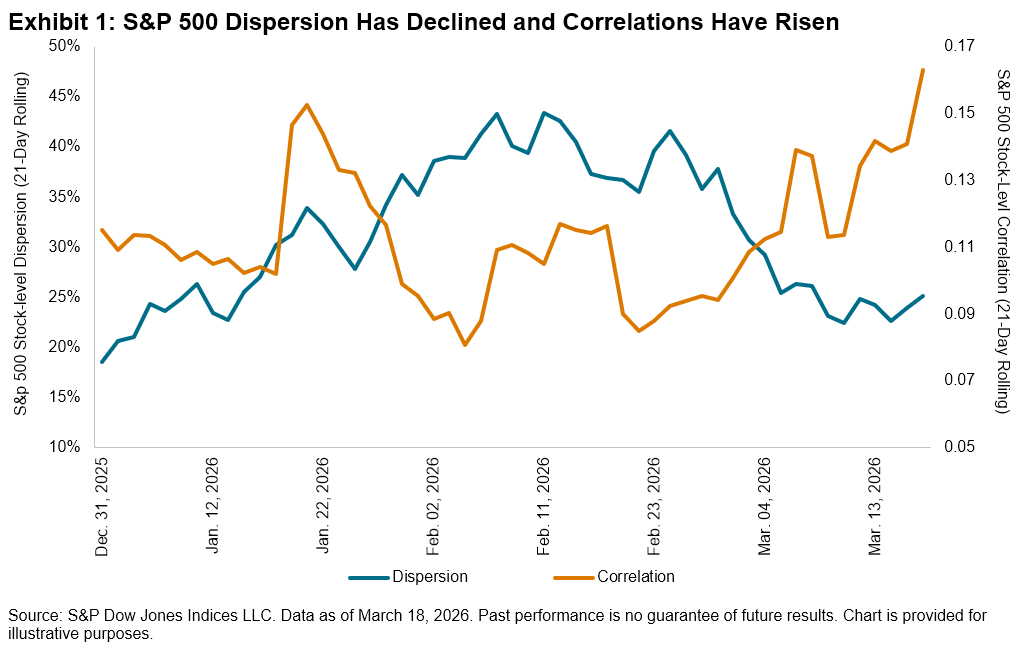
As we approach the end of the first quarter, the S&P 500® is down 3% QTD, and underneath the surface, there have been significant crosscurrents at play. Concerns about the impact of AI on software companies have been prevalent, with the S&P Software & Services Select Industry Index down 20% QTD, while chipmakers have remained relatively resilient, with the S&P Semiconductors Select Industry Index up 2%. As investors have grappled with the winners and losers of these technology changes, S&P 500 stock-level dispersion, which is a measure of cross-sectional volatility, rose through the first two months of the year,1 peaking at 38% on Feb. 27, 2026.
However, the tide has turned since the beginning of March. Investors globally have shifted their focus toward the war with Iran, and the impact of rising oil prices and corresponding inflation concerns across sectors have permeated the market. In other words, it seems that idiosyncratic risks have taken a back seat to macro risks. This shift has been reflected across the market’s volatility landscape, with S&P 500 stock-level dispersion declining to 25% as of March 18, 2025. Meanwhile, stock-level correlations, while still low by historical standards, have risen accordingly.
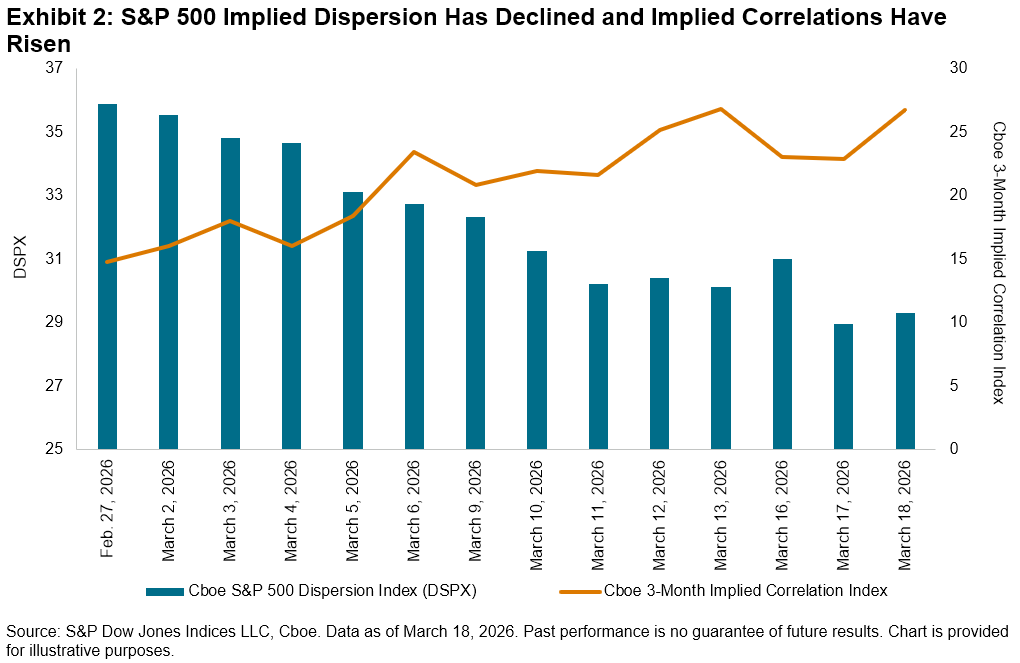
In addition to assessing observed large-cap dispersion and correlation, we can also analyze the market’s expectations of dispersion and correlation in the months ahead. The Cboe S&P 500 Dispersion Index (DSPX), which measures expected dispersion using listed options, has declined steadily from a high of 35.9 on Feb. 27 to 29.3 on March 18. Implied correlations, on the other hand, have generally risen during the same timeframe. Therefore, it appears that the market may continue to expect broader market concerns to be heightened compared to company-level risks.
Dispersion and correlation are both components of market volatility, which we explore in Exhibit 3 to offer additional perspective. Despite the recent decline in dispersion, rising correlations2 have led to a slight rise in realized S&P 500 index volatility since the end of February. Implied volatility, as measured by the Cboe Volatility Index (VIX®), has also ticked up.
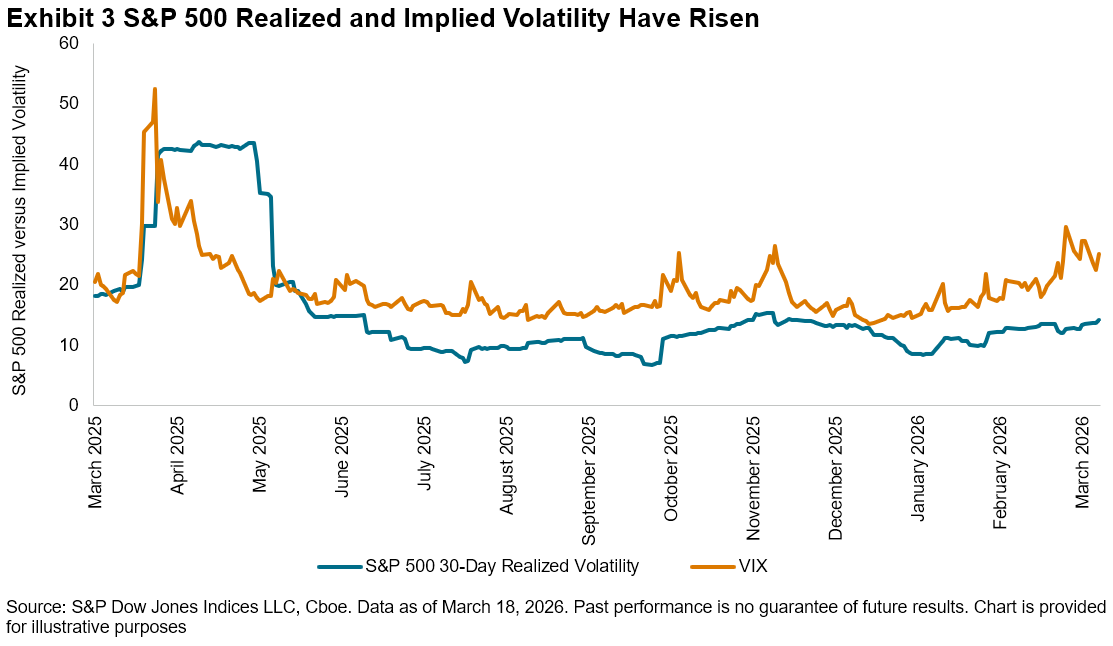
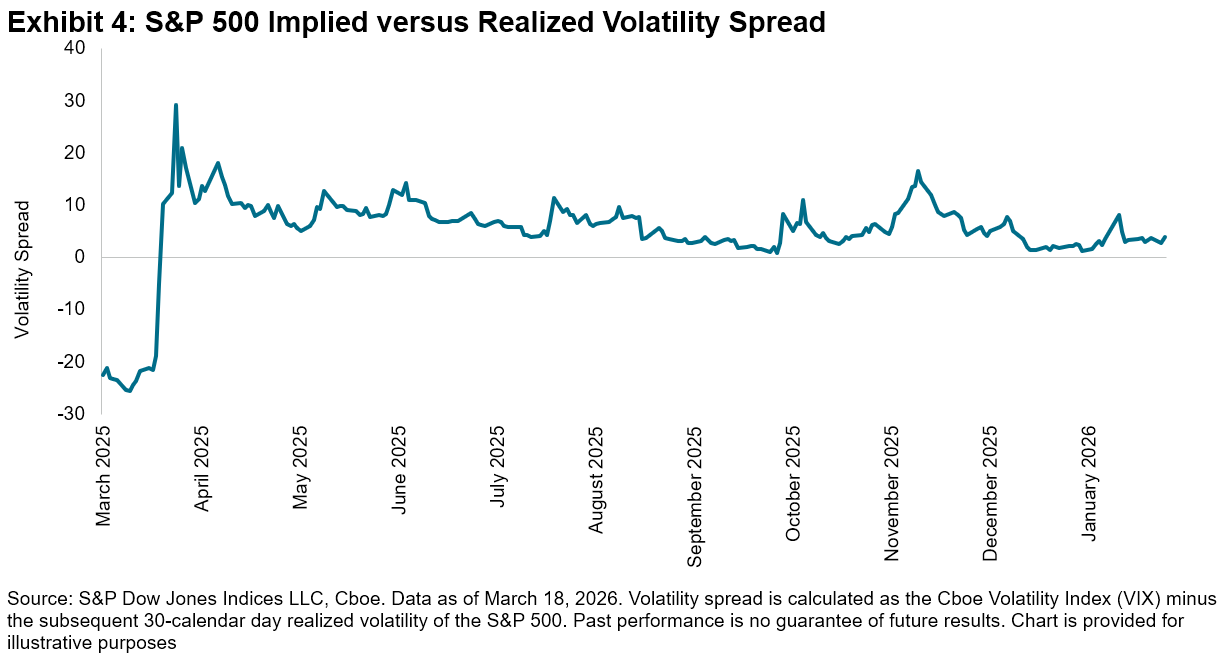
More notably, the spread between the two measures, or volatility premium, can be an indicator of the extent of continued geopolitical uncertainty. The current S&P 500 volatility premium of 3.9 volatility points as of Feb. 3, calculated as VIX minus the subsequent 30-calendar day realized volatility of the S&P 500, while still low compared to recent history, is slightly higher than the historical average of 3.3 observed over the past 20 years.3
As the market wrestles with worries about economic growth, a weakening job market and AI-related concerns, the evolving geopolitical backdrop looms in the background. Understanding the market’s shifting volatility landscape might help investors navigate these turbulent times.
1 Pitcher, Jack. “A Market Frenzy Is Lurking Beneath Those Calm Stock Indexes,” Wall Street Journal, March 3, 2026.
2 For details on the interaction of dispersion and correlation to create volatility, see: Edwards, Tim and Craig J. Lazzara. “At the Intersection of Diversification, Volatility and Correlation,” S&P Dow Jones Indices LLC, April 2014.
3 For more details on the volatility premium in options, see: Lee, Sue, Tim Edwards and Parth Shah. “Defining Paths with Options-Based Index Strategies,” S&P Dow Jones Indices LLC, Feb. 24, 2026.
The posts on this blog are opinions, not advice. Please read our Disclaimers.