Get Indexology® Blog updates via email.

In This List

Introducing a Low-Carbon Solution: The S&P 500 CTB Base+ Index

Tracking Next Gen Factors across Economic Regimes

Seasoning to Taste

When Resilience Resonates: The S&P 500 Resilient Shareholder Yield Index

Defining Paths: The Expanding Landscape of Options-Based Index Strategies

Introducing a Low-Carbon Solution: The S&P 500 CTB Base+ Index

Contributor Image
Maria Sanchez

Director, Sustainability Index Product Management, U.S. Equity Indices

S&P Dow Jones Indices

Climate-focused institutional investors face the challenge of reducing carbon exposure while maintaining broad market representation and the ability to closely track the performance of the underlying market. The S&P 500® CTB Base+ Index offers a practical solution that can be used to measure the performance of constituents from the underlying index that meet specific climate and sustainability criteria.

CTB versus PAB: Understanding the Frameworks

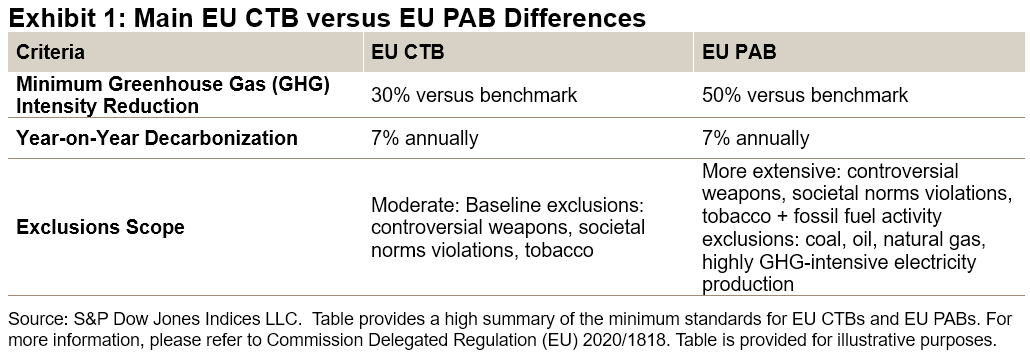
The EU offers two climate benchmarks: the EU Climate Transition Benchmarks (EU CTB) and the EU Paris-Aligned Benchmarks (EU PAB). Both benchmarks support the shift to a low-carbon economy, but they differ in their initial decarbonization levels and exclusion criteria.

S&P Dow Jones Indices (S&P DJI) offers index solutions that align with both the EU CTB and EU PAB frameworks,1 allowing institutions to select the approach that best fits their purpose, risk tolerance and climate objectives.

Building on the EU CTB minimum standards, the S&P 500 CTB Base+ Index adds exclusions for shale oil and gas extraction, stricter thresholds for military weapons, group-level military contracting exclusions and additional constraints on Scope 1 and 2 Weighted-Average Carbon Intensity (WACI) targets and decarbonization trajectory. Using our proprietary glass-box optimization approach, the index selects and weights constituents from the S&P 500 that meet low-carbon transition criteria while minimizing deviations from the underlying index.

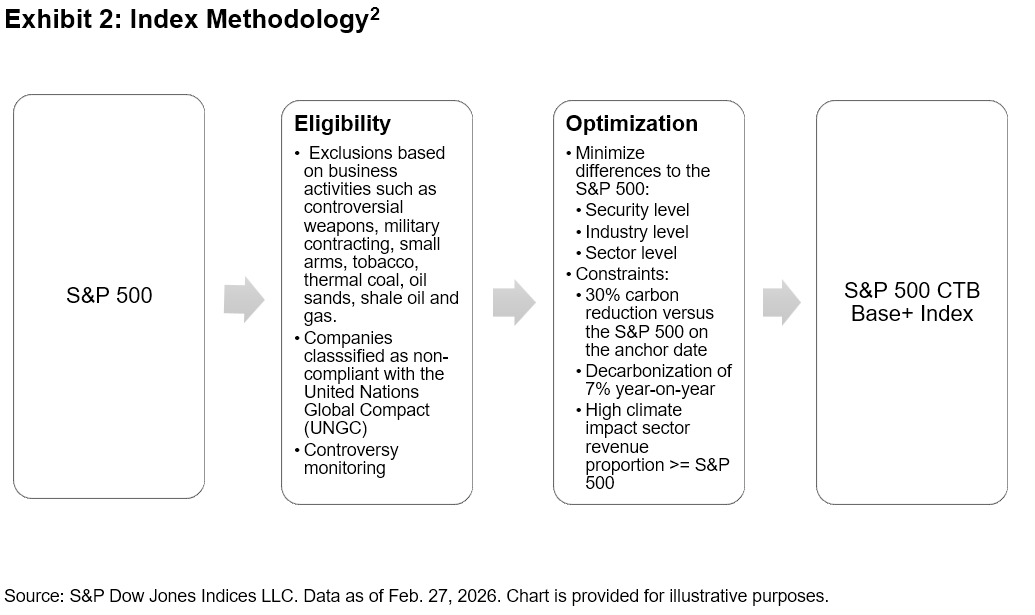
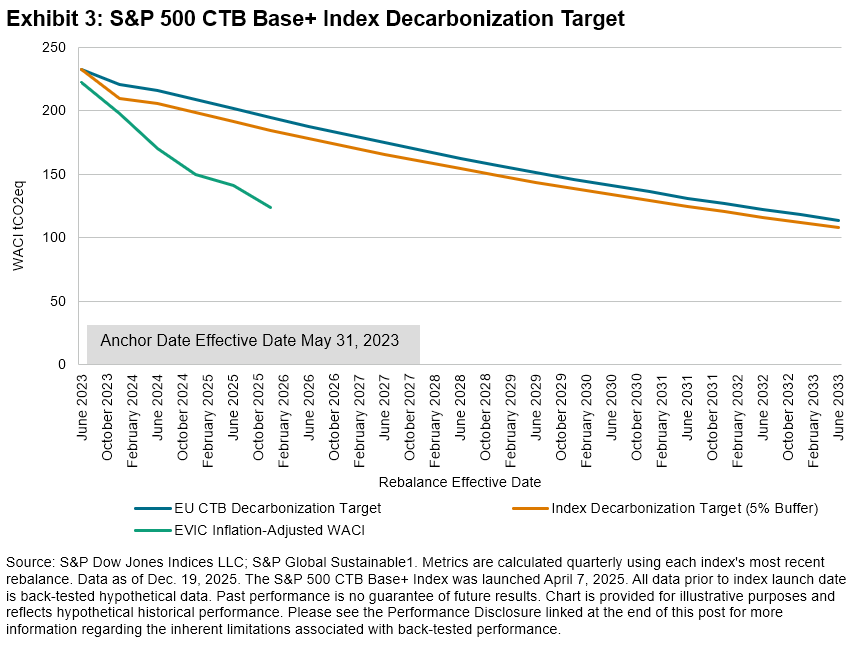
Exhibit 3 shows the decarbonization path of the S&P 500 CTB Base+ Index, which is represented by the index-level enterprise value including cash (EVIC) inflation-adjusted WACI considering Scope 1, 2 and 3 emissions (green line),3 the minimum standards for Scope 1, 2 and 3 emissions (blue line) and a 5% buffer (gold line), anchored to May 31, 2023. The impact of additional restrictions on controllable emissions (Scope 1 and 2) may become more evident.4

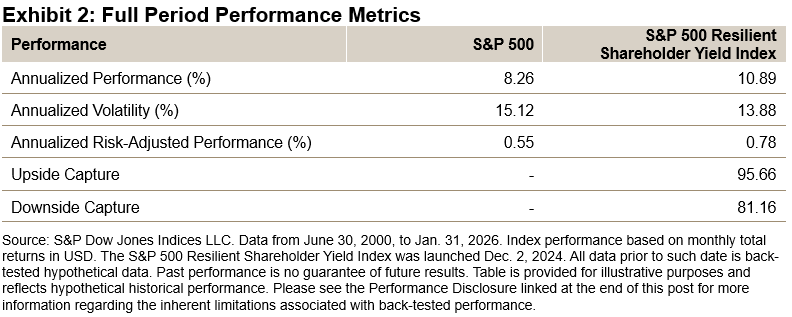
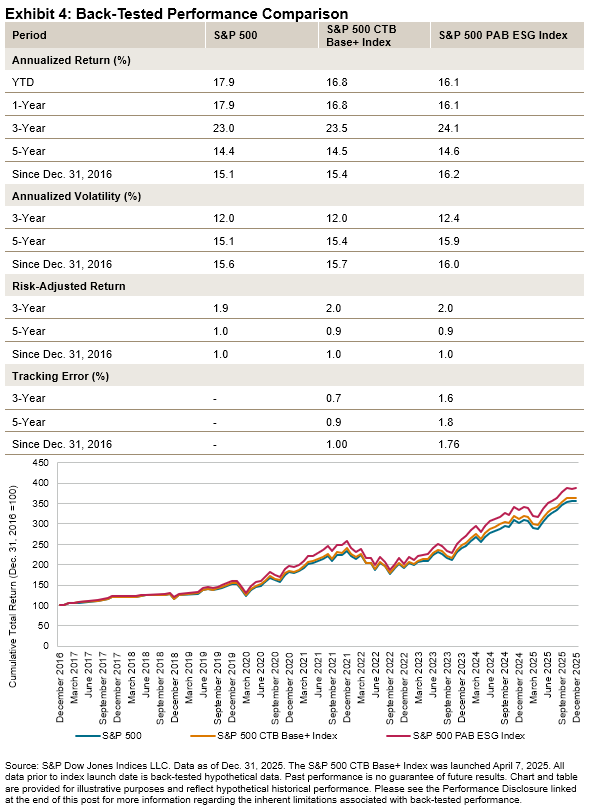
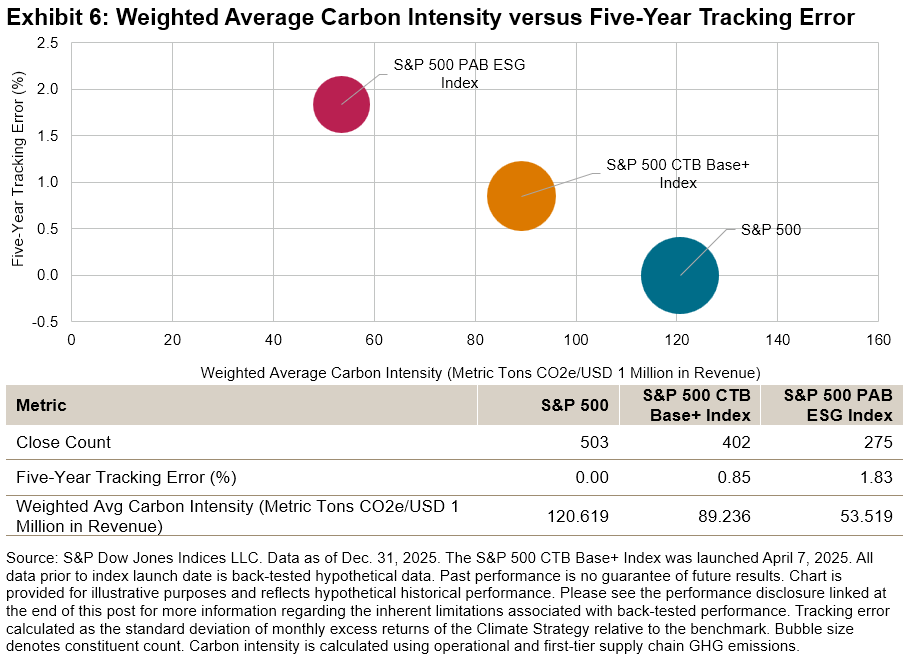
To visualize the potential benefits of the S&P 500 CTB Base+ Index, Exhibit 4 compares it with the S&P 500 PAB ESG Index, which exceeds the EU PAB minimum standards. The S&P 500 CTB Base+ Index has shown historical performance similar to the S&P 500, with slightly lower volatility and tracking error than the S&P 500 PAB ESG Index due to a broader set of constituents.

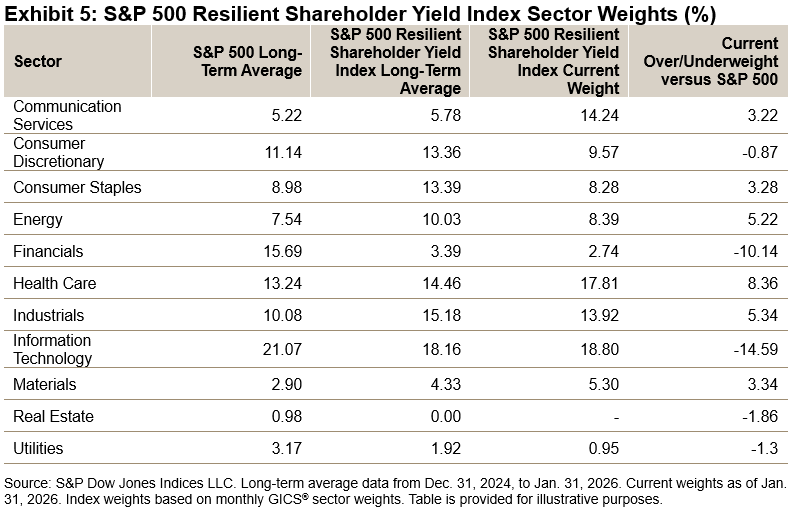
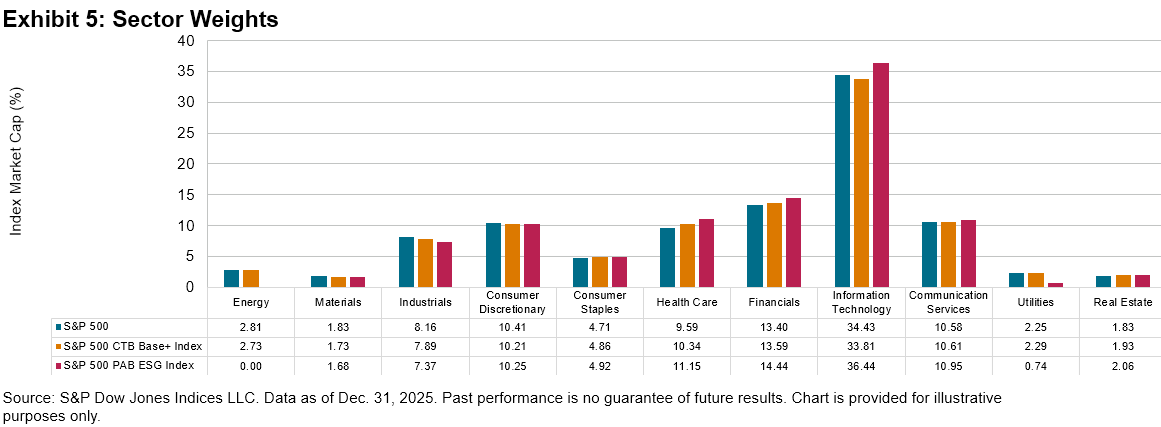
To achieve effective decarbonization requires directing capital toward companies that are actively reducing emissions, not just to those companies that are already low-carbon emitting. The minimum standards for EU CTBs offer a less exclusionary approach that helps maintain exposure to hard-to-abate sectors that are transitioning. Considering our example, the S&P 500 CTB Base+ Index mitigates sector biases, in contrast to stricter alternatives like the S&P 500 PAB ESG Index, which often underweight or exclude sectors such as Energy and Utilities (see Exhibit 5).

As an index adopts less-stringent exclusions and decarbonization goals, such as those contained in the S&P 500 CTB Base+ Index compared to the S&P 500 PAB ESG Index, a greater number of constituents become eligible, resulting in a reduced tracking error.

In summary, the S&P 500 CTB Base+ Index can potentially offer a pragmatic tool for climate-focused investors to align with the EU CTB minimum standards while potentially maintaining lower tracking error and offering a broader diversification when compared to EU PABs.

1 EU Climate Benchmarks based on the S&P 500 universe include indices such as S&P 500 PAB ESG Index, S&P 500 PAB ESG+ Index, S&P 500 PAB Sustainability Screened Index, S&P 500 CTB Index, S&P 500 CTB Base Pathway-Aligned ESG Index, S&P 500 CTB Base ESG Index and S&P 500 CTB Base+ Index.

2 For the full list of exclusions see the index methodology.

3 EVIC Inflation-Adjusted WACI. For more information on how the WACI is adjusted for EVIC inflation, see “Inflation Adjustment” in Section 3, Part 4 of the “EU Required ESG Disclosures Appendix” in the S&P Equity Paris-Aligned & Climate Transition Index Family Benchmark Statement. FAQ: EU Low Carbon Benchmark Regulation; S&P DJI Equity Sustainability metrics reference guide.

4 The forward-looking decarbonization trajectories for indices are calculated using the same sources of data as the weighted-average carbon intensity metrics calculated and disclosed elsewhere in the S&P DJI EU Low Carbon Benchmark Disclosure Report: The S&P Global Sustainable1 Environmental and Scope 3 datasets, and FactSet EVIC data.

The posts on this blog are opinions, not advice. Please read our Disclaimers.

Tracking Next Gen Factors across Economic Regimes

Why does index methodology matter when evaluating the next generation of factor solutions? S&P DJI’s Elizabeth Bebb and Xtrackers Sturmius Schneider explore the metrics powering the next generation of S&P 500 factor indices and how these new tools are helping inform market participants applying factors strategically and tactically. 

The posts on this blog are opinions, not advice. Please read our Disclaimers.

Seasoning to Taste

Contributor Image
Hamish Preston

Head of U.S. Equities

S&P Dow Jones Indices

Enthusiasm over artificial intelligence (AI) has been one of the driving market forces in recent years, with investors’ expectations that certain companies stand to reap particular rewards from the application of AI propelling their valuations.

This dynamic contributed to narrowing leadership among public equity market barometers and, coupled with a growing penchant for companies looking beyond Earth’s limits, helped to explain a 1,500% increase in the collective valuations of the 10 largest venture-backed U.S. companies since March 2021 (see Exhibit 1).

The anticipated initial public offerings (IPOs) later this year from some of these companies—including SpaceX, OpenAI, Anthropic and Databricks—have been met with much enthusiasm. Many market participants have started to wonder when such companies could be eligible for addition to various U.S. equity indices, especially the S&P 500® given it is widely viewed as the preeminent U.S. equity gauge.

Collectively, recent valuations of the 10 largest venture-backed U.S. companies would imply (assuming a full IPO of all stock) that they would make up around 4.5% of the S&P 500 if they joined—more than the weight of the Energy sector, but less than that of Microsoft.

Exhibit 2 outlines the addition criteria that companies must meet to be considered eligible for The 500®. IPOs need to be traded on an eligible exchange for at least 12 months, and index additions must meet size requirements, financial viability and liquidity thresholds, among other criteria. Importantly, index addition is not guaranteed simply by meeting all the eligibility criteria; the index committee is also mindful of other factors such as index turnover and sector balance when considering constituent changes.

The holistic approach to identifying eligible S&P 500 companies can help to distinguish between companies whose elevated valuations may be short lived versus those that are more reflective of the large-cap U.S. equity segment.

The IPO seasoning period is useful in this endeavor given that various eligibility criteria are measured over 12-month periods, but IPO seasoning can also support index replicability. It is common for some investors to be prevented from selling shares for a predetermined time after an IPO; these lockup periods could pose challenges to index trackers that are looking to purchase enough company shares to replicate index weights.

Even if the expected IPOs may not be immediately included under the current methodology, their anticipated scale has motivated market participants to question whether changing the methodology would better support the S&P 500’s objective of representing the large-cap U.S. equity segment. Proponents of IPO fast track eligibility may point to the fact that free float-adjusting index weights, as in the S&P 500, could mitigate replicability concerns, but there are valid arguments in both directions.

Importantly, index methodologies do evolve to ensure that indices continue to represent the market segments they measure, and to ensure indices remain investable and replicable. Indeed, an important role of the index committee is to remain abreast of prevailing market dynamics and longer-term changes to market structure, and where appropriate seek feedback from market participants. Significant methodology changes tend to incorporate public consultations, providing market participants with the opportunity to share their feedback and perspectives on the results.2

In the meantime, S&P Dow Jones Indices maintains other U.S. equity indices that allow fast track IPO eligibility. For example, the S&P Total Market Index and the Dow Jones U.S. Total Stock Market Index require IPO fast track candidates to meet various rules (see Exhibit 3). Unless exceptions are made, candidates must also meet the underlying index eligibility rules, such as requiring at least 10% of a company’s market capitalization to be available to trade.

As a result, the recent focus on IPO eligibility for various indices provides us with an opportunity to examine the potential treatment. The S&P 500’s 12-month IPO seasoning period aligns with holistic assessments of the large-cap U.S. equity segment, while other S&P DJI U.S. equity indices allow for the possibility of fast track IPO entry. While more details may emerge on anticipated IPOs, readers may rely on our public methodologies and processes to stay informed of their future index treatment.

1 For more information see the S&P U.S. Indices Methodology.

2 A current list of open consultations and related announcements is maintained here.

The posts on this blog are opinions, not advice. Please read our Disclaimers.

When Resilience Resonates: The S&P 500 Resilient Shareholder Yield Index

Contributor Image
Elizabeth Bebb

Director, Factor & Dividend Indices

S&P Dow Jones Indices

In a market defined by shifting cycles, tightening financial conditions and an increasingly high bar for corporate discipline, resilience isn’t just a desirable trait—it’s a differentiator. The S&P 500® Resilient Shareholder Yield Index identifies companies that balance rewarding shareholders with the financial strength needed to sustain those rewards over time. Its shareholder yield framework aggregates dividends, net buybacks and net debt reduction to reflect total capital return, while complementary quality metrics emphasize durable fundamentals.

YTD Outperformance of the Benchmark

Year-to-date, the S&P 500 Resilient Shareholder Yield Index has outperformed the S&P 500 by 10%. This builds on its robust performance from the index’s first year of live history, when it gained 21.04%, contributing to a 5.80% cumulative outperformance relative to the S&P 500 since its launch on Dec. 2, 2024.

Methodology Overview

The methodology for the S&P 500 Resilient Shareholder Yield Index identifies companies with high shareholder yield while maintaining financial quality. This process begins by excluding companies with a shareholder yield above 25%, which removes high yielding firms that may point to structural challenges or financial distress.

Remaining companies are ranked using four metrics: two focused on consistent capital return generation (shareholder yield and capital return growth) and two quality measures (return on equity and free cash flow-to-total debt). Companies are scored and ranked based on their average performance across these metrics, with the top 100 selected for inclusion. Constituents are then weighted proportionally to their float-adjusted market capitalization (FMC) multiplied by their shareholder yield.

Back-Tested Historical Performance

Over the long-term back-tested period, the index has delivered an annualized gain of 10.89%, outperforming its benchmark by 5.63%. Notably, this was achieved with a lower overall annualized volatility, leading to higher risk-adjusted performance than the benchmark.

Defensive Characteristics

The S&P 500 Resilient Shareholder Yield Index has historically exhibited defensive characteristics, particularly during periods of elevated market volatility. Back-tested results show that when volatility increased—measured by VIX® levels above 20—the index tended to outperform relative to the S&P 500.

Macroeconomic Performance

Examining the index’s back-tested performance across different macroeconomic environments shows that it has delivered its strongest outperformance during periods of rising inflation—especially when economic growth was slowing. Although these environments have historically challenged broader equity markets, companies with disciplined capital allocation, strong cash generation and balance sheet flexibility have proven to be more resilient.

Sector Weights

The sector composition of the S&P 500 Resilient Shareholder Yield Index has historically favored Industrials and Consumer Staples while maintaining an underweight position in Financials. Currently, the index shows a pronounced underweight to Information Technology, alongside increased weight to Health Care, Energy and Industrials—reflecting a tilt toward more resilient cash flows and balance sheets.

Conclusion

Taken together, the historical evidence suggests that the S&P 500 Resilient Shareholder Yield Index lives up to its name. It has demonstrated an ability to participate meaningfully in rising markets while offering resilience during more challenging regimes. For market participants seeking an index that screens for companies that combine consistent capital return and financial discipline, the S&P 500 Resilient Shareholder Yield Index may offer a compelling framework for navigating changing market conditions.

The posts on this blog are opinions, not advice. Please read our Disclaimers.

Defining Paths: The Expanding Landscape of Options-Based Index Strategies

Contributor Image
Sue Lee

Director and APAC Head of Index Investment Strategy

S&P Dow Jones Indices

The investment landscape is in a perpetual state of evolution, with market participants continually seeking innovative tools. In recent years, options-based strategies—particularly those delivered through an ETF wrapper—have surged in popularity. Once the domain of institutional investors or structured product users, options-based strategies like covered call and buffered strategies have been democratized. This growth represents a significant shift that could reshape how a wider range of investors approach portfolio construction and navigate market volatility.

The Engine of Growth: Accessibility and Market Needs

The proliferation of options-based ETFs has been a notable development, providing investors with a generally easier-to-own and more liquid vehicle for accessing these strategies. As shown in Exhibit 1, their asset growth has been exponential, particularly in the last five years. Beyond the regulatory changes, this reflects an environment where traditional cross-asset correlations have shifted, and investors are increasingly looking beyond the conventional 60/40 portfolio for diversification and risk mitigation.

Two strategies have captured the lion’s share of this growth: covered call and buffered strategies. Covered call strategies focus on generating income by selling call options against invested assets, while buffered strategies aim to provide a specific level of downside protection in exchange for a cap on upside participation. By writing call options or buying put options, both strategies have historically made investment returns steadier and more predictable. A rolling one-year performance comparison of representative S&P 500® covered call and buffered indices versus the S&P 500 over the past 14 years shows that covered call and buffered indices delivered performance in the 0-15% range in more than two-thirds of the periods, compared to only one-third for the S&P 500.

The Foundational Role of Indices

Indices play a multifaceted, critical role in this expanding landscape. First and foremost, liquid and well-established equity benchmarks serve as the core component of the majority of these strategies. The S&P 500 is the preeminent choice, with its robust trading ecosystem: the high liquidity and tight bid-ask spreads in S&P 500 options facilitate the effective implementation of various strategies, from daily covered calls to one-year buffered products, catering to a wide spectrum of investment objectives.

Indices also serve as essential benchmarks for both active and passive options-based strategies. In a market crowded with funds described as actively managed, the ability to compare performance against a transparent and rules-based benchmark is paramount. Indices allow investors to dissect performance, understand the drivers of return and make informed decisions about whether a particular strategy is delivering on its objectives, ultimately fostering greater accountability and trust.

As investors continue to seek solutions that enhance portfolio resilience and adopt a more balanced approach to navigating market volatility, the relevance of options-based strategy indices could be expected to grow further. For a deeper dive into this topic, please refer to our recently published paper, “Defining Paths with Options-Based Index Strategies.”

The posts on this blog are opinions, not advice. Please read our Disclaimers.