For more than 20 years, S&P DJI’s SPIVA® (S&P Indices Versus Active) Scorecards have been evaluating active funds’ performance against their appropriate benchmarks on a biannual basis. The results of our regional SPIVA Scorecards continue to show that active outperformance is rare, especially over the long term.1
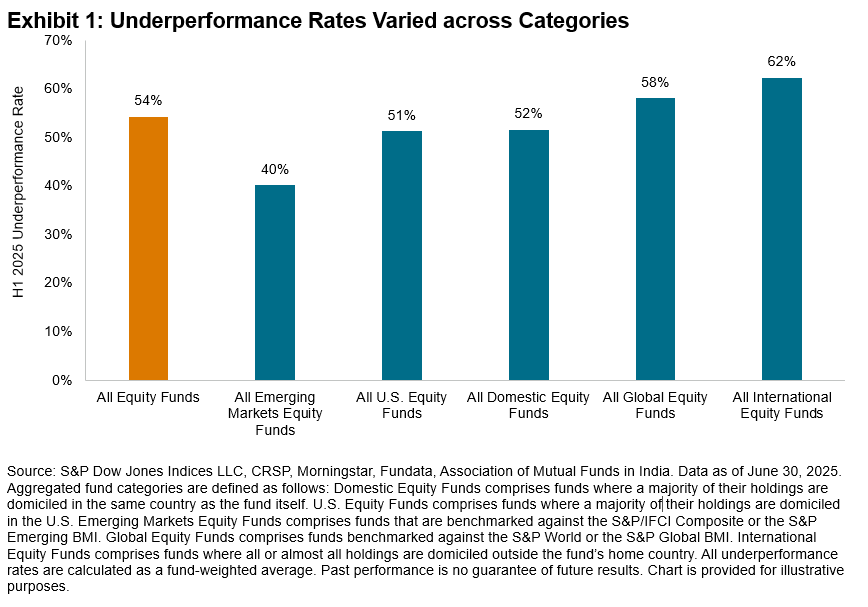
Spanning across 11 regions, 54% of all equity funds underperformed across categories.2 Not coincidentally, this result is consistent with the relatively benign 54% underperformance rate for our largest and most closely watched category of U.S. Large Cap Equity funds, which is on track for its lowest annual underperformance rate since 2022.
Outside of the U.S., there were additional bright spots, with Exhibit 1 showing that most Emerging Markets Equity funds outperformed, while International Equity and Global Equity funds had a slightly more difficult time beating their respective benchmarks.
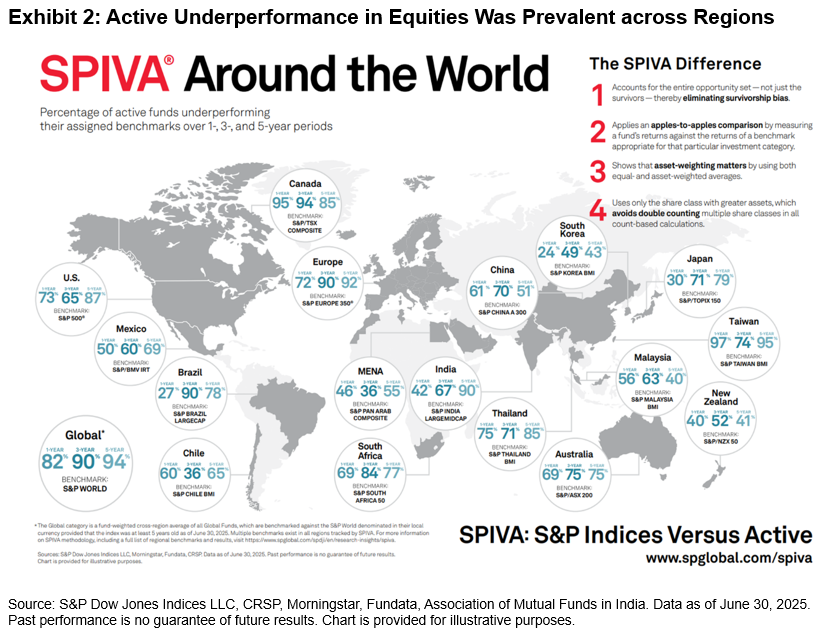
Turning our attention to domestic equity managers across regions, 11 of our 17 reported domestic fund categories in Exhibit 2 posted majority underperformance in H1 2025. Results varied across regions; for example, only 17% of managers domiciled in Brazil underperformed the S&P Brazil LargeCap. Meanwhile, results were worse for South African managers, with 92% underperforming against the S&P South Africa 50. The 1-, 3- and 5-year underperformance rates for these funds and more are shown in Exhibit 2.
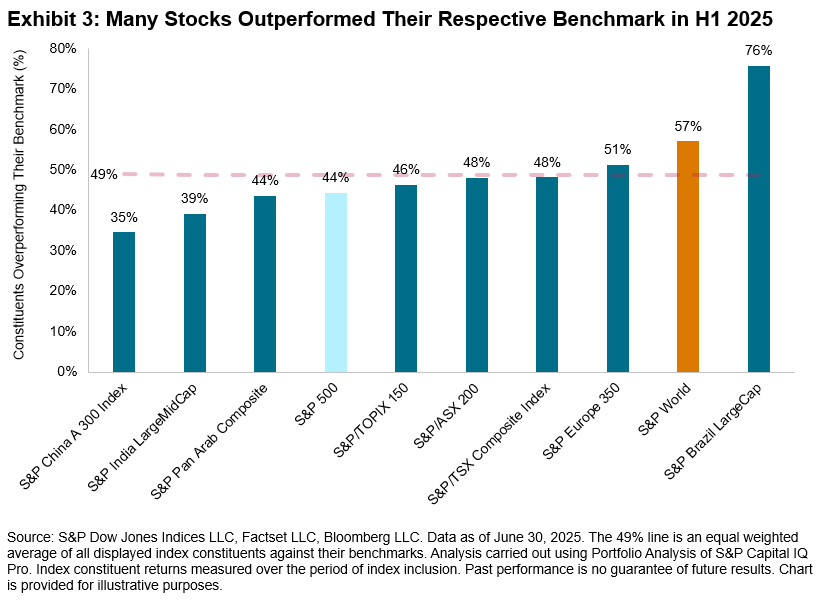
Offering perspective on the prospects for stock pickers globally, Exhibit 3 shows the percentage of constituents that beat the benchmark across categories. On average, 49% of stocks outperformed their respective benchmarks across regions. The 44% rate for the S&P 500® notably displayed a significant improvement compared to 2023 and 2024, both challenging years driven by mega-cap dominance. The majority outperformance of Brazil domestic funds is perhaps consistent with the fact that 76% of stocks outperformed their benchmark.
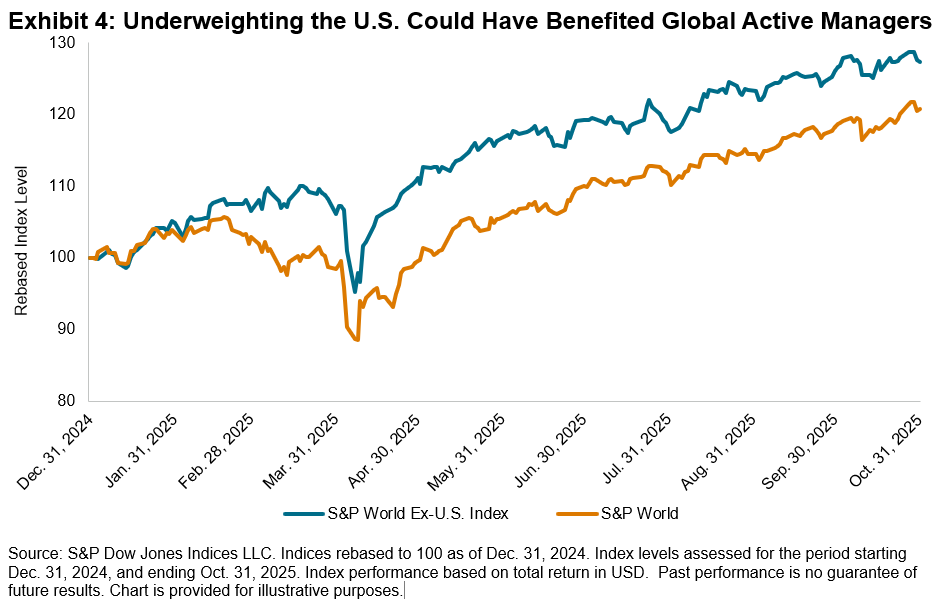
Looking more broadly, in addition to better-than-average prospects for stock selection, regional allocation decisions may have mattered particularly for global equity managers, with the S&P World Ex-U.S. Index outperforming the S&P World by 9% in H1 2025. As observed in Exhibit 4, global fund managers may have benefited from an underweight to the U.S., which makes up 72% of the S&P World’s weight. Despite this tailwind, 58% of global managers still failed to outperform across regions, as demonstrated in Exhibit 1.
H1 2025 was a tale of two markets, while H2 has seen sustained outperformance of large caps, with the S&P 500 Equal Weight Index underperforming the S&P 500 by 6% as of Nov. 6, 2025. This may signal headwinds for active managers who underweight the largest stocks. Meanwhile, the turnaround in U.S. markets, with the S&P World outpacing S&P World Ex-U.S. Index by 2% over the same time period, may portend challenges for international and global equity funds. In the meantime, to find out more about the results of our SPIVA Mid-Year 2025 Scorecards across regions and asset classes, visit our SPIVA Library.
1 Ganti, Anu and Lazzara, Craig, “Shooting the Messenger,” S&P Dow Jones Indices, November 2022.
2 Calculated as the ratio of the number of funds underperforming YTD to the total number of funds at the beginning of the YTD period across all SPIVA regions.
The posts on this blog are opinions, not advice. Please read our Disclaimers.