


Meet the Cambridge Associates Private Markets Benchmark Calculator, a new tool designed to help investors make more informed decisions and bring greater clarity and deeper insights to private markets.
Unlocking Deeper Insights in Private Markets
Dividend Growth and Equity Participation: Insights from the S&P U.S. Dividend Growers Index
Understanding Energy Transition and Sustainability Reporting
Weighting in the Wings: Equal Weight in a Mega-Cap World
SPIVA Insights: Key Findings in the Middle East
Unlocking Deeper Insights in Private Markets
Dividend Growth and Equity Participation: Insights from the S&P U.S. Dividend Growers Index

Wenli Bill Hao
Director, Factors and Dividends Indices, Product Management and Development
S&P Dow Jones Indices
As the 10-year U.S. Treasury yield hovers above 4.0%, it’s possible that market participants can find yields without assuming excessive risk. However, a significant challenge remains: protecting against inflation and preserving purchasing power. For example, due to inflation, USD 1,000 in December 2005 was equivalent to only USD 606 as of June 2025. In contrast, dividend strategies can be appealing, since companies often grow their dividends over time and offer the potential for capital appreciation.
In June 2021, S&P DJI launched the S&P Dividend Growers Indices. The S&P U.S. Dividend Growers Index tracks companies within the S&P United States BMI universe that have consistently increased their regular cash dividends per share annually for 10 consecutive years. To avoid value traps, the index excludes the top 25% of highest-yield ranked stocks from its universe.1 In this blog, we will examine the historical dividend growth, as well as risk and return statistics for this index, highlighting its tendency to track higher quality companies.
Dividend Growth versus Inflation
Over the long term, the S&P U.S. Dividend Growers Index has increased its dividends at a rate that exceeds inflation, thereby preserving purchasing power. From 2006 to 2025, the dollar dividends for this index grew at a compound annual growth rate (CAGR) of 6.46%, easily outpacing the Consumer Price Index (CPI)2 inflation rate during the same period.

Equity Participation with Defensive Qualities
While income-oriented investors may gravitate toward bonds for their predictable interest payments and return of principal at maturity, dividend strategies offer regular cash flows through dividends, along with the added benefit of equity participation. Over the past 15 years, the S&P U.S. Treasury Bond 10+ Year Index underperformed the CPI, with an annualized return of just 2.23%. In contrast, the S&P U.S. Dividend Growers Index showed a notable annualized return of 13.38% over the same period.
Moreover, the S&P U.S. Dividend Growers Index delivered this performance with defensive qualities, indicating that companies capable of consistently growing their dividends may be of higher quality. As shown in Exhibit 2, the index has demonstrated lower volatility than the S&P United States BMI across all periods studied, allowing it to outperform its benchmark on a risk-adjusted basis. Historical capture ratios indicate that the S&P U.S. Dividend Growers Index had strong participation in up markets,3 while delivering substantial outperformance during down markets.

Defensive Traits with Quality and Value Tilts
In Exhibit 3, we used the Fama-French Three-Factor Model4 and AQR Quality5 factors to analyze the historical returns of the S&P U.S. Dividend Growers Index. The factor loading estimates and associated t-statistics reveal that the index constituents exhibited positive exposures to lower beta (less than 1), larger size, higher value and higher quality. The empirical results indicate that the index exhibited more defensive characteristics (lower risk), along with superior quality and valuation features compared to the overall market. High quality fundamentals serve as the foundation for consistent dividend increases.

Summary
With its consistent dividend growth, the S&P U.S. Dividend Growers Index has exhibited dividend growth that has outpaced inflation while delivering strong performance in terms of both absolute and risk-adjusted returns.
1 For further information about the index, please see S&P Dividend Growers Index Series Methodology.
2 U.S. Bureau of Labor Statistics, Consumer Price Index for All Urban Consumers, retrieved from FRED, Federal Reserve Bank of St. Louis; https://fred.stlouisfed.org/series/CPIAUCSL.
3 The market is defined as the monthly performance of the underlying benchmark from March 31, 2006, to June 30, 2025.
4 Fama, E. F. and K.R. French. “Common risk factors in the returns on stocks and bonds.” Journal of Financial Economics. 33: 3–56. 1993.
5 Cliff Asness, Andrea Frazzini and Lasse H. Pedersen. “Quality Minus Junk.” Review of Accounting Studies. 2013.
The posts on this blog are opinions, not advice. Please read our Disclaimers.Understanding Energy Transition and Sustainability Reporting
How are indices and data-driven insights helping market participants navigate the evolving energy transition landscape? S&P DJI’s Maya Beyhan and S&P Global Sustainable1’s Patil Mesrobian join the CFA Institute’s Jeanette Tawk for a closer look at the expanding toolkit for assessing potential energy transition risks and opportunities.
The posts on this blog are opinions, not advice. Please read our Disclaimers.Weighting in the Wings: Equal Weight in a Mega-Cap World

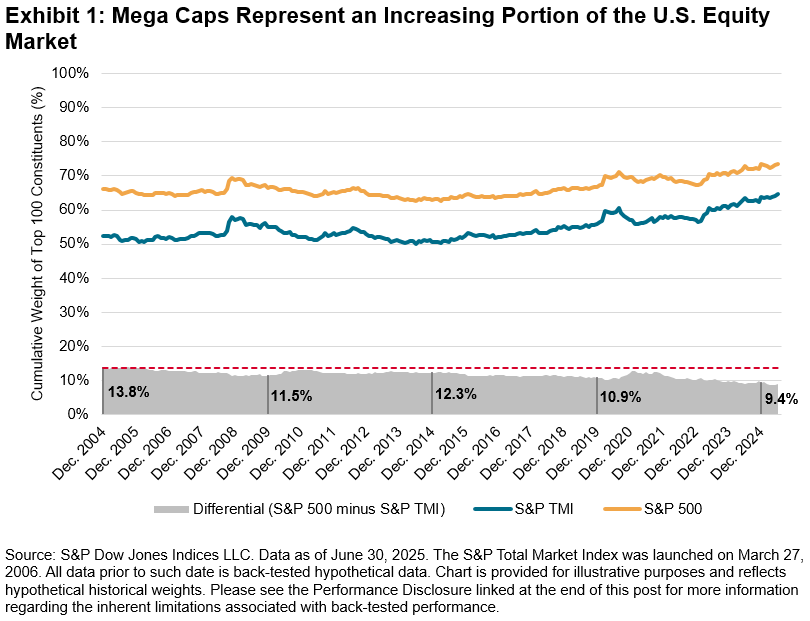
In today’s equity market, mega-cap stocks are not just influential—they have become a driving force shaping overall performance and strategic market dynamics.1 The increasing market dominance of the top 100 constituents, and the narrowing differential in cumulative weights of these names, in both the S&P Total Market Index (TMI)—which tracks the broad U.S. equity market—and the S&P 500® highlights this shift (see Exhibit 1).
The S&P 100 is designed to measure the performance of large-cap U.S. companies from The 500™ and comprises 100 blue-chip companies across multiple industry groups, offering a focused view of this robust and sizable segment of the market. The index’s construction follows a transparent and systematic approach to include the largest companies by total market capitalization. Generally, the largest companies in The 500 that have listed options are selected for inclusion into the S&P 100, and constituent selection is at the discretion of the Index Committee.2
While mega-cap names have historically driven substantial and sustained market growth, led particularly by gains in the Information Technology sector,1 their increasing market concentration may present challenges. Equal-weight strategies can potentially help manage concentration risk by enhancing diversification through a more even weight across the segment, reducing reliance on a handful of dominant names and better reflecting gains when performance is more broadly distributed.3
The S&P 100 Equal Weight Index
The S&P 100 Equal Weight Index (EWI) is the equal-weight version of the S&P 100. The index has the same constituents as its capitalization-weighted benchmark, but each company is assigned an equal weight at each quarterly rebalance. Constituent changes to the equal weight index are incorporated alongside the S&P 100. If a company is added between rebalances, it generally takes the weight of the company that it replaced.2
Why the S&P 100 EWI Matters
As of June 30, 2025, the S&P 100 EWI outperformed the market-cap-weighted S&P 100, S&P 500 and S&P TMI on a YTD and one-year basis (see Exhibit 2).
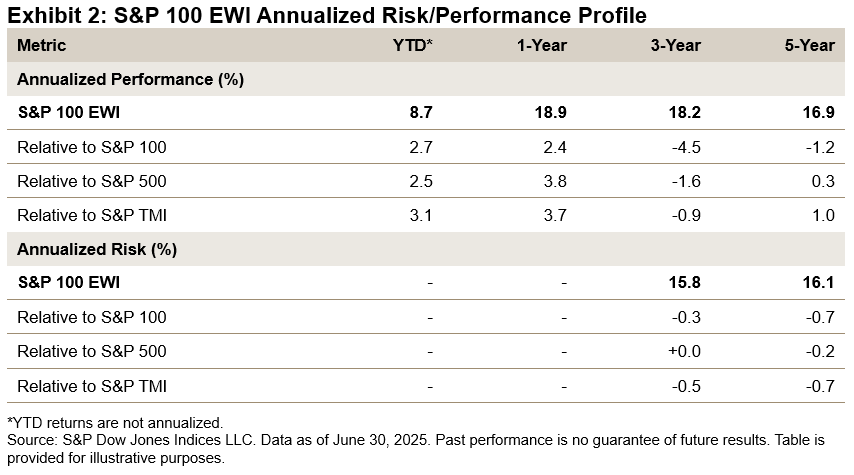
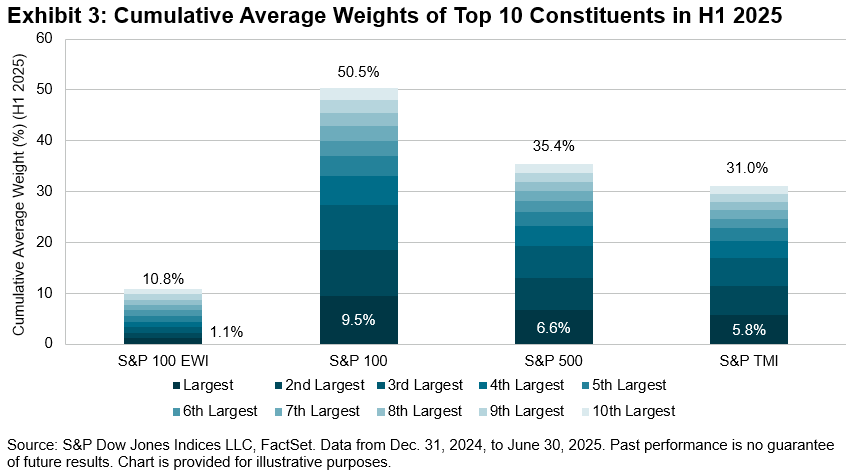
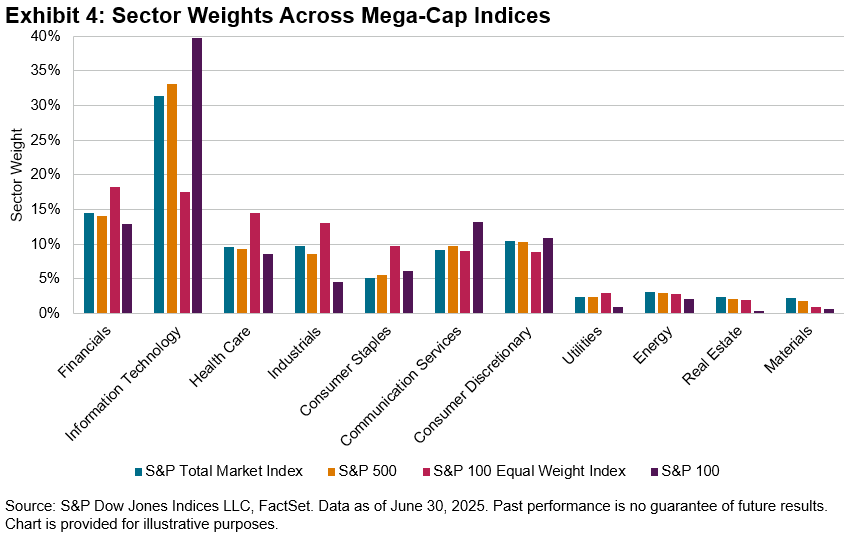
The divergence in performance between the S&P 100 EWI and market-cap-weighted indices highlights the impact of index construction. While the S&P 100 EWI offers balanced participation from all 100 companies, regardless of size, the market-cap-weighted S&P 100—along with The 500 and S&P TMI—tend to concentrate more heavily in the largest stocks (see Exhibit 3). Closely linked to this is the variation in sector composition between the indices. As of June 30, 2025, the S&P 100 EWI had comparatively lower weight in mega-cap Information Technology companies and higher weights in Financials, Health Care and Industrials (see Exhibit 4).
Conclusion
By providing an equal-weighted measure of the largest 100 U.S. companies, the S&P EWI offers a more balanced perspective on mega-cap performance. Accompanied by reduced concentration in top-heavy mega-cap names and broader sector views, it has outperformed its market-cap-weighted counterparts over recent periods. For market participants seeking a more diversified approach within the mega-cap segment, the S&P 100 Equal Weight Index may serve as a useful complement to traditional benchmarks.
1 Wang, Fei, “Exploring the U.S. Mega-Cap Landscape,” S&P Dow Jones Indices, April 2, 2025.
2 For more information, see the S&P U.S. Indices methodology.
3 See Edwards, Tim, et al. “Worth the Weight,” S&P Dow Jones Indices. July 23, 2024.
The posts on this blog are opinions, not advice. Please read our Disclaimers.SPIVA Insights: Key Findings in the Middle East
- Categories Equities, Fixed Income
- Tags Active vs. Passive, MENA, Middle East, passive investing, SPIVA
How do active managers stack up to passive benchmarks in the Middle East? S&P DJI’s Tim Edwards joins GCMA’s Michael Grifferty for a closer look at the latest SPIVA MENA results and explores what’s driving the growth of passive in the region.
The posts on this blog are opinions, not advice. Please read our Disclaimers.