


S&P DJI’s SPIVA (S&P Indices versus Active) Scorecards have been measuring active funds’ performance against appropriate benchmarks for over 20 years. With the release of the SPIVA Asia Ex-Japan Year-End 2024 Scorecard, our latest regional addition, all 11 regional SPIVA Scorecards tracking fund performance in 2024 are now available.
2024 was another challenging year for active managers, with a cross-category, fund-weighted average of 71% of equity funds listed across all regions in Exhibit 1 underperforming their respective benchmarks. Exhibit 1 shows the underperformance rates by region for selected equity fund categories across 1-, 3- and 5-year horizons. Note that majority outperformance in 2024 was only achieved by active managers in Mexico, South Africa and the MENA region.
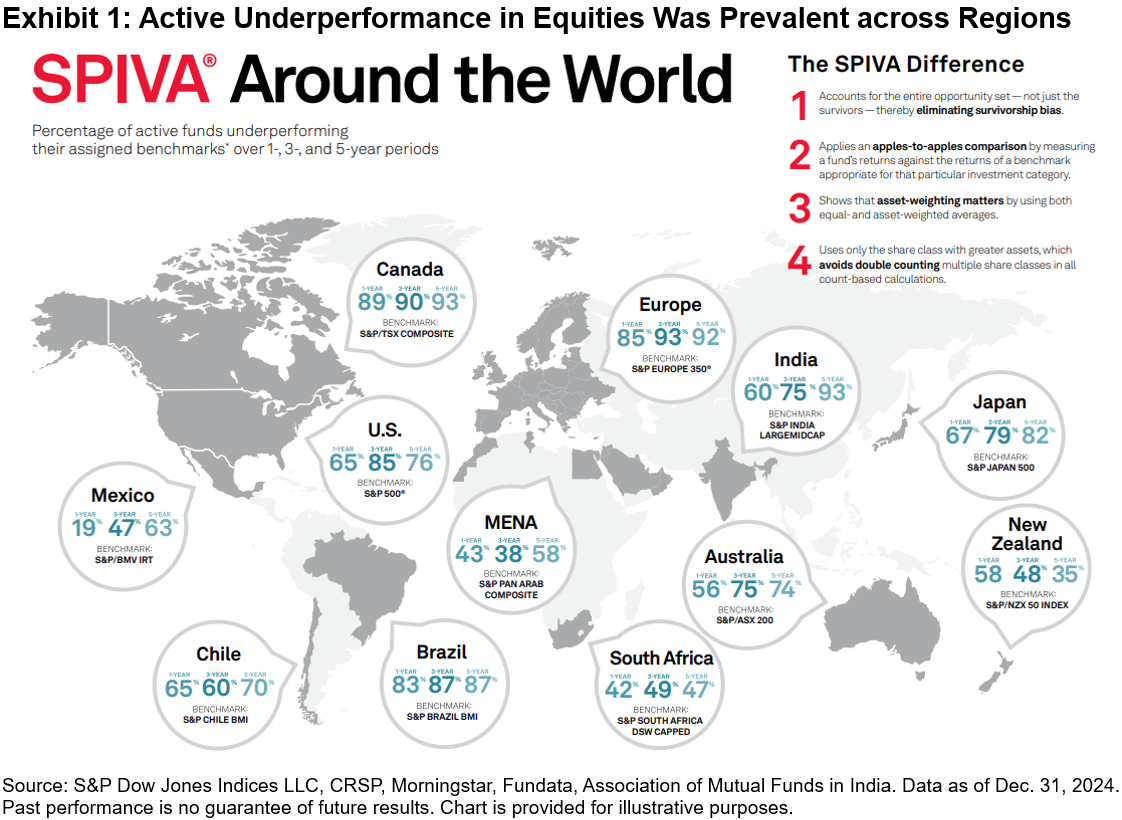
U.S. dominance prevailed versus the rest of the world, with the S&P 500® up 25.0% in 2024, outperforming the S&P World Ex-U.S. Index by 19.2%. Large-cap dominance meant a higher hurdle for active managers to climb, with only 28% of constituents outperforming the S&P 500. Given the increasing concentration and outperformance of the largest stocks in 2024, it is unsurprising that 65% of large cap managers, who may often be underweight the largest stocks,1 underperformed The 500™.
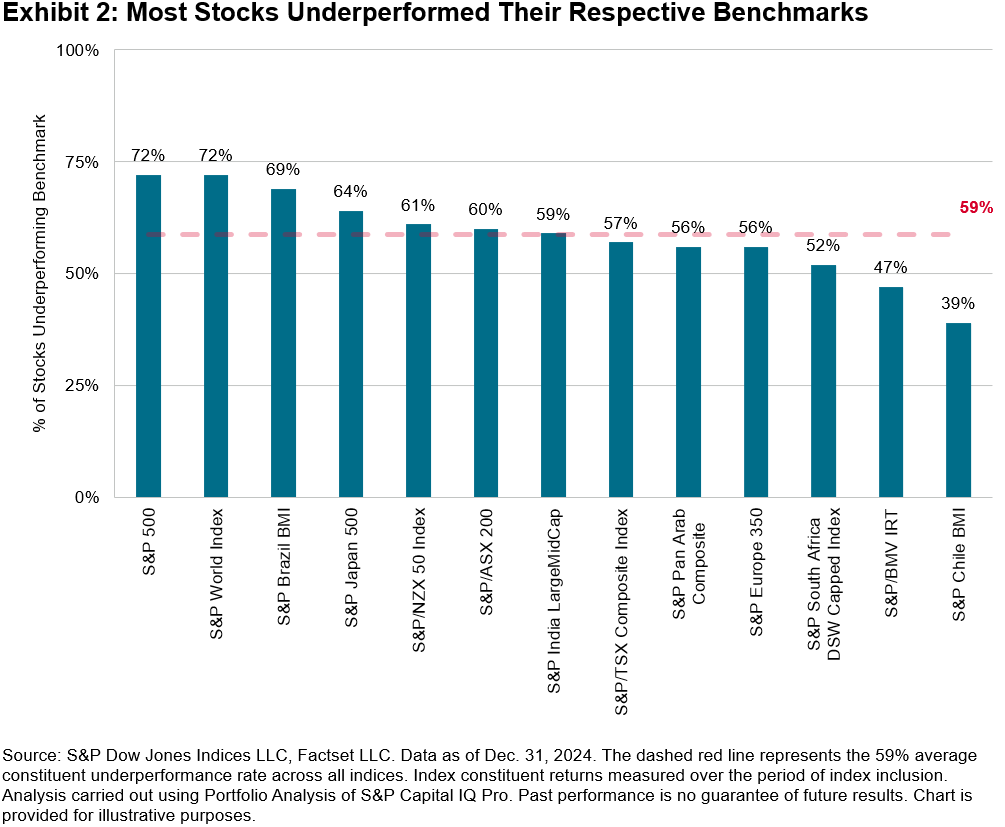
The challenge of stock selection was not a phenomenon unique to the U.S. in 2024—it was also observed globally, as 59% of stocks on average failed to beat their respective benchmarks globally (see Exhibit 2). Chile, Mexico and South Africa were bright spots, with only 39%, 47% and 52% of stocks underperforming their respective benchmarks, coinciding with majority outperformance rates in two of the three regions: Mexico and South Africa.
While generating outperformance was tough for stock pickers, fixed income managers performed relatively better than their equity peers, with only 48%2 of funds listed across all regions in Exhibit 3 underperforming their respective benchmarks. In the U.K., German and U.S. bond markets, the beginning of 2024 saw heightened interest rates and an inverted yield curve that disinverted throughout the year. Bond managers who shortened their duration exposures may have been the benefactors of such an environment. Exhibit 3 shows underperformance rates by region for selected fixed income fund categories across 1-, 3- and 5-year horizons.
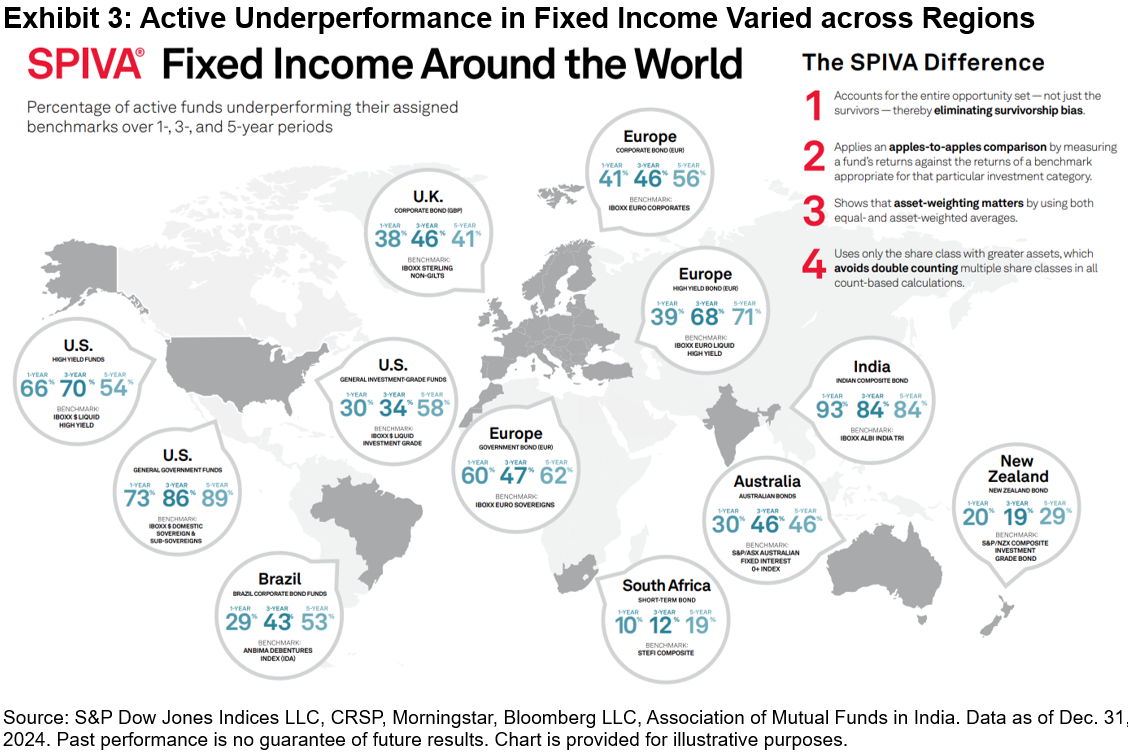
Tilting toward riskier credit segments was a potential tailwind for bond managers in regions like the U.S., with a 7% excess return between the iBoxx $ Liquid High Yield Index and iBoxx $ Liquid Investment Grade Index. Only 30% of Investment-Grade funds underperformed the iBoxx $ Liquid Investment Grade Index compared to 66% of High Yield funds versus the iBoxx $ Liquid High Yield Index. European credit managers also fared well, with majority outperformance rates for euro-denominated corporate and high yield funds.
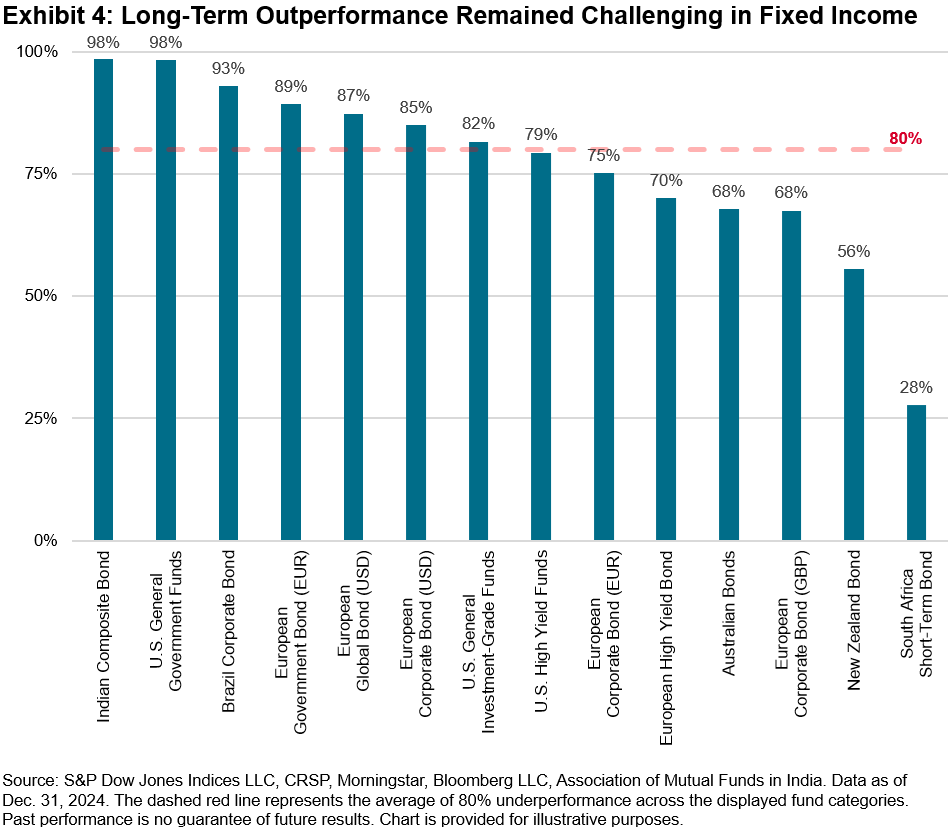
Despite strong relative performance in 2024 from most fixed income fund categories, the long-term trends of underperformance remained. Exhibit 4 shows that, on average, 80%3 of funds in categories included in Exhibit 3 underperformed their respective benchmarks over the 10-year horizon. Only one fixed income category, the South Africa Short-Term Bond benchmarked against the STeFi Composite, recorded majority outperformance over the past 10 years.
While active manager performance varies across regions and across asset classes, one trend remained true: outperforming the benchmark is difficult, especially over the long term. Find out more from our SPIVA Library.
1 Chan, Fei Mei and Lazzara, Craig, “Degrees of Difficulty”, S&P Dow Jones Indices, January 2022
2, 3 Cross-category, fund-weighted average
The posts on this blog are opinions, not advice. Please read our Disclaimers.


