Get Indexology® Blog updates via email.

In This List

Navigating Uncertainty: The Defensive Attributes and Performance Drivers of the S&P 500 Quality Index

Stock Pickers: Lights, Camera, Anticlimax?

Turning the Tide: Global Markets Outperforming U.S. Equities

The Market Measure: April 2025

Expectations and Anomalies

Navigating Uncertainty: The Defensive Attributes and Performance Drivers of the S&P 500 Quality Index

Contributor Image
Wenli Bill Hao

Director, Factors and Dividends Indices, Product Management and Development

S&P Dow Jones Indices

Amid macroeconomic uncertainty and elevated volatility, the S&P 500® has experienced a notable decline. In the challenging market conditions from Dec. 31, 2024, to April 4, 2025, the S&P 500 Quality Index not only outperformed the S&P 500 but also showcased its defensive characteristics, which have been evident throughout its history. In this blog, we will explore the performance, attribution and key characteristics of the S&P 500 Quality Index.

Performance

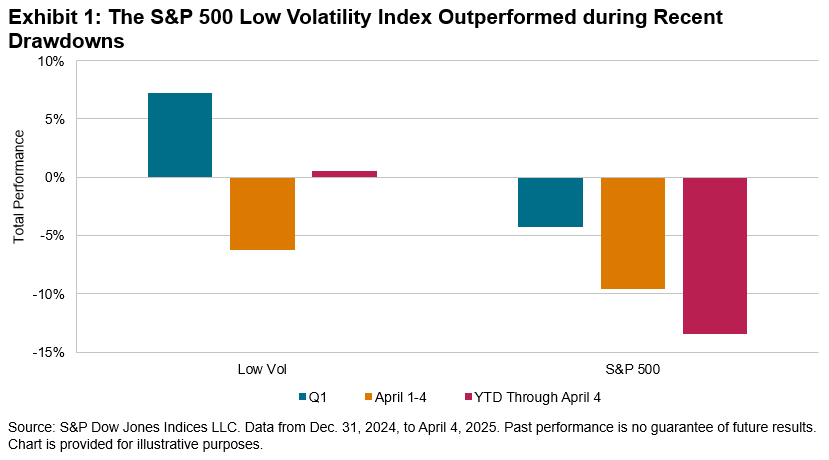
During this turbulent period, the S&P 500 Quality Index outperformed the S&P 500 by 3.58% YTD, while exhibiting lower volatility (see Exhibit 1). Such performance highlights the defensive and resilient characteristics of this index.

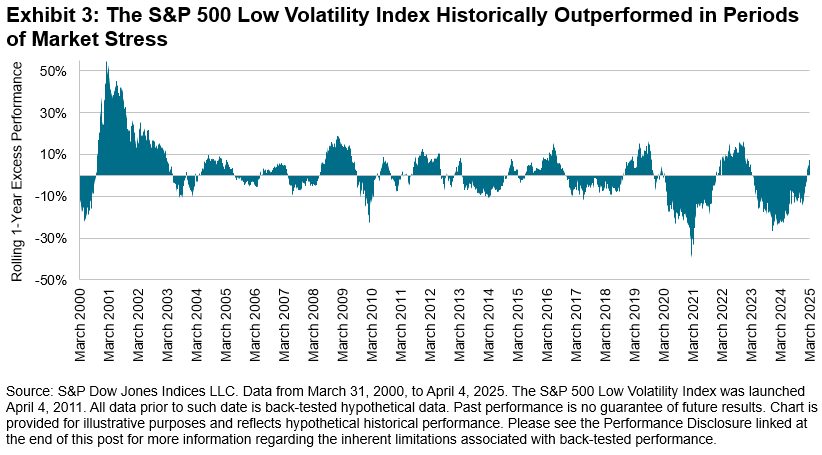
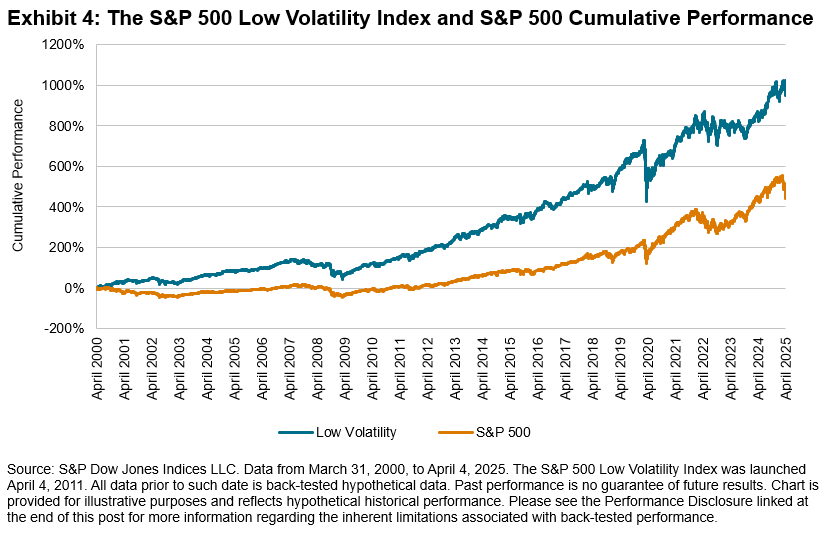
Moreover, this recent outperformance aligns with its historical track record, which indicates that tracking companies with strong fundamentals has been an effective approach for achieving consistent and long-term performance. As shown in Exhibit 2, the S&P 500 Quality Index has outperformed the S&P 500 in terms of total return and risk-adjusted return across almost all periods studied while maintaining consistently lower volatility.

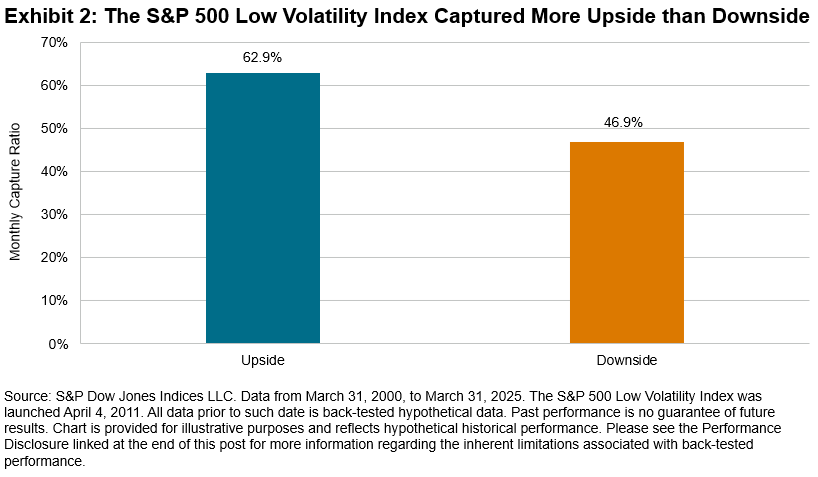
The historical capture ratios show that the S&P 500 Quality Index has typically participated one-for-one in up markets,1 while delivering significant outperformance during down markets. This makes sense, as quality indices tend to track companies with durable business models and sustainable competitive advantages.

Methodology Overview

High quality is typically associated with a company’s strong profitability, high earnings quality and robust financial strength. To effectively reflect these quality characteristics, the S&P Quality Indices utilize three key metrics: return on equity (ROE), balance sheet accruals ratio (BSA) and financial leverage ratio (FLR) (see Exhibit 3).

The selection process for the S&P Quality Indices involves identifying the top 20% of eligible stocks within their respective universes, ranked by overall quality scores. Index constituents are then weighted based on the product of their market capitalization and quality scores, while adhering to specific constraints.3

Performance Attribution

In Exhibit 4, the S&P 500 Quality Index’s YTD performance is broken down into three components: ROE, BSA and FLR attributions.4 ROE contributed the most to the outperformance, followed by BSA.

Performance in Different Macroeconomic Conditions5

Exhibit 5 shows the performance of the S&P 500 Quality Index in different macroeconomic conditions. Historically, the index had comparable performance to the S&P 500 in rising growth regimes while delivering outperformance in slowing growth regimes.

Conclusion

The S&P 500 Quality Index has demonstrated historical resilience and defensive characteristics during times of market volatility and economic uncertainty. By selecting high quality companies with strong profitability, superior earnings quality and robust financial strength, the index not only outperformed the broader S&P 500 but also provided lower volatility in both the short and long term.

1   The market is defined as the monthly performance of the underlying benchmark from Dec. 31, 1994, to March 31, 2025.

2   For more information, see Richardson, Scott Anthony, Sloan, Richard G., Soliman, Mark T. and Tuna, Ayse Irem, “Accrual Reliability, Earnings Persistence and Stock Prices,” Journal of Accounting & Economics, Vol. 39, No. 3, September 2005.

3   For further information about the factor definition, factor score calculation and index design, please see the S&P Quality Indices Methodology.

4   S&P 500 Quality BSA Attribution: Securities in the eligible universe are selected for index inclusion based on their accruals ratio z-score determined during the semiannual rebalancing of the S&P 500 Quality Index. The values for all securities are ranked in ascending order.

S&P 500 Quality Leverage Attribution: Securities in the eligible universe are selected for index inclusion based on their financial leverage ratio z-score determined during the semiannual rebalancing of the S&P 500 Quality Index. The values for all securities are ranked in ascending order.

S&P 500 Quality ROE Attribution: Securities in the eligible universe are selected for index inclusion based on their return-on-equity z-score determined during the semiannual rebalancing of the S&P 500 Quality Index. The values for all securities are ranked in ascending order.

5   Hao, Wenli Bill and Watts, Rupert, “A Historical Perspective on Factor Index Performance across Macroeconomic Cycles,” S&P Dow Jones Indices LLC, Nov. 14, 2024.

The posts on this blog are opinions, not advice. Please read our Disclaimers.

Stock Pickers: Lights, Camera, Anticlimax?

Contributor Image
Anu Ganti

Head of U.S. Index Investment Strategy

S&P Dow Jones Indices

U.S. equities have been whipsawed by tariff fears in the past couple of months, and particularly over the past week, with sharp double-digit swings for the S&P 500®. The index’s slide into correction territory has coincided with a rise in implied volatility, with VIX® rising briefly above the 50-point handle. In environments characterized by both market declines and high volatility, we typically hear that active management can have an advantage over index funds.

While the current macro environment is unusual, to say the least, we can look to history for a better understanding of active manager performance trends. We start by analyzing the 24-year history of our SPIVA® U.S. Scorecard, where we measure the performance of active managers versus their appropriate benchmarks. Exhibit 1 shows that 5 out of these 24 years were characterized by market declines. Notably, all five years coincided with majority underperformance for large-cap funds, ranging from 51% in 2022 to 68% in 2002.

But how has the performance of active managers during market declines compared relative to their performance during market gains? A simple way to analyze the conditions for stock selection is to measure the percentage of constituents that beat the benchmark. Exhibit 2 illustrates that, on average, 56% of member stocks beat The 500™ during the five years when the index declined, outpacing the 46% during the 19 years when the market posted gains. This makes sense, as down markets can provide an easier hurdle for stocks to beat.

Despite this advantage, 61% of large-cap funds underperformed The 500 during down markets, only slightly better than the 65% underperformance during up markets and the 64% average across all 24 years.

As well as market downturns, the other potentially advantageous element for active managers to examine is the rise in volatility and specifically dispersion, which measures how differently stocks are performing relative to each other. The value of stock-selection skill rises when dispersion is high, which could mean greater opportunities for stock pickers to outperform.

In Exhibit 3, we divided the years in our SPIVA database into low and high dispersion periods, defined as when the benchmark S&P 500’s dispersion was below the historical 25th percentile and above the 75th percentile, respectively. As expected, large-cap managers generally fared better in high dispersion periods, with 56% underperforming the S&P 500, lower than the 67% during low dispersion periods. Still, high dispersion regimes were characterized by majority underperformance.

In addition to analyzing historical dispersion environments, we can also look to implied dispersion to understand the potential for future opportunities for stock selection. We observe in Exhibit 4 that the Cboe S&P 500 Dispersion Index (DSPX), which uses listed options to measures the expectations for dispersion over the next 30 calendar days, reached an all-time live high of 46.5 on April 10, 2025, and is currently just below the 40-point handle. This level means that the market expects that the spread of annualized S&P 500 stock returns will have a standard deviation of close to 40% next month, which could signify plentiful future potential prospects for active stock selection.

History tells us that although active managers tended to fare better during market declines and high dispersion periods, majority underperformance prevailed regardless of market conditions. The future dispersion environment may be fortuitous, but the question of the hour is whether stock pickers will be able to shine during these unique circumstances. Thanks to our SPIVA Scorecards, we will be watching.

The posts on this blog are opinions, not advice. Please read our Disclaimers.

Turning the Tide: Global Markets Outperforming U.S. Equities

Contributor Image
Diego Zurita

Analyst, Global Equities & Thematics

S&P Dow Jones Indices

Since 2000, annual returns of international equities have been better than those of the U.S. only nine times, as shown by Exhibit 1. After the Global Financial Crisis of 2009, the S&P United States LargeMidCap outperformed the S&P World-Ex-U.S. Index in most years.

However, for the first time since 2017, developed market equities have ended the first quarter outperforming the U.S. As concerns grow about the impact of tariffs on the economy and uncertainty looms, market participants appear to be reducing their weight in the U.S. In fact, as illustrated by Exhibit 2, the S&P World Ex-U.S. Index had one of its best first quarters in recent times, while the S&P United States LargeMidCap started in the red. A strong start to the year is not always a definitive predictor of year-end performance, but what might this data suggest about the S&P World Ex-U.S. Index’s current outperformance?

The first quarter of the year was marked by uncertainty caused by geopolitical and economic developments. Tariff threats from the new U.S. administration, talks to end the war in Ukraine, shifting diplomatic relations, political changes in Germany and Canada, and reignited tensions in the Middle East were all part of a challenging beginning of the year. On the monetary front, central banks across the globe may diverge in their decisions around interest rates, but they are expected to proceed with caution due to inflation and recession concerns.

As of end of March, almost all European countries that constitute the S&P World Index started on a positive note. Germany, the U.K., France and Switzerland have been the main contributors to the outperformance of the S&P World Ex-U.S. Index. In contrast, the S&P United States LargeMidCap was among the worst performers in developed markets, decreasing 4.5%.

Among the GICS® sectors in the S&P World Ex-U.S. Index, which mostly had positive performance, there is one that stands out: Financials. The S&P World Ex-U.S. Financials (Sector) Index rose 12.2% in Q1 2025. This sector has been the main driver behind the outperformance of the S&P World Ex-U.S. Index, contributing to almost half of its increase (46%). This growth may possibly be attributed to positive economic surprises, resilience in European bank earnings and the effects on the economy of a potential end to the war in Ukraine.

Additionally, the Industrials sector, which gained 6.1%, has been an important contributor to the performance of the S&P World Ex-U.S. Index, as defense spending is expected to increase. Utilities and Energy were also among the best-performing sectors of the first quarter, as the European Commission launched a plan that aims to increase investments that contribute to energy security in the region.

Amid geopolitical tensions and evolving trade policies, international equities from developed markets in 2025 have outperformed the U.S. YTD, as some market participants are turning their focus to other geographies. Given the recent economic landscape in the U.S. and around the world, the S&P World Ex-U.S. Index is a relevant benchmark for the current market environment.

The posts on this blog are opinions, not advice. Please read our Disclaimers.

The Market Measure: April 2025

How did S&P DJI’s indices perform in Q1? Why is Low Volatility attracting interest, and what else is navigating the trade trends successfully? Explore the highlights.

The posts on this blog are opinions, not advice. Please read our Disclaimers.

Expectations and Anomalies

Contributor Image
Joseph Nelesen

Head of Specialists, Index Investment Strategy

S&P Dow Jones Indices

At one point deep into the Global Financial Crisis of 2008, I remember a clever colleague declaring “less down is the new up.” He wasn’t alone in this point of view, since in a world with so many markets and indices falling in unison, those that performed relatively better justifiably gained attention. One of those standouts at the time was the S&P 500® Low Volatility Index (“Low Vol”).

Nearly two decades have passed since then, and Low Vol has continued to stand out during downturns, including 2025’s market swoon, as shown in Exhibit 1.

This isn’t unusual; Low Vol has a track record of losing less, while still participating in upside, in a pattern often referred to as the “low volatility anomaly.” Researchers call this factor’s performance an anomaly since it defies conventional economic theory about the positive relationship between return and risk. Explanations for this breakdown in the risk/return relationship center around mispricing (more precisely, underpricing) of lower-risk stocks and overpricing of higher-risk stocks due to a mix of behavioral, structural and economic drivers.

By design, the Low Vol index has historically delivered less risk than the S&P 500, with an annualized volatility of 11.6% compared to 15.3% for The 500™ and a lower beta (0.7) over the 25 years ending March 2025. Lower volatility and beta come from capturing less of the ups and downs of market movers, but in the case of Low Vol, this rate of capture is not symmetrical. Looking again at the 25-year period ending in March 2025, we calculated monthly upside and downside capture ratios for Low Vol relative to The 500, as shown in Exhibit 2.1

The observed upside and downside capture characteristics of Low Vol have played out in real time to various degrees of magnitude through expansions and downturns over the last 25 years. In recent months, the factor has appeared to show relative resilience once again, as illustrated by Exhibit 3’s chart showing rolling one-year excess performance versus The 500.

It is clear from Exhibit 3 that the recent performance differential between Low Vol and The 500, while noteworthy, is not without precedent and indeed has been surpassed during previous crises. Suffering less downside, on average, than the S&P 500, but participating slightly more during rebounds, repeated again and again, has historically led to a widening margin of cumulative outperformance for Low Vol versus The 500 over the last 25 years, as shown in Exhibit 4. On an annualized basis, the S&P 500 Low Volatility Index rose 9.9% per year compared to 7.0% for The 500.

Measures of risk, rolling performance and average upside/downside capture shed light on the persistent characteristics of S&P 500 Low Volatility Index, but viewing them together tells a longer-term story about the anomalous power of a defensive stance historically.


1  Upside and downside capture ratios are based on monthly performance of the S&P 500 Low Volatility Index relative to the S&P 500 from March 2000, to March 2025 and are capped at no more than 100% and no less than 0%.

The posts on this blog are opinions, not advice. Please read our Disclaimers.