Get Indexology® Blog updates via email.

In This List

Introducing the S&P Quality FCF Aristocrats Indices

Evaluating Private Markets with Benchmarks

The Impact of Sector Performance through the Years

How the Improvement of Sustainability Data Enables a More Robust S&P/BMV Total Mexico ESG Index

Analyzing the Impact of Sector Selection

Introducing the S&P Quality FCF Aristocrats Indices

Contributor Image
Elizabeth Bebb

Director, Factor & Dividend Indices

S&P Dow Jones Indices

The S&P Quality FCF Aristocrats® (Free Cash Flow Aristocrats) Indices measure companies that consistently generate robust FCF over many years. FCF, the cash remaining after a business covers its operational costs and capital investments, is crucial because it provides financial flexibility. Companies with high FCF can invest in growth opportunities, pay dividends and reduce debt, making them more resilient in fluctuating markets.

On Sept. 23, 2024, S&P Dow Jones Indices (S&P DJI) launched two indices in this new series: the S&P 500® Quality FCF Aristocrats Index and S&P Developed Quality FCF Aristocrats Index. In this blog, we will introduce these indices by reviewing their methodology and historical performance.

Methodology Overview

These indices track companies that have a minimum of 10 consecutive years of positive FCF, along with a high FCF margin and FCF return on invested capital (ROIC). FCF margin measures how efficiently revenue is converted into FCF, while FCF ROIC measures how efficiently invested capital is utilized to generate FCF.

By concentrating on firms that excel in long-term FCF generation, this methodology aims to include only the highest-quality companies. Additionally, by prioritizing consistent and efficient FCF generation, this approach distinguishes itself from other FCF-based indices in the market, which tend to be yield-focused and exhibit a strong value tilt.

Performance Insights

When looking at back-tested historical performance, these indices outperformed their regional benchmarks, delivering higher risk-adjusted returns and lower losses during market downturns. They provided a defensive investment strategy that balanced growth potential with stability, visible through their reduced volatility and lower downside capture ratios.

Factor Tilts in S&P Quality FCF Aristocrats Indices

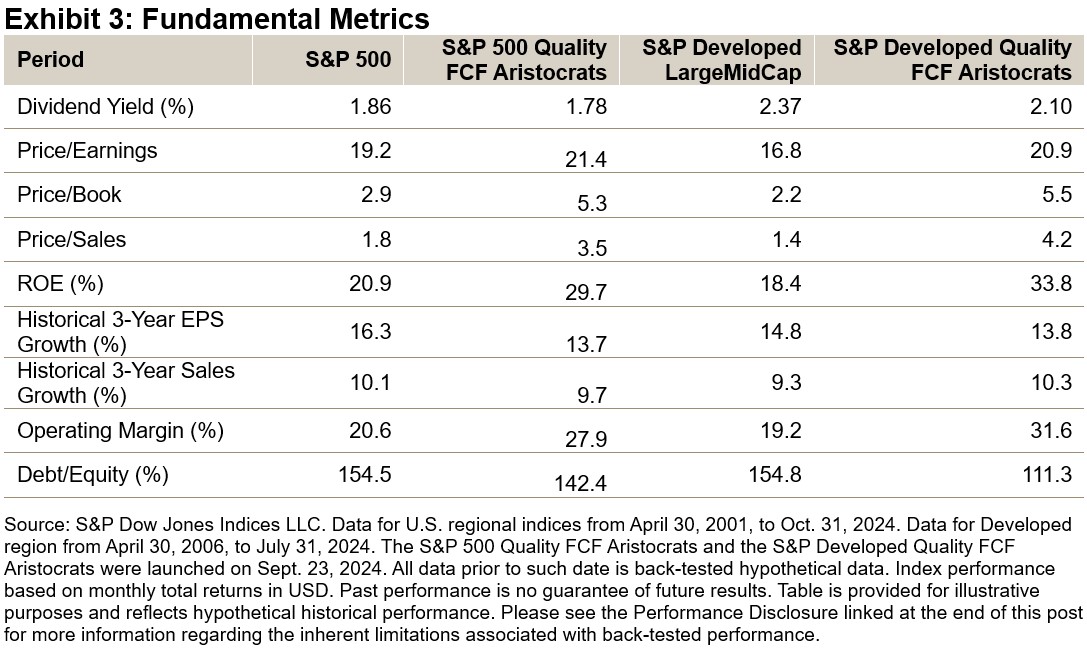
The S&P Quality FCF Aristocrats Indices primarily emphasize quality, including companies that typically exhibit high and consistent FCF generation. Additionally, these indices tilt toward growth since these companies can allocate excess FCF to research & development, advertising and marketing.

As Exhibit 3 shows, this approach has historically resulted in improved return on equity (ROE) and operating margins compared to their benchmark indices, showcasing a balanced strategy that prioritizes both quality and growth.

The regional S&P Quality FCF Aristocrats Indices offer a high quality, defensive approach, demonstrating outperformance versus their benchmarks with higher risk-adjusted returns and lower downside capture in falling markets, while matching the benchmark returns in rising markets over the back-tested period. Stay tuned for an upcoming blog, where we will compare the S&P Quality FCF Aristocrats Indices with the S&P Dividend Aristocrats® Indices.

The posts on this blog are opinions, not advice. Please read our Disclaimers.

Evaluating Private Markets with Benchmarks

Contributor Image
Nicholas Godec

Senior Director,​ Head of Fixed Income Tradables & Commodities

S&P Dow Jones Indices

Collectively, private markets make up one of the fastest-growing market segments, but they have historically been characterized by opacity and inaccessibility. This is changing, thanks in part to evolving private market benchmarks that focus on strategy-specific performance. In our first blog, we summarized the performance of a collection of private market benchmarks.

In this blog, we explore the important role Cambridge Associates benchmarks may play moving forward and highlight how the right data can bolster private market benchmarks.

Benchmarking Private Markets

For 50 years, Cambridge Associates has provided performance evaluation tools and detailed insights for investors navigating the complex landscape of private investments. Today, its platform tracks over 10,000 private investment funds and the firm remains a critical proponent and advisor in the private market landscape. Cambridge Associates benchmarks deliver robust and data-driven insights derived from deep expertise and engagement with private market participants to help investors identify opportunities, manage risks and drive portfolio performance.

S&P Dow Jones Indices supports clients, in collaboration with Cambridge Associates, by providing private market solutions for investors with dynamic, fit-for-purpose benchmarks in an ever-changing market.

Data Sourcing Is Key

Accurate benchmarking for private investments requires a diligent process and access to a “golden source” of performance data. In private markets, that golden source is fund financial statements. Cambridge Associates sources its data directly from private investment fund managers who contribute anonymously across strategies and geographies. Contributing managers are screened to ensure the data is of institutional quality.

The result is a private investment benchmarking universe that is both broad and granular, reflecting the diverse opportunity set in private markets. Benchmarks are organized into four main strategies: Private Equity, Venture Capital, Private Credit and Real Assets, plus aggregated benchmarks that blend Private Equity and Venture Capital.

Sub-strategies include Buyouts, Growth Equity, Subordinated Capital, Distressed Debt, Infrastructure, Real Estate, Secondaries and Fund of Funds, and can be broken down further by geography, size or sector.

Benchmarking in 3D

Because of private markets’ unique performance drivers, Cambridge Associates advocates using multiple metrics to evaluate them. While internal rate of return (IRR) is the predominant measure of performance of private investments, Cambridge Associates encourages investors and managers to evaluate IRRs in conjunction with multiples, performance breakpoints, vintage year returns and public market equivalents for a wider lens of performance evaluation.

For example, an investor evaluating a manager may use quartile breakpoints to rank their investments in terms of IRR and multiples against a sample of the strategy funds from the same vintage year. Or they may wish to use a public market equivalent (PME) analysis, which essentially addresses the question: what would my return look like if I invested capital in a given public market (e.g., the S&P 500) with the exact timing of private market cash flows?

Key Takeaways and the Path Ahead

As the private markets industry evolves, several trends are taking shape:

  • Continued expansion of assets under management in private markets underscores the need for sophisticated and comprehensive benchmarking tools.
  • Enhanced transparency through more sophisticated benchmarks, data and tools could be crucial for investors seeking to navigate these complex markets.
  • Growing demand from individual investors who have increasing access to private market strategies.

The role of Cambridge Associates benchmarks could become increasingly critical, with more investors seeking custom benchmark solutions to support performance measurement, fund manager selection or fund due diligence.  As we progress, the insights derived from Cambridge Associates benchmarks will help navigate the dynamic and complex private market environment, assisting investors to be well equipped to handle emerging opportunities.

Learn more in our recent analysis, “2023 Private Markets Review: Cambridge Associates Benchmarks versus Public Indices.”


Learn more about Private Investment Benchmarks

Ask an Expert

This blog was co-authored by Ricky LaBelle, Nicholas Godec, and Greg Vadala.


The posts on this blog are opinions, not advice. Please read our Disclaimers.

The Impact of Sector Performance through the Years

What can we learn by looking at the historical performance of sectors? Join S&P DJI’s Tim Edwards and Joe Nelesen for a closer look at how the distinct risk/return profiles of individual sectors may influence their performance during different market regimes.

The posts on this blog are opinions, not advice. Please read our Disclaimers.

How the Improvement of Sustainability Data Enables a More Robust S&P/BMV Total Mexico ESG Index

Contributor Image
Aran Spivey

Senior Analyst, Global Exchange Indices

S&P Dow Jones Indices

In partnership with Bolsa Mexicana de Valores (BMV Group), S&P Dow Jones Indices (S&P DJI) launched the S&P/BMV Total Mexico ESG Index in June 2020, providing investors an opportunity to express their views on Mexican equities with a sustainability lens. The index is designed to measure the performance of stocks within the S&P/BMV Total Mexico Index that meet sustainability criteria, and it applies exclusions based on business activities and United Nations Global Compact (UNGC) scores. Importantly, constituents are weighted by S&P Global ESG Score.

Based on S&P Global’s Corporate Sustainability Assessment (CSA), the S&P Global ESG Scores are designed to measure environmental, social and governance (ESG) risk and performance factors for corporations, with a focus on financial materiality. In recent years, the CSA has been shown support by improved disclosures from Mexican companies. As shown in Exhibit 1, there was a 56% increase in survey respondents for companies headquartered in Mexico since 2019.

Moreover, the metrics measured by S&P Global Sustainable1 as part of this ESG scoring approach align with important global standards, including, for example, the recently launched Mexican Sustainable Taxonomy,1 which seeks to classify activities that support a number of environmental and societal goals. Some of these specific corporate reporting expectations, and how they are captured by the CSA, are outlined in Exhibit 2. As part of this improvement in overall disclosure, it is possible to identify improvements in criteria-level ESG performance. First, data has improved in terms of the types of data we are able to use; for example, on issues such as waste and water. Second, corporate performance has improved since 2019 across a number of criteria such as labor practices or climate strategy.

The S&P/BMV Total Mexico ESG Index, which relies on the S&P Global ESG Scores, provides a measure of Mexican equities with an ESG lens. In looking at past performance of the index, when compared to its benchmark (the S&P/BMV Total Mexico Index), it exhibited a similar risk/return profile, and in recent years it has even shown some outperformance of the benchmark.

Given the improvements of ESG disclosures, the S&P/BMV Total Mexico ESG Index is being powered by continuously improving ESG data, taking into account material risks and opportunities for Mexican equities. Those investors looking for a measure of Mexico’s broad equities market that integrates sustainability factors may be interested to see a historically similar risk/return profile when compared to its benchmark.

1 For more information, see here: Taxonomía Sostenible de México | Secretaría de Hacienda y Crédito Público | Gobierno | gob.mx (www.gob.mx) (Spanish)

The posts on this blog are opinions, not advice. Please read our Disclaimers.

Analyzing the Impact of Sector Selection

How can a sectoral lens help to define equity markets? S&P DJI’s Tim Edwards and Joe Nelesen take a closer look at sectors’ strategic and tactical applications, as well as how sectors and sub-industry classifications have evolved over time.

The posts on this blog are opinions, not advice. Please read our Disclaimers.