


What can we learn by looking at the historical performance of sectors? Join S&P DJI’s Tim Edwards and Joe Nelesen for a closer look at how the distinct risk/return profiles of individual sectors may influence their performance during different market regimes.
The posts on this blog are opinions, not advice. Please read our Disclaimers.The Impact of Sector Performance through the Years
How the Improvement of Sustainability Data Enables a More Robust S&P/BMV Total Mexico ESG Index
Analyzing the Impact of Sector Selection
The S&P 500 Top 20 Select Indices: A Deep Dive into Mega-Cap Performance
2023 Performance of Private Markets Benchmarks: A Mixed Bag
The Impact of Sector Performance through the Years
How the Improvement of Sustainability Data Enables a More Robust S&P/BMV Total Mexico ESG Index

In partnership with Bolsa Mexicana de Valores (BMV Group), S&P Dow Jones Indices (S&P DJI) launched the S&P/BMV Total Mexico ESG Index in June 2020, providing investors an opportunity to express their views on Mexican equities with a sustainability lens. The index is designed to measure the performance of stocks within the S&P/BMV Total Mexico Index that meet sustainability criteria, and it applies exclusions based on business activities and United Nations Global Compact (UNGC) scores. Importantly, constituents are weighted by S&P Global ESG Score.
Based on S&P Global’s Corporate Sustainability Assessment (CSA), the S&P Global ESG Scores are designed to measure environmental, social and governance (ESG) risk and performance factors for corporations, with a focus on financial materiality. In recent years, the CSA has been shown support by improved disclosures from Mexican companies. As shown in Exhibit 1, there was a 56% increase in survey respondents for companies headquartered in Mexico since 2019.

Moreover, the metrics measured by S&P Global Sustainable1 as part of this ESG scoring approach align with important global standards, including, for example, the recently launched Mexican Sustainable Taxonomy,1 which seeks to classify activities that support a number of environmental and societal goals. Some of these specific corporate reporting expectations, and how they are captured by the CSA, are outlined in Exhibit 2. As part of this improvement in overall disclosure, it is possible to identify improvements in criteria-level ESG performance. First, data has improved in terms of the types of data we are able to use; for example, on issues such as waste and water. Second, corporate performance has improved since 2019 across a number of criteria such as labor practices or climate strategy.

The S&P/BMV Total Mexico ESG Index, which relies on the S&P Global ESG Scores, provides a measure of Mexican equities with an ESG lens. In looking at past performance of the index, when compared to its benchmark (the S&P/BMV Total Mexico Index), it exhibited a similar risk/return profile, and in recent years it has even shown some outperformance of the benchmark.

Given the improvements of ESG disclosures, the S&P/BMV Total Mexico ESG Index is being powered by continuously improving ESG data, taking into account material risks and opportunities for Mexican equities. Those investors looking for a measure of Mexico’s broad equities market that integrates sustainability factors may be interested to see a historically similar risk/return profile when compared to its benchmark.
1 For more information, see here: Taxonomía Sostenible de México | Secretaría de Hacienda y Crédito Público | Gobierno | gob.mx (www.gob.mx) (Spanish)
The posts on this blog are opinions, not advice. Please read our Disclaimers.Analyzing the Impact of Sector Selection
How can a sectoral lens help to define equity markets? S&P DJI’s Tim Edwards and Joe Nelesen take a closer look at sectors’ strategic and tactical applications, as well as how sectors and sub-industry classifications have evolved over time.
The posts on this blog are opinions, not advice. Please read our Disclaimers.The S&P 500 Top 20 Select Indices: A Deep Dive into Mega-Cap Performance

In the first part of this blog series, we introduced the S&P 500® Top 20 Select Indices, including their construction and relevance to the equity market. Now, let’s delve deeper into the indices’ historical performance and relative performance to other similar indices.
Perhaps unsurprisingly, the S&P 500 Top 20 Select Indices all had similar cumulative returns, as only a handful of mega-cap stocks would have exceeded the capping thresholds historically. Although these indices trailed the S&P 500 for a period after the 2008 Global Financial Crisis, their outperformance after the COVID-19 pandemic reflected the overweighting in the Information Technology sector (see Exhibit 1).

Exhibit 2 depicts an interesting picture when currency is taken into consideration. Over the past decade, one of the drivers of performance of the S&P 500 Top 20 Select 35/20 Capped Index (GBP) has been the depreciation of the British pound sterling against the U.S. dollar post-Brexit. Similarly, the S&P 500 Top 20 Select Index (TTM) (JPY) saw a boost in performance at the end of 2022, likely a reaction to the widening interest rate differentials between the U.S. and Japan that put the Japanese yen under pressure.

Some similar mega-cap index offerings, such as the S&P 500 Top 10 Index, the S&P 500 Top 20 Index and the S&P 500 Top 50 Index, use float-market cap (FMC) weighting with annual reconstitution. While performance may improve when the largest companies have higher weights in FMC indices, this can amplify concentration. By introducing capping mechanisms, the S&P 500 Top 20 Select Index Series helps increase diversification and reduce concentration risks.
Two examples illustrate how the different capping mechanisms between the S&P 500 Top 20 Index and S&P 500 Top 20 Select Index affect sector weights (see Exhibit 3).
- The 4.2% weight difference in Communication Services was primarily driven by Alphabet A and Alphabet C. Their FMC weights were 4.6% and 3.8%, respectively, as of Oct. 31, 2024. However, since they are share classes of the same company, their combined weight is capped at 4.5% at rebalancing for the S&P 500 Top 20 Select Index Series.1
- In the single stock scenario, Amazon’s weight was capped from its original 8% level, contributing to a 2.4% weight difference in Consumer Discretionary.

As shown in Exhibit 4, the S&P 500 Top 20 Select Index outperformed the S&P 500 over the back-tested period, highlighting that the selection of the largest 20 companies has historically retained the top performers in the S&P 500. While the capping mechanism limits the extent of outperformance compared to the S&P 500 Top 20 Index, the S&P 500 Top 20 Select Index has historically had lower annualized volatility. As a result, the S&P 500 Top 20 Select Index has been able to post higher risk-adjusted returns with lower concentration risk.

Conclusion
The S&P 500 Top 20 Select Index Series offers a focused measurement of mega-cap stocks, addressing the demand for an index that tracks the largest and most influential companies in the U.S. equity market. By providing options with different capping mechanisms and currency offerings, the series provides a variety of index strategies that adapt to market dynamics around leading sectors and companies.
1 For more information on the multiple share classes treatment, please refer to the Multiple Share Classes section and the respective index methodology sections of S&P U.S. Indices Methodology.
The posts on this blog are opinions, not advice. Please read our Disclaimers.
2023 Performance of Private Markets Benchmarks: A Mixed Bag

In this blog, we summarize annual returns for a collection of private market benchmarks and frame recent performance against that of public market benchmarks.1
Private Equity and Venture Capital
Venture Capital faced severe headwinds relative to Private Equity in 2023. Through the first three quarters, Venture Capital funds from the U.S., Europe and Asia/Pacific largely showed negative performance, but U.S. and Europe Developed funds found positive territory in Q4, while Asia/Pacific remained in the red. On the flip side, all major geographic Private Equity strategies were positive for the year, with U.S. funds returning four positive quarters, and Europe Developed and Asia/Pacific funds negative only in Q3.
Outside the U.S., both Emerging and Developed Markets Private Equity and Venture Capital funds were positive for the year, with Developed Markets outperforming Emerging by nearly 600 bps.

Taking a look back at Private Equity’s historical performance relative to Venture Capital and the S&P 500® (see Exhibit 2), we see consistent outperformance until around 2015, when U.S. Private Equity started to outperform the S&P 500 by a wider margin than U.S. Venture Capital. In addition, it is interesting to note that the combined index—U.S. Private Equity and Venture Capital—tracked closer to U.S. Private Equity, showing that the dollar weight of the U.S. Private Equity index was greater, and Private Equity activity was more influential in the combined index’s return.

Private Credit and Real Estate
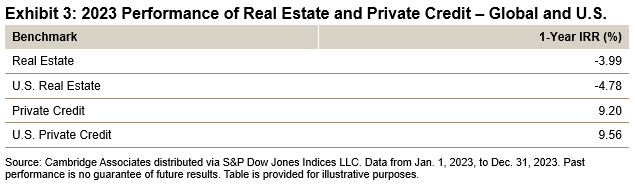
The “golden age” of Private Credit continued in 2023, with global and U.S.-focused Private Credit funds showing consistent, positive performance in each quarter and for the year (see Exhibit 3). The major sub-strategies—Senior Debt (i.e., direct lending), Subordinated Capital (i.e., mezzanine) and Credit Opportunities—drove returns.
On the other hand, Real Estate funds experienced trouble to start the year and declined further in Q3 and Q4. Among the main property types (office, retail, residential/multi-family), retail-focused was the only strategy to achieve a positive 2023 return (about 5%), while office-focused was the major detractor.
Looking at global and U.S. Private Credit over time, we see a recent marginal pickup in performance of global Private Credit, showing that a switch from investing strictly in U.S. Private Credit to a more diversified, global approach did not greatly impact returns (see Exhibit 4).
Although the two indices tracked closely, Private Credit funds experienced sharper increases relative to public credit—the iBoxx USD Liquid High Yield Index—especially during periods of market stress (specifically, the COVID-19 pandemic). While the corporate bond market slowly recovered, the private credit market picked up at higher multiples relative to the public market.
Given the higher returns seen in the private credit market relative to the public market, presumably due to the incremental liquidity premium, it will be interesting to see the impact on these trends of further anticipated interest rate cuts in late 2024 and early 2025.

Takeaways
2023 was a dynamic year for private market benchmarks, characterized by varied results across asset classes and sub-strategies. Private Equity performed well, consistent with its recent performance relative to public equities, while Venture Capital faced significant challenges. Private Credit continues to demonstrate steady positive returns, standing in stark contrast to the difficulties faced by Real Estate, especially office-focused funds.
Learn more in our recent analysis, “2023 Private Markets Review: Cambridge Associates Benchmarks versus Public Indices.”
Don’t miss our next blog where we explore the important role Cambridge Associates benchmarks may play moving forward and highlight how the right data can bolster private market benchmarks.
Learn more about Private Investment Benchmarks
This blog was co-authored by Ricky LaBelle, Nicholas Godec, and Greg Vadala.
1 Performance data is from Cambridge Associates via S&P Dow Jones Indices LLC.
The posts on this blog are opinions, not advice. Please read our Disclaimers.