Get Indexology® Blog updates via email.

In This List

Maintaining Low Tracking Error: The Construction of the S&P 500 ESG Index

Explaining Changes to Select Sector Indices

Sector Neutrality – An Essential Mechanism within the S&P 500 ESG Index

Three-Year Live Performance Review of the S&P QVM Top 90% Indices

The Rise of Passive Investing with Indices

Maintaining Low Tracking Error: The Construction of the S&P 500 ESG Index

Contributor Image
Maria Sanchez

Director, Sustainability Index Product Management, U.S. Equity Indices

S&P Dow Jones Indices

When it comes to integrating environmental, social and governance (ESG) factors into investment strategies, market participants may be interested in deviations from the benchmark. Tracking error is a widely used metric that helps measure the size of these deviations. Improving the ESG profile of a composition often means accepting a higher tracking error due to screening or selection processes. Investors typically seek ESG indices that offer similar risk/performance profiles to traditional benchmarks.

It is important to note that for the S&P 500® ESG Index there is no guarantee of a specific level of tracking error, as that is not a target in the optimization process. This is a consequence of the index construction, which maintains similar sector and industry weights as the benchmark without drastically altering the composition’s risk profile. As a result, it has historically maintained relatively low tracking error, with the index consistently mirroring the benchmark.

The S&P 500 ESG Index reduces deviations from the S&P 500 through its methodology.1

  • Objective: The S&P 500 ESG Index measures the performance of securities from the S&P 500 that meet sustainability criteria and maintains similar overall industry group weights as the underlying index.
  • Construction: It applies sustainability eligibility criteria then uses S&P Global ESG Scores to select constituents. It targets 75% of the market cap within each industry group and chooses the top ESG performers, seeking sector neutrality.2

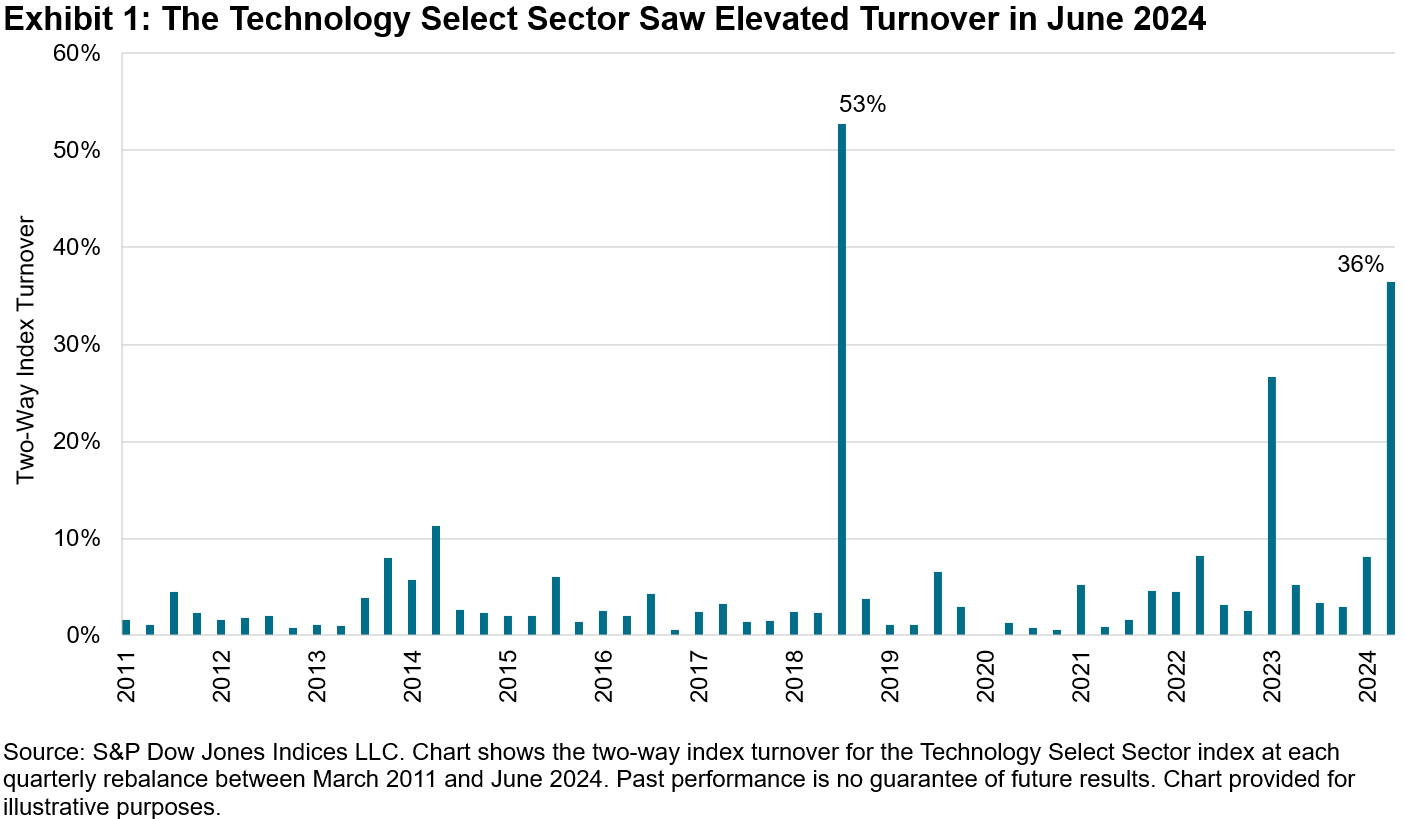
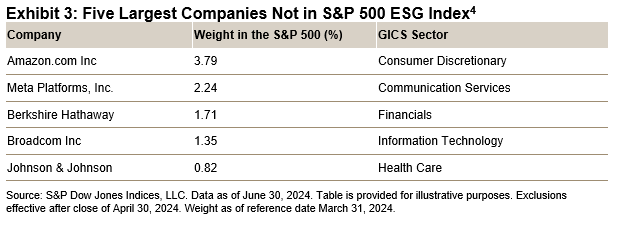
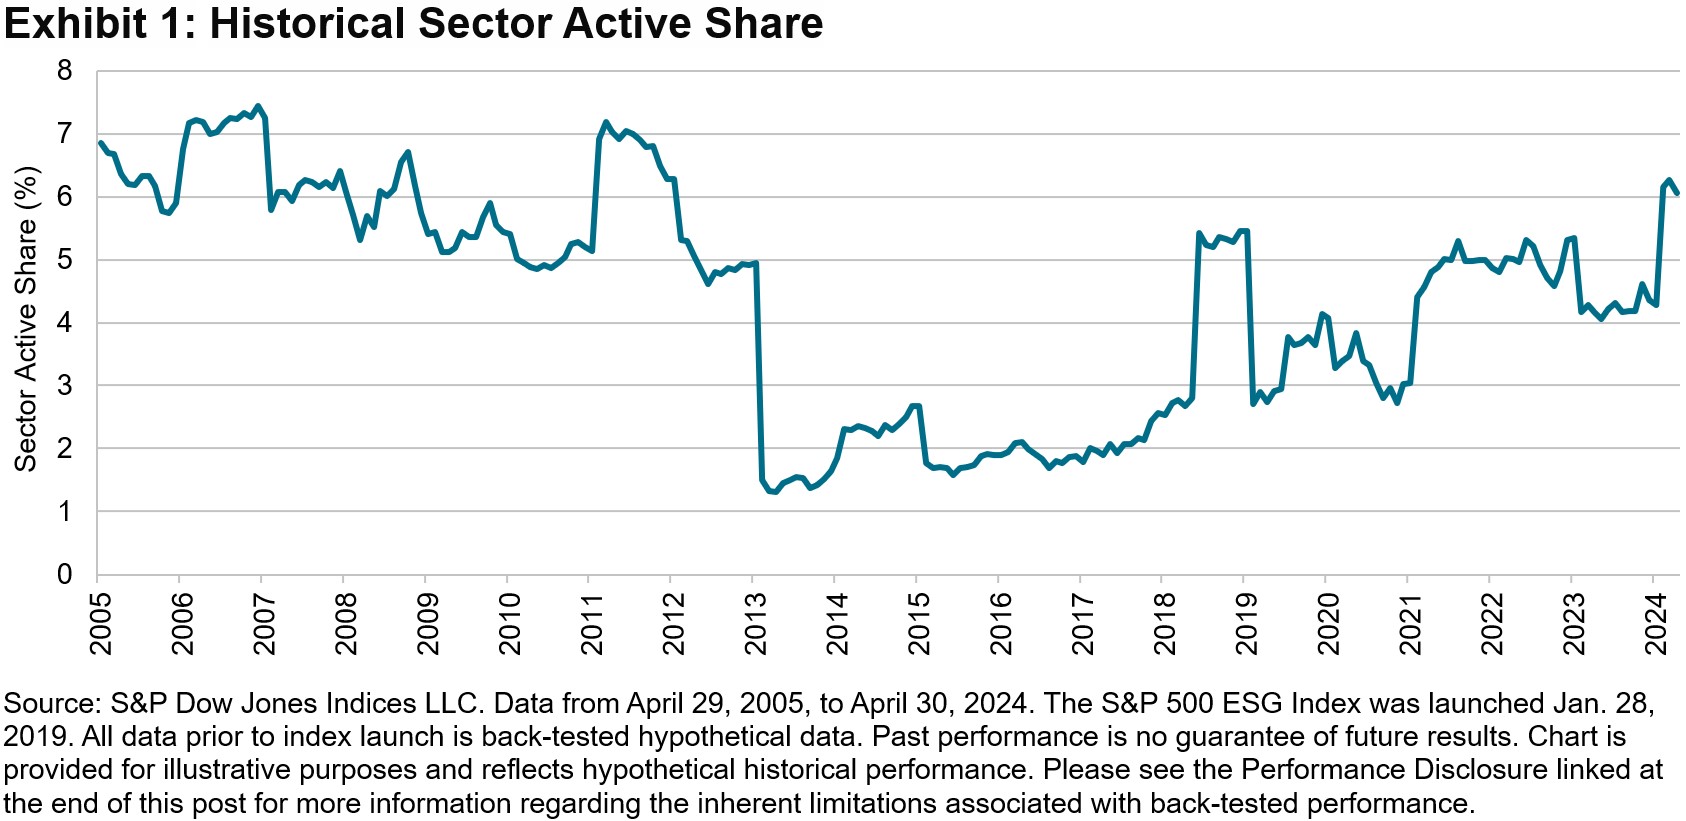
While there may be some deviations from the underlying index due to screening and selection based on criteria such as certain business involvement with specific thresholds, violations to global standards such as the United Nations Global Compact (UNGC), and low ESG scores, the S&P 500 ESG Index  demonstrated a low sector active share3 of 4.2% on average from its launch on Jan. 28, 2019, to April 30, 2024. This implementation of the methodology helps ensure consistent tracking of the benchmark (see Exhibit 1).

Tracking error measures the size of the index performance differential over a certain period. In other words, it is the annualized standard deviation of the difference between the performance of the S&P 500 ESG Index and the S&P 500 over a period. Tracking error is an important metric for market participants, as it can indicate whether they are obtaining the desired market exposure.

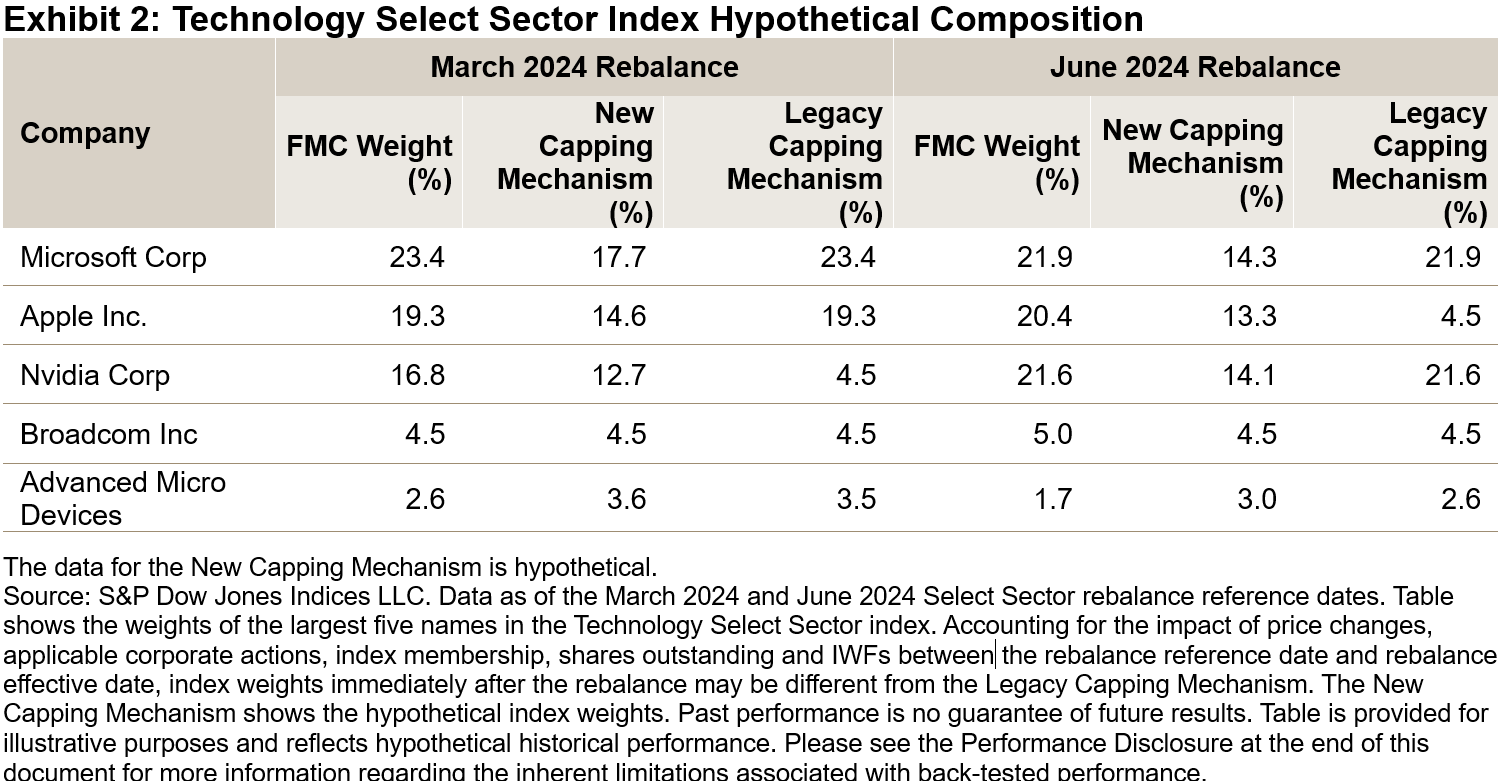
The S&P 500 ESG Index has historically achieved comparable performance to the S&P 500, thanks to its similar industry group weights. As of April 30, 2024, the annualized tracking error for the 3-year period was 1.399% (see Exhibit 2), demonstrating a relatively low deviation.

To review how this metric has evolved over time, Exhibit 3 shows that the 3-year tracking error of the S&P 500 ESG Index compared to the S&P 500 has consistently remained below 2%, indicating relatively low deviation.4

S&P Dow Jones Indices offers a range of indices that consider different levels of integration of ESG factors to reflect a wide range of investment needs. These include the S&P 500 ESG Leaders Index and the S&P 500 ESG Elite Index. Typically, the stricter the sustainability criteria are, the higher the expected tracking error.

Conclusion

The S&P 500 ESG Index’s construction maintains similar sector and industry weights as the benchmark, allowing the integration of ESG scores while maintaining similar sector exposures, which has resulted in a relatively low tracking error, even without using an optimizer. Join us in celebrating the five-year anniversary of the S&P 500 ESG Index and learn more about this flagship index.

1 For more information, please see the S&P ESG Index Series Methodology.

2 For more information, please see Rowton, Stephanie, “Sector Neutrality: An Essential Mechanism within the S&P 500 ESG Index,” S&P Dow Jones Indices LLC, Sept. 9, 2024.

3 Sector active share is a specific application of the broader concept of active share, which measures the degree to which a portfolio’s sector allocations differ from those of its benchmark. It is calculated by taking the sum of the absolute differences between the portfolio and the benchmark’s sector weights, then dividing by two.

4 Low tracking error is typically less than 1%. This indicates that the composition closely follows the benchmark with minimal deviation. Medium tracking error is typically between 1% and 5%. High tracking error is typically greater than 5%. These ranges can vary depending on the specific context and investment strategy.

The posts on this blog are opinions, not advice. Please read our Disclaimers.

Explaining Changes to Select Sector Indices

Contributor Image
Hamish Preston

Head of U.S. Equities

S&P Dow Jones Indices

Launched in the late 1990s, the Select Sector® indices measure the performance of S&P 500® sectors; each S&P 500 company is assigned to one of the 11 Select Sector indices, based on the Global Industry Classification Standard (GICS®) framework. The indices serve as the basis for an ecosystem of financial products, which in turn allow market participants to express views.

S&P Dow Jones Indices (S&P DJI) recently announced changes to the Select Sector index methodology, which will go into effect prior to the open on Sept. 23, 2024. Here’s an overview of the upcoming changes to the quarterly rebalance process.

The Select Sector indices are capped market capitalization weighted.

A key feature of the Select Sector indices is that they employ a capping mechanism to ensure diversification among the companies within each index. The capping thresholds are intended to reflect certain diversification requirements imposed on regulated investment companies under the U.S. Internal Revenue Code and the Investment Company Act of 1940.1

At each quarterly rebalance, companies are initially weighted by float market capitalization (FMC). Modifications are made to these FMC weights if a) any company has a weight greater than 24%, or b) the sum of the companies with weights greater than 4.8% exceeds 50% of the total index weight. These rebalance thresholds are unchanged by the upcoming methodology changes that take effect on Sept. 23, 2024.

The quarterly capping process is changing.

If companies with FMC weights greater than 4.8%—“larger companies”—account for more than 50% of the index weight, the current capping mechanism reduces the weight of the smallest company in the group to 4.5%. The process is repeated iteratively, if necessary, until there are no breaches to the thresholds. Full details of the capping mechanism as of the publication date (the “Legacy Capping Mechanism”) can be found in the S&P U.S. Indices Methodology.

The new approach (the “New Capping Mechanism”) would handle such a breach differently: the aggregate weight of the larger companies will be reduced to 45% and the larger companies’ individual weights will be determined by their relative proportions, after checking for any breaches in the single company cap. The minimum index weight of each of the larger companies will be 4.5%. The recent announcement provides the full details.

Market dynamics have impacted Select Sector index composition in 2024.

The rationale for the change to the capping mechanism is that the impact of market dynamics could result in the Legacy Capping Mechanism causing “flip flops” in index weights. This was particularly evident in the Technology Select Sector index in 2024. For example, Microsoft, Apple and Nvidia each had FMC weights greater than 4.8% and their collective FMC weight exceeded 50% at the March 2024 reference date. As the smallest of the three companies at the time, Nvidia’s weight was reduced to 4.5%.2

A similar situation occurred in June 2024, except Nvidia had become the second largest of the group, reflecting investors’ expectations of the impact of AI on the company’s growth prospects. Accounting for changes between the rebalance reference date and rebalance effective date, Apple—as the smallest of the group—had its index weight reduced by 17% at the June rebalance, while Nvidia’s weight increased by 15% to around 21%. These changes meant that the index’s quarterly rebalance turnover in June was the highest since September 2018, when various companies moved to Communications Services as part of a GICS structure update.

The New Capping Mechanism better retains FMC proportions.

The New Capping Mechanism is designed to better retain FMC proportions among index constituents, while still being mindful of diversification thresholds. For example, Exhibit 2—taken from the impact analysis that was included in the public consultation—shows the hypothetical weights of several companies in the Technology Select Sector index under the New Capping Mechanism versus the Legacy Capping Mechanism as of the March and June 2024 rebalance reference dates. The application of the new approach would have reduced the potential for “flip flops” in index composition.

Although we will have to wait to see the exact composition of the Select Sector indices after the September rebalance, upcoming changes reflected in the New Capping Mechanism provide an example of how index methodologies can evolve in light of market dynamics.

1 For more information on the capping thresholds, please refer to the Regulatory Capping Requirements section of S&P Dow Jones Indices’ Equity Indices Policies & Practices Methodology.

2 Accounting for the impact of price changes, applicable corporate actions, index membership, shares outstanding and IWFs between the rebalance reference date and rebalance effective date, Nvidia’s index weight prior to the open on March 18, 2024, was 4.55%.

The posts on this blog are opinions, not advice. Please read our Disclaimers.

Sector Neutrality – An Essential Mechanism within the S&P 500 ESG Index

Contributor Image
Stephanie Rowton

Senior Director, Tokenization and U.S. Equities

S&P Dow Jones Indices

The S&P 500® ESG Index seeks to provide a measurement of U.S. equities while incorporating ESG factors.1 The index maintains similar industry weights to the S&P 500 while enhancing the index’s sustainability characteristics.

The Importance of Sector Neutrality within the S&P 500 ESG Index

A common misconception is that ESG indices remove or underweight sectors deemed environmentally unfriendly such as Energy or Utilities. Rather than excluding sectors, the S&P 500 ESG Index selects companies that perform highest when considering environmental, social and governance metrics, while historically reflecting many of the attributes of the S&P 500. Removing entire sectors may result in a shift in weight toward other sectors—potentially creating sector bias and concentration risk.

Using Information Technology as an example, one constituent was excluded as per the S&P ESG Indices methodology. It then selected constituents from each industry group within Information Technology, starting from constituents with the highest ESG scores, to reach 75% of the underlying index’s market cap. From this, 22 constituents were selected, meaning the index included only 33% of the initial stock count from the S&P 500’s Information Technology sector. Were the methodology to reallocate additional weight to Information Technology, it could have created concentration risk in the few selected constituents.

Achieving Sector Neutrality

The S&P 500 ESG Indices aim to achieve a broadly sector-neutral outcome by making ESG score exclusions on a relative basis within each GICS® industry group, rather than removing entire industry groups.2 Consequently, the success of the index is not solely measured through its performance, but rather by whether industry group weights (and, by extension, sector weights) remain similar to the S&P 500.

However, excluding companies based on ESG metrics will result in deviation from the underlying index. Some active share is therefore inevitable; while the sector active share is only 6.27%, illustrating broad sector neutrality, the index itself has an active share of 27.54%,3 driven by a disparity in holdings and weights with the S&P 500. The deviation between the S&P 500 ESG Index and the S&P 500 is particularly evident when a sector has several constituents removed or a company with a high float market cap (FMC) is excluded.

When considering Information Technology (see Exhibit 2), it is possible to conclude that active share was likely driven from a few constituents that were included in the S&P 500 ESG Index. Furthermore, Broadcom, with an FMC of 1.35%, was not selected for inclusion (see Exhibit 3). Whereas the removal of Amazon, with an FMC of 3.79%, is a likely driver for the deviation in the Consumer Discretionary sector.

Performance Attribution

Perhaps unsurprisingly, performance attribution primarily reveals the history of constituent selection rather than sector weighting (see Exhibit 4).5 This is partly because the index has historically been successful in maintaining similar sector weights to the S&P 500. An additional outcome of maintaining similar sector weights is the index achieving relatively low tracking error4at 1.39%.6 Interestingly, the S&P 500 ESG Index’s performance has consistently benefited from selecting the second-best scoring constituents7 and avoiding the worst ESG-scoring constituents.8

Conclusion

The S&P 500 ESG Index has successfully provided a measurement of U.S. equities with an ESG lens, and has maintained similar industry group weights as the S&P 500. By utilizing index construction to maintain broad sector neutrality, the index has historically reduced the impact of sector-driven performance, increased the impact of stock selection and consequently produced low tracking error versus the S&P 500.


1 See Rowton, Stephanie, Sanchez, Maria, “The S&P 500 ESG Index: 5 Years of Defining Core Through an ESG Lens

2 See Rowton, Stephanie and Sanchez, Maria, “The S&P 500 ESG Index: 5 Years of Defining Core Through an ESG Lens

3 Source: Arrow, S&P Global as of June 30, 2024.

4 Please refer to the Exclusions file.

5 See Rowton, Stephanie, Sanchez Maria “The S&P 500 ESG Index: 5 Years of Defining Core Through an ESG Lens

6 Data as of April 30, 2024, 36-month annualized tracking error.

7 New Frontiers: The S&P 500 ESG Index’s Performance Beyond the S&P 500

8 See Beyhan, Maya, “The Key to the S&P 500 ESG Index’s Outperformance: Avoiding the “Worst”

The posts on this blog are opinions, not advice. Please read our Disclaimers.

Three-Year Live Performance Review of the S&P QVM Top 90% Indices

Contributor Image
Hugo Barrera

Senior Analyst, Product Management

S&P Dow Jones Indices

Three years ago, S&P DJI launched the S&P Quality, Value, and Momentum Top 90% Multi-factor Indices (the S&P QVM Top 90% Indices) across the large-, mid- and small-cap U.S. equities segments. These indices have enriched our factor lineup, offering a differentiated approach that selects a high percentage of the universe, while excluding only the lowest-ranked decile.

In this blog, we will recap the methodology, review the indices’ performance and dive into their core characteristics.

Methodology Overview

The S&P QVM Top 90% Indices track the stocks in the top 90% of their respective underlying universes, ranked by their multi-factor score, which is based on the average of quality, value and momentum factors. Constituents are float-adjusted market capitalization weighted. This approach aims to ensure that the indices maintain similar stock counts and constituent weights as their benchmarks, which has historically resulted in low tracking error.

To illustrate the rationale behind removing the bottom 10% of stocks by multi-factor score, we can compare the performance of each decile in the S&P 500. In our analysis, we ranked stocks within the large-cap universe by their multi-factor score and rebalanced quarterly, with D1 representing the highest-ranked stocks and D10 the lowest. Exhibit 1 shows that the bottom 10% stocks significantly underperformed the other deciles within the large-cap universe.

Three-Year Live Performance of the S&P QVM Top 90% Indices

The index construction has historically limited significant outperformance or underperformance relative to the benchmark. Exhibit 2 demonstrates that since their launch, the S&P QVM Top 90% Indices have moderately outperformed their benchmarks in both the large- and small-cap universes. In the mid-cap universe, the S&P QVM Top 90% Index has generally performed in line with its benchmark. Year-to-date, all three of the S&P QVM Top 90% Indices have outperformed their benchmarks.

The methodology of the S&P QVM Top 90% Indices has helped maintain a low tracking error, reduce volatility and lower maximum drawdowns since their launch. The similar capture ratios further demonstrate that the methodology has reduced large deviations compared to the benchmark during up and down markets.

Back-Tested Performance of the S&P QVM Top 90% Indices

As shown in Exhibit 3, all three S&P QVM Top 90% Indices have outperformed their benchmarks over the long term, both in absolute and risk-adjusted terms, while maintaining a low tracking error. Additionally, over the long-term period, they have provided lower volatility and lower maximum drawdown.

Conclusion

Overall, the S&P QVM Top 90% Indices have consistently demonstrated the ability to outperform over the long and short term, all while maintaining low tracking errors and benchmark-like features such as similar stock counts and constituent weights.

These indices have shown their potential to provide moderate outperformance, reduced risk of underperformance and low tracking errors, all while preserving similar characteristics to their benchmarks.

The posts on this blog are opinions, not advice. Please read our Disclaimers.

The Rise of Passive Investing with Indices

How has the size and significance of passive investing solutions changed in recent years? In an interview at IMpower Incorporating FundForum, S&P DJI’s Tim Edwards discusses the growth trajectory of passive approaches across equity and fixed income markets, as well as the insights that SPIVA Scorecards can offer and why that research matters.

The posts on this blog are opinions, not advice. Please read our Disclaimers.