


Why did indexing take root and how has it grown so far so fast? S&P DJI’s Craig Lazzara and Anu Ganti take a closer look at why indexing works, the size of the passive market today, and the historical savings linked to indexing.
The posts on this blog are opinions, not advice. Please read our Disclaimers.Active Performance Shortfalls and the Rise of Passive
The S&P Technology Dividend Aristocrats Index: A Legacy of Dividend Increases in Technology
Active Ability versus Active Outperformance
Digging Into Digital Assets
Exploring the Defensive Advantage
Active Performance Shortfalls and the Rise of Passive
The S&P Technology Dividend Aristocrats Index: A Legacy of Dividend Increases in Technology

Wenli Bill Hao
Director, Factors and Dividends Indices, Product Management and Development
S&P Dow Jones Indices
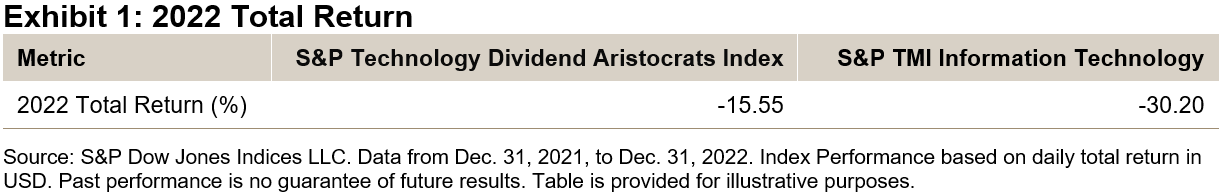
As high inflation, rising interest rates and geopolitical risks dominated the headlines in 2022, technology stocks had a particularly difficult year. Given the many headwinds facing the sector, the S&P Total Market Index (TMI) Information Technology returned -30.20% in 2022. In spite of the challenging market environment, the S&P Technology Dividend Aristocrats® Index fared relatively well, dropping about one-half the amount of the S&P TMI Information Technology, representing an outperformance of 14.66%. In this blog, we will analyze the S&P Technology Dividend Aristocrats index methodology as well as examine its dividend emphasis and style tilts.
Methodology Overview
The universe for the S&P Technology Dividend Aristocrats Index is the Information Technology sector and the Internet & Direct Marketing Retail, Interactive Home Entertainment, and Interactive Media & Services GICS sub-industries in the S&P TMI.
To be selected, a company must have increased its dividends per share (DPS) every year for at least seven consecutive years. If the number of constituents is less than 25, the DPS increase history can be shortened to four years.1 The emphasis on increasing dividends per share could provide a ballast for investors, since the ability to consistently grow dividends through different economic environments can be an indication of financial strength and discipline.
All constituents are equally weighted. This ensures broad diversification and reduces concentration risk. Lastly, the index is rebalanced annually and reweighted quarterly.
Risk/Return Profile
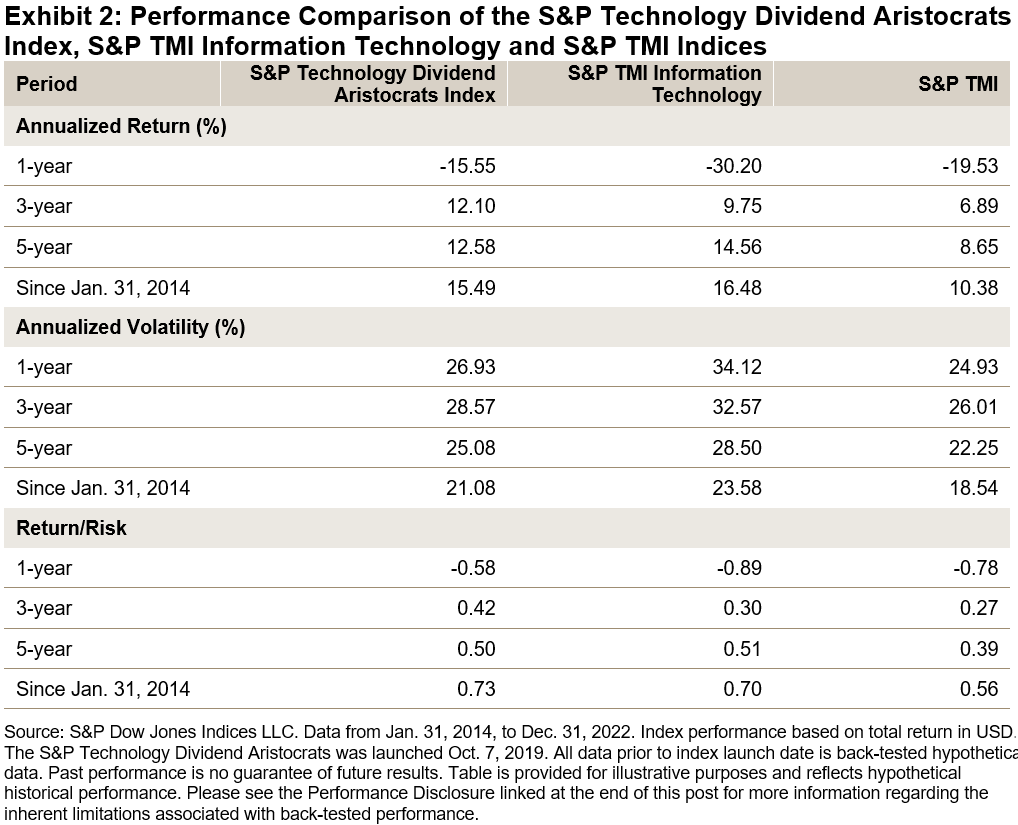
The S&P Technology Dividend Aristocrats Index outperformed both the S&P TMI Information Technology and the S&P TMI over the one- and three-year periods. Furthermore, on a risk-adjusted basis, the S&P Technology Dividend Aristocrats Index outperformed both benchmarks over all periods shown, except for the five-year period versus the S&P TMI Information Technology (0.50 versus 0.51). Importantly, the S&P Technology Dividend Aristocrats Index had lower volatility than the S&P TMI Information Technology for all periods.
Historical Dividend Growth and Dividend Yield
From Dec. 31, 2014, to Dec. 31, 2022, the S&P Technology Dividend Aristocrats Index increased its annual dividends by an annualized 14.72%, while S&P TMI Information Technology and S&P TMI Index increased their annual dividends by an annualized 11.30% and 6.42%, respectively.
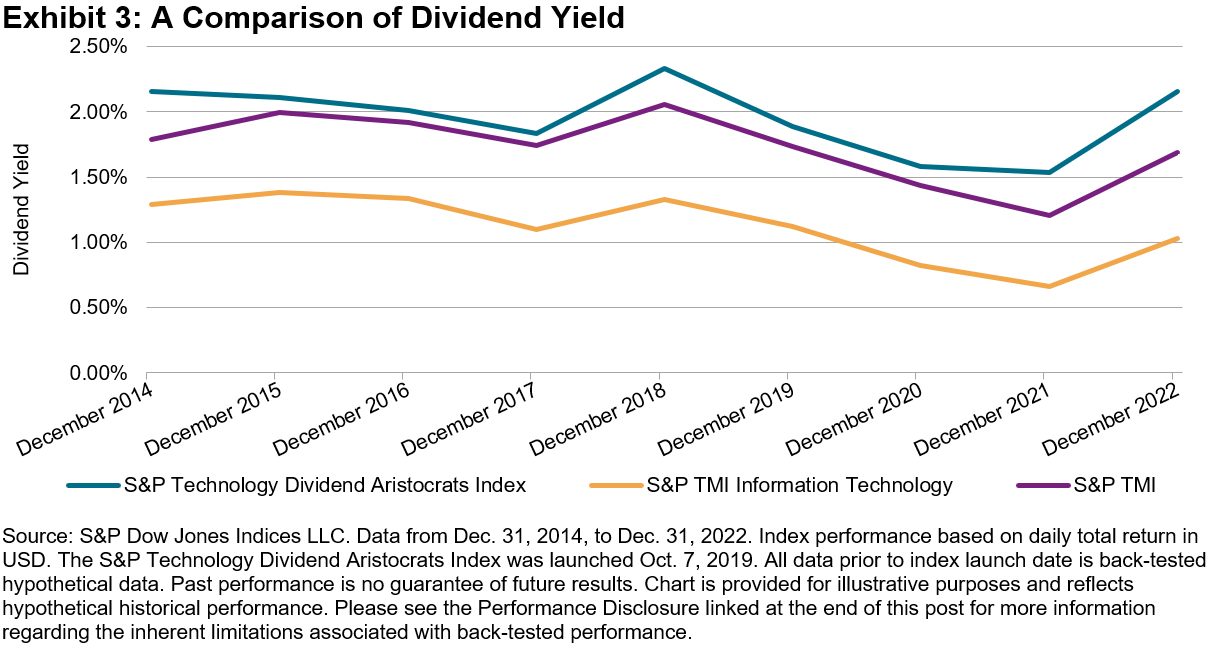
Exhibit 3 shows the annual trailing one-year dividend yield from Dec. 31, 2014, to Dec. 31, 2022. In every year over this period, the S&P Technology Dividend Aristocrats Index had a higher dividend yield than both the S&P TMI Information Technology and S&P TMI. On average, the S&P Technology Dividend Aristocrats Index had a dividend yield of 1.96%, while the S&P TMI Information Technology and S&P TMI had dividend yields of 1.12% and 1.73%, respectively.
Factor Exposure
In Exhibit 4, the S&P Technology Dividend Aristocrats Index demonstrated a value and dividend yield tilt versus the S&P TMI Information Technology. Specifically, the S&P Technology Dividend Aristocrats Index had higher Axioma Risk Factor Z-scores for the book-to-price and dividend yield factors, similar exposure to earnings yield and lower exposure to growth factors. The value and dividend tilt proved beneficial in the rising interest rate environment in 2022. Holding all else equal, value and dividend stocks offered relatively more protection in a rising interest rate environment compared with growth stocks, due to their lower durations.
Furthermore, both the S&P Technology Dividend Aristocrats Index and S&P TMI Information Technology showed higher quality characteristics (lower leverage and higher profitability) than the S&P TMI. 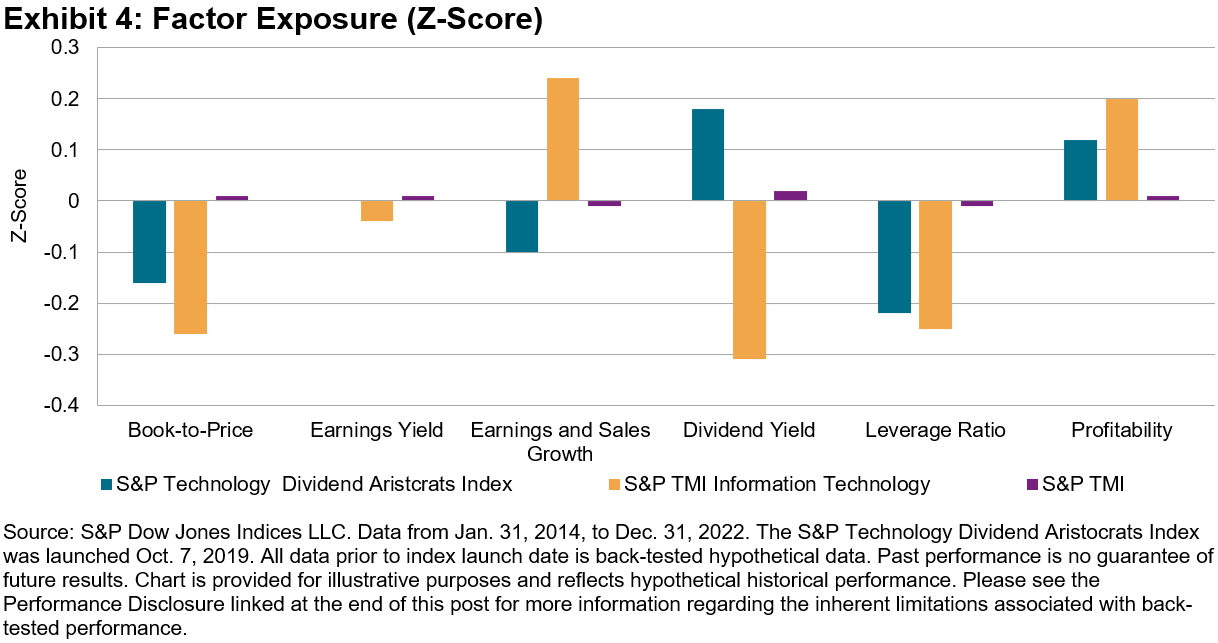
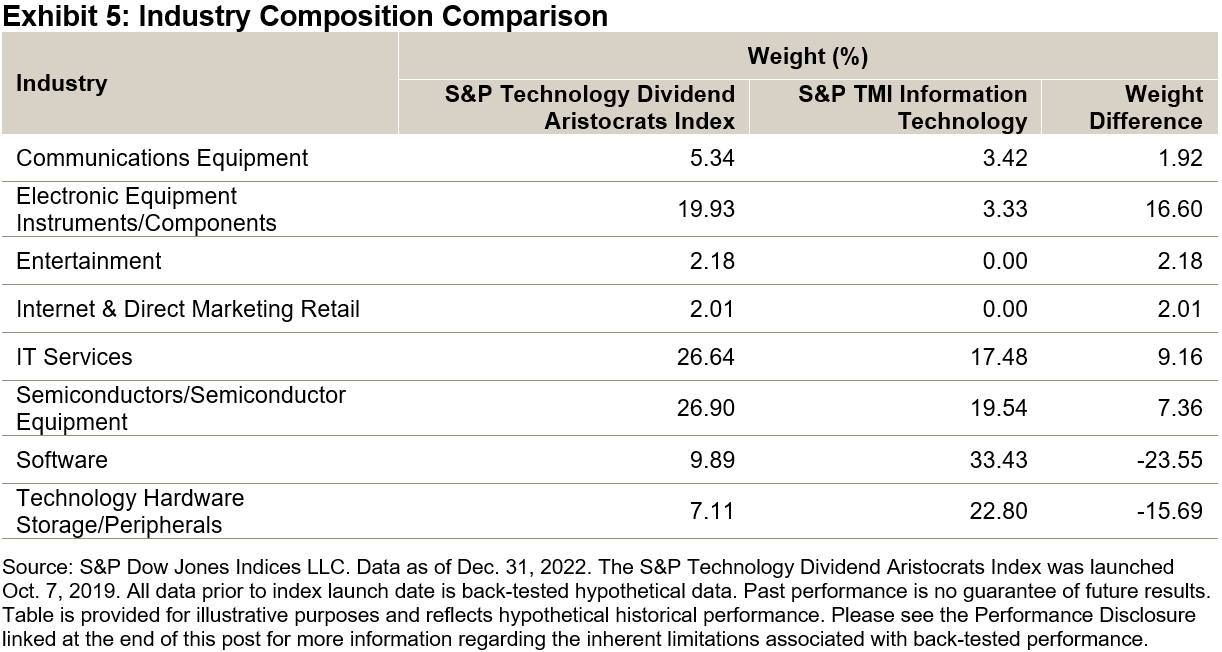
Industry Composition
Exhibit 5 shows the industry composition of the indices as of Dec. 31, 2022. The S&P Technology Dividend Aristocrats Index underweighted Software (driven by an underweight in Microsoft) and Technology Hardware Storage/Peripherals (driven by an underweight in Apple), and had a material overweight to the Electronic Equipment Instruments/Components industry.
Conclusion
Due to its emphasis on selecting companies with steady dividend increases, the S&P Technology Dividend Aristocrats Index has historically provided a solid risk-adjusted outperformance over both short- and long-term periods, a superior dividend yield and a value factor tilt in comparison with the S&P TMI Information Technology. For market participants who are interested in the technology sector and would like to have the potential for both dividend income and capital appreciation, the S&P Technology Dividend Aristocrats Index might be worth consideration.
1 Please refer to the S&P Technology Dividend Aristocrats Index Methodology for more details.
The posts on this blog are opinions, not advice. Please read our Disclaimers.Active Ability versus Active Outperformance

Some commentators have argued that today’s market environment—characterized by rising rates and economic growth concerns—is a ripe environment for stock pickers.
This argument is conditionally correct, as long as we remember that having the opportunity to add value does not guarantee that value gets added. In today’s environment, active managers have good potential to add value. Dispersion and correlation provide an analytic context:
- Active managers should prefer above-average dispersion because stock selection skill is worth more when dispersion is high.
- The role of correlation is more nuanced. When correlations are high, the benefit of diversification falls. Therefore, managers should prefer above-average correlations because they reduce the opportunity cost of a concentrated portfolio.
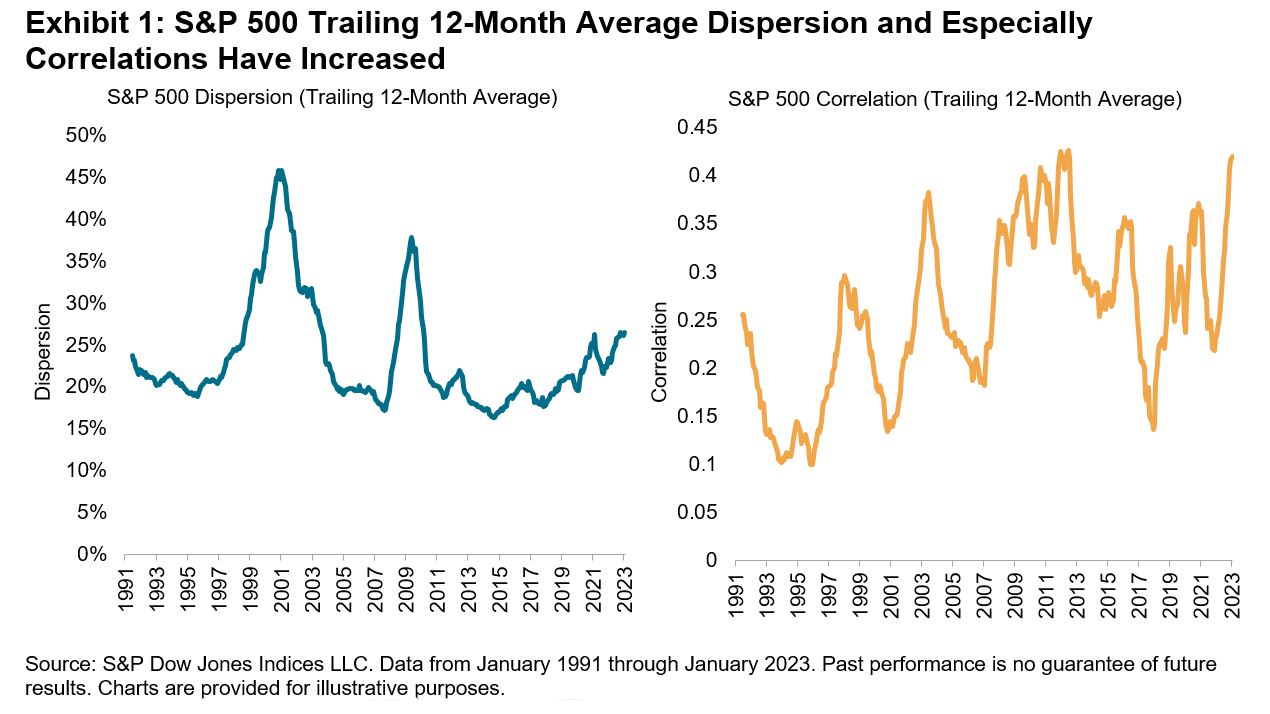
In Exhibit 1, we observe that the 12-month average dispersion of the S&P 500® has widened since 2014, while correlations have been relatively high. Higher dispersion also offers greater opportunities for active rotational strategies among countries, sectors and factors. In January 2023, we saw the highest spread between the best and worst equity factor indices since February 2021.
Active managers typically assume incremental volatility in the hope of earning incremental returns. How high must those returns be to justify the additional volatility active managers take on? The cost of concentration helps answer this question. When correlations are low, concentrated active managers incur substantially more volatility than diversified index funds. A higher cost of concentration implies a larger foregone diversification benefit, translating into a higher hurdle for active managers to overcome.
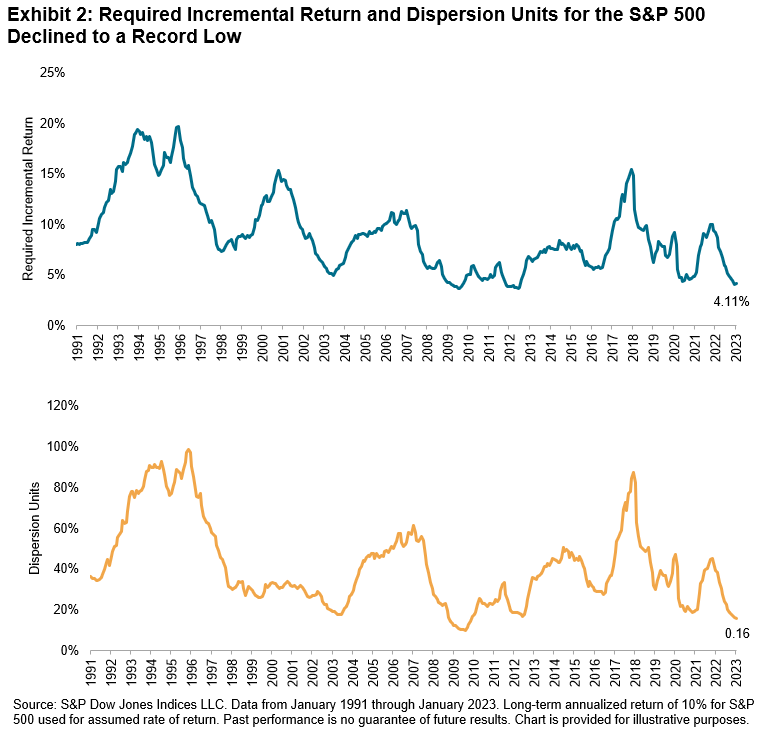
Multiplying the cost of concentration by a rate of return consistent with the market’s historical performance, we arrive at the required incremental return shown in the top half of Exhibit 2 for the S&P 500. Driven by the higher correlations seen in Exhibit 1, this measure declined by almost half in the last 12 months, to levels not seen since mid-2012, indicating that active managers gave up a much smaller diversification benefit in 2022 compared to 2021.
The bottom half of Exhibit 2 divides the required incremental return by dispersion to translate the measure into dispersion units. We can interpret a lower number of dispersion units to mean easier conditions for active management. As both dispersion and correlations were generally higher in 2022, we observe a relatively auspicious environment for active management.
While favorable conditions do not guarantee favorable active results, last year’s relatively fortuitous conditions for stock selection may have aided manager outperformance. Just 51% of large-cap active managers lagged the S&P 500 in the first half of 2022, compared to 85% in 2021. When SPIVA® results for year-end 2022 become available, it would not be surprising to see U.S. large-cap equity funds post their lowest underperformance rate since 2009.
The posts on this blog are opinions, not advice. Please read our Disclaimers.Digging Into Digital Assets
How does indexing work for cryptocurrency and digital assets? S&P DJI’s Sharon Liebowitz discusses how indices are bringing transparency to digital assets, key components of index design, and potential use cases for index-based crypto strategies.
The posts on this blog are opinions, not advice. Please read our Disclaimers.Exploring the Defensive Advantage
- Categories Factors
- Tags Anu Ganti, Craig Lazzara, defense beyond bonds, defensive factor indices, Defensive indices, efficient frontiers, ETFs, factor indices, growth factor, low volatility high dividends, minimum volatility, participation and protection, quality factor, rising rates, S&P Dividend Aristocrats, Sector indices, US FA, volatile markets
Take a closer look at the participation and protection characteristics of sector and defensive factor indices with S&P DJI’s Craig Lazzara and Anu Ganti.
The posts on this blog are opinions, not advice. Please read our Disclaimers.