Get Indexology® Blog updates via email.

In This List

What Performance Reversals Suggest

GICS Changes Are Approaching

Surveying Style Indices

The S&P China 500 Rebounded 7.1% in Q4 2022, Recovering a Portion of Its 2022 Losses

Building a Passive Bridge across the Pond

What Performance Reversals Suggest

Contributor Image
Craig Lazzara

Former Managing Director, Index Investment Strategy

S&P Dow Jones Indices

Investment results in 2022 were distinctly different from those of the recent past. The S&P 500®, which had doubled in the three years between 2019 and 2021, fell by more than 18% last year, and Exhibit 1 shows that there were regime shifts among factor indices as well.

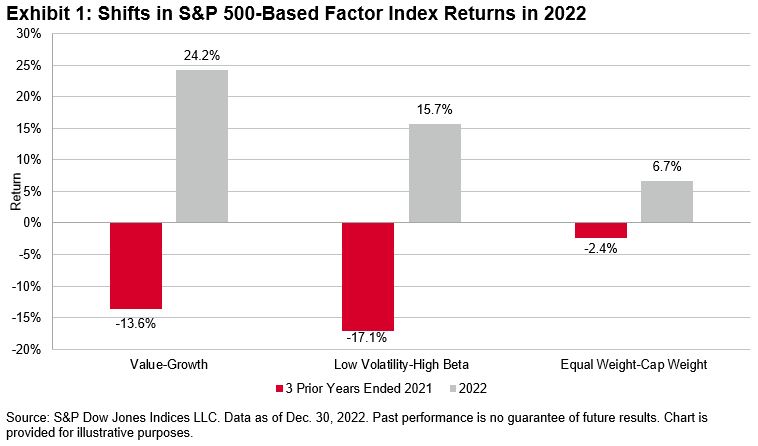
The dominance of Value over Growth in 2022 was especially remarkable. The one-year Value-Growth spread stands at the 97th percentile over all 12-month intervals since mid-1996. Equally interesting is that six years had passed since Value’s last “win” in 2016.

What can we infer from these factor shifts? Here are three important things:

First, they suggest considering passive management to be the default position for any asset owner—regardless of whether he’s seeking broad equity market exposure from the S&P 500, or more targeted factor exposure from one of the indices in Exhibit 1 (or their many cousins). Readers familiar with our SPIVA® Scorecards (and I hope that means all of you) will realize that most active managers underperform most of the time. That result holds true across capitalization and style segments: the same causes that make it hard for a core equity manager to beat the S&P 500 make it hard for a value manager to outperform the S&P 500 Value. An asset owner who opts for indicized factor exposure is likely to outperform an active manager operating in the same market segment.

Second, Exhibit 1 reminds us of the importance of patience. There are good theoretical arguments for why value should outperform growth, why low volatility should outperform high beta and why equal weight should outperform cap weight—but even if completely correct, those are arguments about long-run performance. Many low volatility or value investors spent the years between 2019 and 2021 wondering if something important had changed. 2022’s reversal was welcome, but it was a long time coming. In investment management, as in life generally, gratification must sometimes be deferred.

Finally, Exhibit 1 raises an important philosophical question: what is the point of factor indices in the first place? A value-driven factor index tracks relatively cheap stocks. A low volatility index tracks stocks with below-average volatility. A quality index tracks stocks with strong balance sheets and profitability. Are these characteristics, or others like them, desirable in themselves, or are they means to a different end? Low volatility indices, for example, are almost always less volatile than the benchmark from which their constituents are drawn, but as we saw above, they sometimes underperform. An asset owner who chooses Low Volatility because he wants less volatility is likely to be satisfied most of the time; his counterpart who chooses Low Volatility because he thinks it will outperform has much more potential for buyer’s remorse.

An investor who undertakes factor exposure as a means of outperforming should understand that no factor index outperforms all the time, and that his ability to tolerate periodic underperformance may have a major bearing on his success. The investor should strive to understand the conditions that will facilitate a factor’s success. At least as importantly, he should be clear about his own goals and motivations.

The posts on this blog are opinions, not advice. Please read our Disclaimers.

GICS Changes Are Approaching

Contributor Image
Hamish Preston

Head of U.S. Equities

S&P Dow Jones Indices

After the close on March 17, 2023, changes to the Global Industry Classification Standard (GICS®) structure will go into effect in GICS Direct and in S&P DJI’s indices. These changes will affect most sectors and will change what it means to be sector neutral. For example, Exhibit 1 compares the S&P 500 sector weights at the end of 2022 under the existing GICS structure compared to the new structure, assuming it had already gone into effect. Information Technology and Consumer Discretionary’ s weights are set to fall, while Financials and Industrials’ weights are set to increase. Here is an overview of some of the biggest upcoming changes.

GICS Is Reviewed Annually to Ensure It Continues to Reflect Global Equity Markets

Launched in 1999, GICS provides a single, consistent framework to classify companies, allowing for global sector and industry comparisons. Companies are assigned to a sub-industry according to their principal business activities, based on revenues (mainly) as well as earnings and market perception. Allocation to a sub-industry then determines—in decreasing order of granularity—membership to an industry, an industry group and a headline sector. The GICS framework is reviewed annually to ensure that the structure continues to reflect global equity markets.

Exhibit 2 shows that there have been several updates over the years, including the creation of Real Estate as standalone sector (2016) and the renaming of Telecommunication Services to Communication Services (2018). The upcoming GICS changes will affect most GICS sectors and will leave us with 11 sectors, 25 industry groups, 74 industries and 163 sub-industries.

Updates to Consumer Discretionary and Consumer Staples Reflect the Evolution of the Retail Landscape

A key update in March 2023 is that retailers will be classified based on the nature of goods sold rather than according to the underlying technology used to deliver the product or service. This update reflects the fact that retailers have increasingly taken an omni-channel approach to sell their products, reducing the demarcation between existing segments.

Exhibit 3 summarizes the impact across the Consumer Discretionary and Consumer Staples sectors. For example, the General Merchandise Stores and Department Stores sub-industries will be merged into a new sub-industry called Broadline Retail, which will also capture some of the companies (e.g., Amazon and eBay) in the soon-to-be discontinued Internet & Direct Marketing Retail sub-industry. Retailers that generate a majority of revenue or earnings from staples such as food, household and personal care products will be migrated to Consumer Staples.

Several Information Technology Companies Will Move to Other Sectors

Information Technology will also be affected by the upcoming changes: the Data Processing & Outsourced Services sub-industry is being discontinued to reflect the close alignment with business support activities in other sectors. Companies in the sub-industry will migrate to: Industrials under a definition update or under Human Resources & Employment Services; to Financials under Transaction and Payment Processing; or to Consumer Discretionary under Hotels, Resorts & Cruise Lines.

These changes will affect indices’ sector weights. For example, the Data Processing & Outsourced Services sub-industry accounts for around 3% of the S&P 500’s weight as of January 2023, and 2 of the largest 10 S&P 500 IT companies (Visa and Mastercard) will migrate to Financials.

Elsewhere, the upcoming GICS changes update the classification of Transportation, Banks and Thrifts & Mortgage Finance, as well as providing greater granularity in the classification of Real Estate Investment Trusts (REITs).

A full overview of the latest revisions to GICS can be found here, and the current and historical GICS classifications—including definitions—can be downloaded here.

The posts on this blog are opinions, not advice. Please read our Disclaimers.

Surveying Style Indices

How can index construction inform style selection? S&P DJI’s Craig Lazzara takes a closer look at the S&P Style and S&P Pure Style Indices and how these different approaches to indexing Growth and Value are designed to help advisors align strategies with client objectives.

The posts on this blog are opinions, not advice. Please read our Disclaimers.

The S&P China 500 Rebounded 7.1% in Q4 2022, Recovering a Portion of Its 2022 Losses

Contributor Image
Sean Freer

Director, Global Equity Indices

S&P Dow Jones Indices

The S&P China 500 gained 7.1% in Q4 2022, gaining back some of the losses exhibited earlier in 2022. Despite the strong quarter, Chinese equities underperformed global and emerging markets in Q4, as these segments broadly bounced back from the heavy losses of Q3. The S&P China 500 declined 24.4% in 2022, likewise underperforming global and emerging market indices. For the final quarter of 2022, Communication Services, Health Care and Financials sectors led the gains, all up over 10%.

The S&P China 500 underperformed other Asian markets, which in some cases posted strong gains during Q4. Notable outperforming benchmarks were the S&P Hong Kong BMI, S&P Korea BMI and S&P Japan BMI, which returned 18.8%, 18.2% and 12.9%, respectively. Meanwhile, the S&P Indonesia BMI dropped nearly 9% during Q4 after being the sole positive performer in the region during Q3.

The S&P China 500 continues to maintain positive performance over the long term. With an annualized gain of 5.2% in USD over the past 10 years, the index has easily outperformed the S&P Emerging BMI, which had an annualized gain of only 2.6% over the same period.

Offshore Stocks Outperformed Onshore

Both domestic and offshore listed China equities delivered positive returns during the quarter. The global downturn in equities this year has resulted in higher correlation in China equity share types, however Q4 2022 saw offshore China listings significantly outperform their onshore counterparts. Given its diversified composition across Chinese share classes, the S&P China 500 outperformed the indices that had more weight in China A-shares and underperformed those with more exposure to Hong Kong-listed Chinese companies (see Exhibit 1).

Communication Services and Health Care Led the Gains

Communication Services and Health Care outperformed in Q4, gaining 19.5% and 16.2%, respectively. Financials also had a strong quarter, up 12.4%. Consumer Staples was the largest drag on the S&P China 500’s performance, as it declined 1.6%. The Energy sector also saw negative returns during the quarter.

At the company level, the major contributors to the index’s performance during the quarter were Tencent, which clawed back all its previous quarters losses to post 26.1%; Alibaba, which was up over 10%; and Pinduoduo, which also had a strong quarter. In terms of outright performers, Shanghai Junshi Biosciences gained 95.5% on the back of a positive result from a clinical trial of a lung cancer treatment, while Country Garden Services regained Q3 losses and more—rising 69.1%—and Sinotruk, a heavy-duty vehicle manufacturer, also gained 66.6%.

NIO Inc (down 38.2%), Kweichow Moutai (down 5.9%) and LONGi Green Energy Technology (whose share price declined just over 10%) were among the few noteworthy detractors to the index’s performance during the quarter.

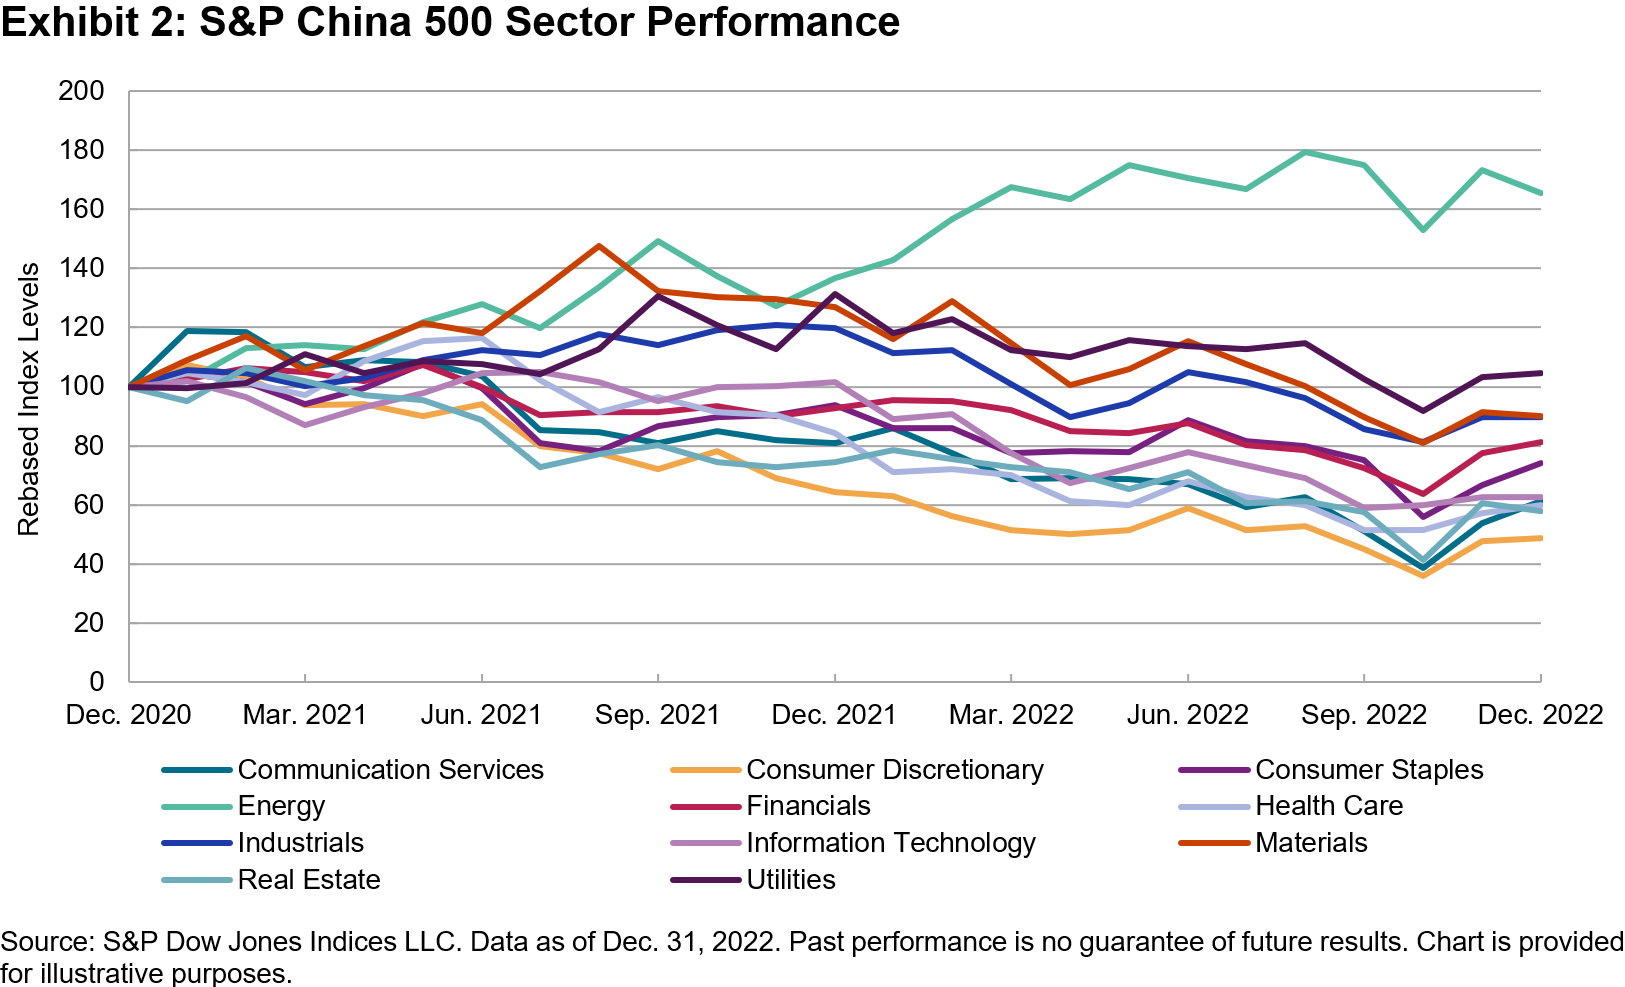
Valuation Metrics Remain Attractive

The S&P China 500 trailing P/E increased to 14.1x in Q4 (13.6x the prior quarter), however it remained below the 3-, 5- and 10-year averages. The rolling 1-, 3-, and 5-year P/E ratios remained slightly above the long-term average.

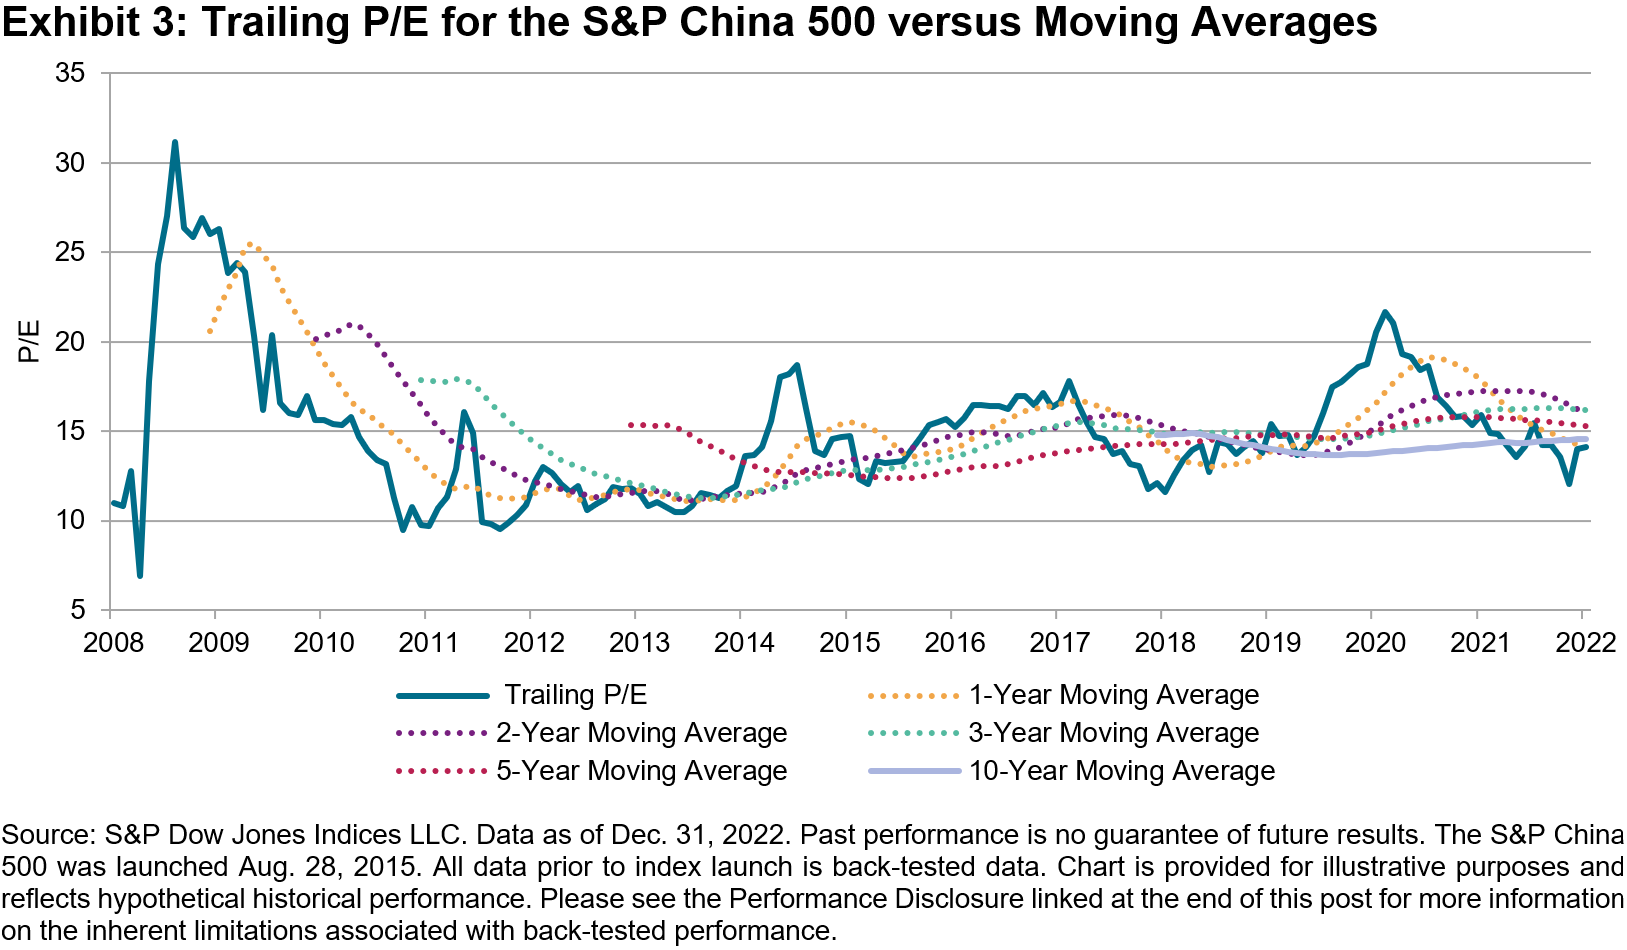
The trailing P/E for the S&P Emerging BMI also increased to 13.2x, as security price gains were broad across ex-China emerging regions. The S&P China 500 index dividend yield, meanwhile, decreased from 2.58% to 2.44% on a quarterly basis.

The posts on this blog are opinions, not advice. Please read our Disclaimers.

Building a Passive Bridge across the Pond

Contributor Image
Benedek Vörös

Director, Index Investment Strategy

S&P Dow Jones Indices

At over 300 years old, the British government bond and stock markets are among the world’s oldest. They are also among the largest globally; ranked by float-adjusted market capitalization, the U.K. gilt market and U.K. stock market are the fourth and third biggest, respectively. The British investment industry has existed for centuries, with the country’s (and world’s) oldest collective investment scheme launched over 150 years ago. Despite this long history, U.K. investment funds have been just as likely to suffer from home country bias as their international peers.

Exhibit 1 shows that U.K.-domiciled equity funds are substantially overweight their home market and underweight elsewhere, with the largest underweight in the U.S. By investing a disproportionate fraction of their assets in companies and industries based in their home country rather than globally, British market participants may be missing out on diversification benefits and potentially higher returns.

There is a large global opportunity set available to British investors, ranging across countries, sectors and currencies, and including large global companies without British equivalents. There were approximately 41,000 listed companies in the world at the end of 2019. Eliminating the smallest and least liquid names leaves around 14,000 companies from 25 developed and 24 emerging markets; Exhibit 2 shows how these compose the S&P Global BMI. With an aggregate free-float market capitalization of USD 66 trillion, the index is designed to reflect the global investable opportunity set. Given its 58% weight in the S&P Global BMI, for many investors the U.S. market represents the natural first step to globalizing their exposures.

When considering an allocation to any market segment, including U.S. equities, investors must choose between active security selection and tracking a broad-based market portfolio. The SPIVA Europe Mid-Year 2022 and SPIVA U.S. Mid-Year 2022 Scorecards can help inform this decision. The historical data summarized in Exhibit 3 suggest that outperformance in large-cap U.S. equities is uncommon for fund managers based in either market, with outperformance even more elusive for longer time horizons.

These results are unsurprising. Simple arithmetic indicates that the average market participant earns the market return before fees and costs. Professional fund managers might expect to outperform in a market dominated by small retail traders, over whom they arguably have an informational and operational edge. But in markets dominated by large institutional and professional investors—as large-cap U.S. equities have been for at least 50 years—consistent outperformance becomes less likely, making the case for passive management stronger.


The posts on this blog are opinions, not advice. Please read our Disclaimers.