Get Indexology® Blog updates via email.

In This List

The Case for Dividend Aristocrats in Pan Asia

S&P 500 GARP Index: Growth at a Reasonable Price Anyone?

Clean Energy Demand Fueled by Inflation Reduction Act

Using Indices to Help Align ESG Goals and Values

Minimizing Carbon Intensity with the S&P Carbon Control Indices

The Case for Dividend Aristocrats in Pan Asia

Contributor Image
George Valantasis

Associate Director, Factors and Dividends

S&P Dow Jones Indices

During a time of acute monetary policy tightening throughout much of the western world, major Asian central banks have remained relatively more accommodative. In China, the People’s Bank of China cut its key five-year prime loan rate last week1 after cutting it only a few months ago in May.

In addition to the looser monetary policy, growth forecasts in the region appear to be strong. The International Monetary Fund is forecasting GDP growth in the Asia Pacific region to be 4.9% in 2022 and 5.1% in 2023.2 For market participants interested in this region due to the aforementioned macroeconomic tailwinds, a dividend growth strategy such as the S&P Pan Asia Dividend Aristocrats® may be worth considering.

A Focus on Dividends and Quality

To qualify for the index, companies must have followed a managed dividends policy of increasing dividends for at least seven consecutive years (with a one-year constant dividend growth buffer). Companies must also have positive earnings and a dividend payout ratio between 0% and 100%. To avoid dividend traps, stocks with an indicated annualized dividend (IAD) yield above 10% are excluded from the index. The S&P Dividend Aristocrats methodology provides a ballast for investors since the ability to consistently grow dividends every year through different economic environments can be an indication of financial strength and discipline.

Lastly, companies that pass these filters are ranked by their IAD yield, with the top 100 stocks selected. The weighting caps are 5% for single stocks, 30% for countries and 30% for sectors.

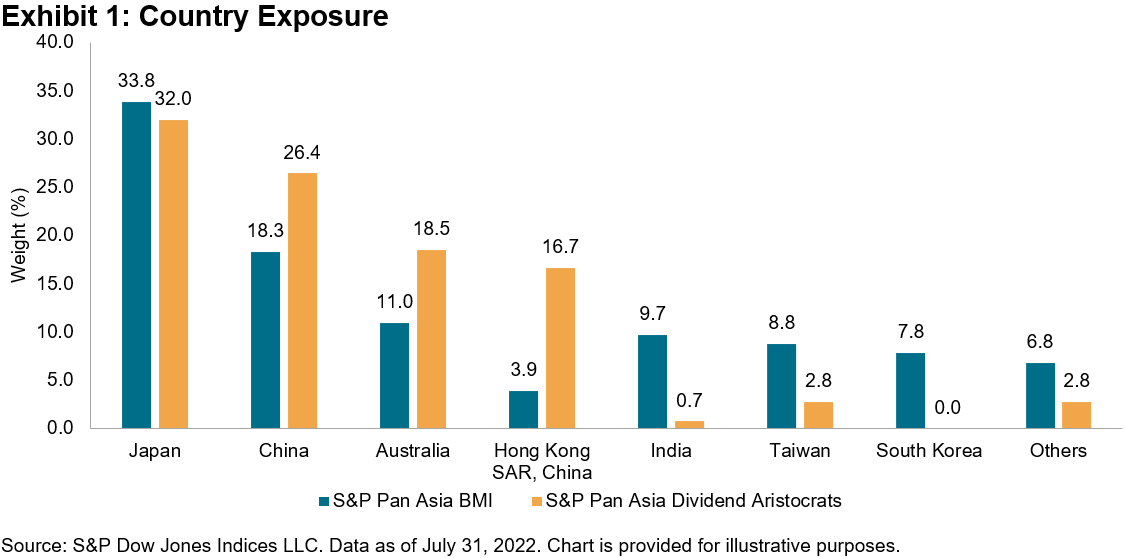
Examining Country Exposure

Exhibit 1 shows the country weights for the S&P Pan Asia Dividend Aristocrats versus the S&P Pan Asia BMI. Compared with the S&P Pan Asia BMI, the S&P Pan Asia Dividend Aristocrats had a substantial overweight to China (particularly Hong Kong) and Australia and a slight underweight to Japan. These three countries accounted for over 93% of the weight in the S&P Pan Asia Dividend Aristocrats.
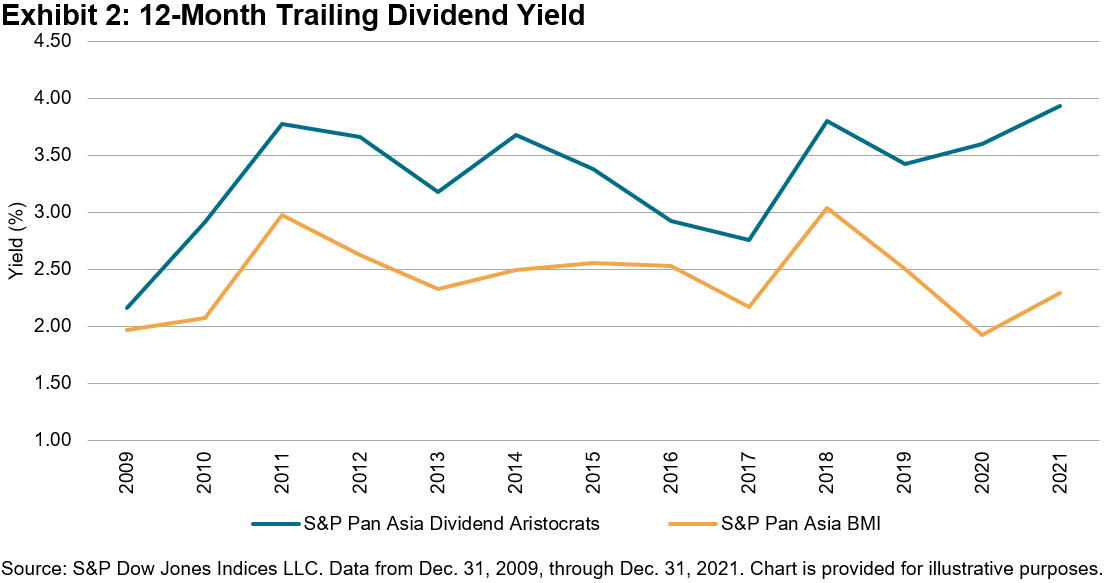
Yield Advantage

Looking at Exhibit 2, the S&P Pan Asia Dividend Aristocrats has shown considerable yield enhancement over the S&P Pan Asia BMI. Over the full period, the S&P Pan Asia Dividend Aristocrats averaged a 3.32% 12-month trailing dividend yield versus 2.42% for the S&P Pan Asia BMI.

Recently, the yield pick-up has been more pronounced. The difference in yield in 2020 and 2021 was 1.68% and 1.64%, respectively, compared with only 0.9% over the full period.
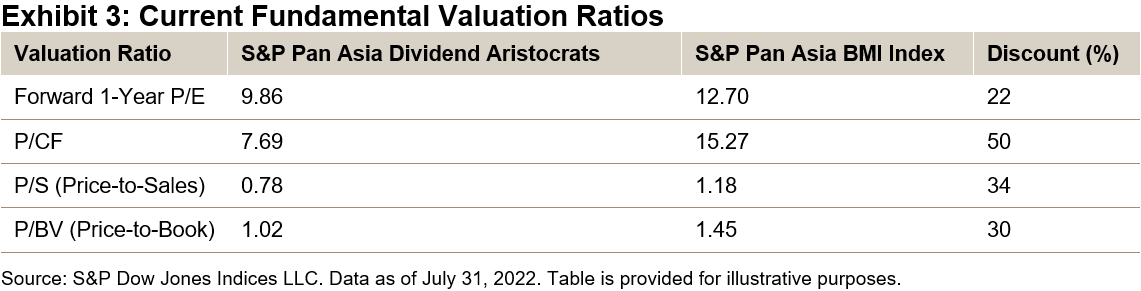
Fundamental Ratios

Exhibit 3 shows common valuation ratios for the S&P Pan Asia Dividend Aristocrats versus the S&P Pan Asia BMI. The S&P Pan Asia Dividend Aristocrats trades at a substantial discount versus its benchmark, with an average discount across the four metrics of 34%. Importantly, the S&P Pan Asia Dividend Aristocrats trades at a forward one-year price-to-earnings (P/E) ratio of 9.86 and price-to-cash flow (P/CF) ratio of 7.69, equating to a 22% and 50% discount, respectively.
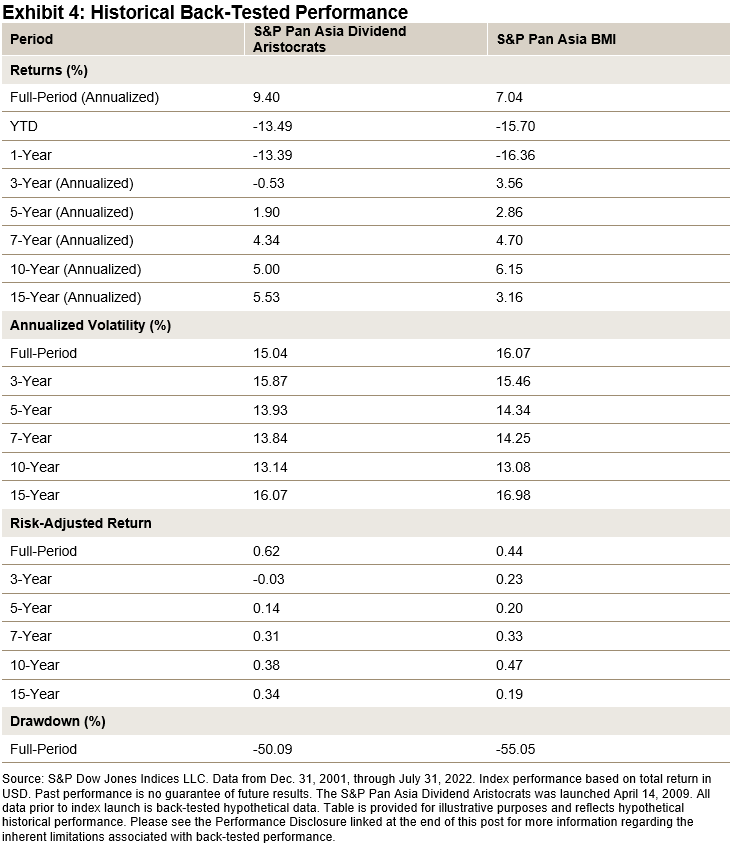
Performance

Exhibit 4 displays the strong full-period performance of the S&P Pan Asia Dividend Aristocrats compared with the S&P Pan Asia BMI. Since December 2001, the S&P Pan Asia Dividend Aristocrats has generated a 9.40% annualized return versus 7.04% for the benchmark, while exhibiting less volatility.

Over a short-term horizon, the S&P Pan Asia Dividend Aristocrats also demonstrated relative outperformance over its benchmark. YTD, the index was down 13.49% versus a decline of 15.70% for the benchmark.

In general, the S&P Pan Asia Dividend Aristocrats generated lower volatility in most time periods measured and registered a nearly 5% improvement in maximum drawdown versus the benchmark.

With its dividend yield enhancement, modest valuation and attractive long-term risk-adjusted returns, the Pan Asia Dividend Aristocrats could provide a potential opportunity for market participants seeking exposure to the Pan Asia region.

1 See https://www.wsj.com/articles/chinese-banks-cut-rates-to-spur-economic-growth-11661151854

2 See https://data.imf.org/?sk=abff6c02-73a8-475c-89cc-ad515033e662

The posts on this blog are opinions, not advice. Please read our Disclaimers.

S&P 500 GARP Index: Growth at a Reasonable Price Anyone?

Contributor Image
Wenli Bill Hao

Director, Factors and Dividends Indices, Product Management and Development

S&P Dow Jones Indices

While growth stocks have the potential to grow at a rate significantly above the market, they have faltered during 2022 on the back of high inflation and rising interest rates. For market participants toying with the idea of when and how to get back in, the S&P 500® GARP (Growth at a Reasonable Price) Index may be worthy of consideration since it tracks companies with consistent sales and earnings growth, reasonable valuation, solid financial strength and strong earning power.

Methodology Overview

The S&P 500 GARP Index first identifies the top 150 stocks from the S&P 500 as ranked by their growth scores. From those 150 stocks, the top 75 are selected based on their Quality & Value (QV) Composite Score. The QV Score is based on the average of two quality factors (financial leverage ratio and return on equity) and one value factor (earnings to price ratio). Hence, these 75 stocks represent growth stocks with relatively higher quality and value characteristics.

These 75 constituents are weighted proportional to their growth exposure, subject to a maximum weight of 5%. This approach seeks to provide purer growth exposure and limit concentration risk. As of the end of July 2022, the index’s top 10 holdings accounted for less than 20% of the total weight, and it had exposure in all 11 sectors.

Short- and Long-Term Outperformance

Over the three-year period ending July 30, 2022, the S&P 500 GARP Index has outperformed its benchmark by 11.10% (see Exhibit 1). Additionally, over the full back-test period, the index has outperformed by an annualized 3.16%.

Historical Performance in High-Inflation Environments

Given the current economic environment, it is particularly interesting to observe that the S&P 500 GARP Index has tended to outperform in periods of high inflation. In Exhibit 2, we compare the performance of the S&P 500 GARP Index and S&P 500 in periods when the year-over-year CPI rate exceeds 3% for at least 12 consecutive months.

During the longest inflation periods (January 2000-June 2001 and September 2004-August 2006), the S&P 500 GARP Index outperformed its benchmark by 25.12% and 17.47%, respectively. In the inflation period from March 2021 to July 2022, the index outperformed the S&P 500 by 1.14%.

Historical Performance in Bear Markets

In addition to periods of inflation, the S&P 500 GARP Index has also historically performed relatively well in bear markets. In comparison with S&P 500, the S&P 500 GARP Index had smaller drawdowns in all but one bear market in early 2020, coinciding with the start of the COVID-19 pandemic (see Exhibit 3). During this unique and short-lived bear market (the broader economy shutdown, work-from-home phenomenon and worldwide desperation for effective vaccines), the mega-cap Information Technology stocks surged, leading to S&P 500 outperformance.

Conclusion

Aiming to capture multi-factor risk premiums, the S&P 500 GARP Index selects growth stocks with relatively high quality at a reasonable price. The strategy has strong historical outperformance over both short- and long-term horizons relative to the S&P 500. Moreover, it has tended to perform relatively better, historically, in long high inflation and long drawdown periods. As such, the S&P 500 GARP Index is uniquely situated as a potential approach for those looking to gain exposure to growth with relatively higher quality and reasonable valuations.

The posts on this blog are opinions, not advice. Please read our Disclaimers.

Clean Energy Demand Fueled by Inflation Reduction Act

Contributor Image
Rupert Watts

Head of Factors and Dividends

S&P Dow Jones Indices

On Aug. 16, 2022, President Joe Biden signed the Inflation Reduction Act into law, which includes the largest ever climate-related investment by the U.S. federal government. Devoting USD 370 billion to climate and energy programs, the act commits the U.S. to a roughly 40% emissions reduction by 2030.

This landmark bill is the latest example of the global commitment to explore and embrace renewables. Launched in 2007, some might say the S&P Global Clean Energy Index was ahead of its time, but in recent years, many have come to consider this index to be the leading benchmark for this movement as it gains momentum worldwide.

In this blog, we will reexamine the S&P Global Clean Energy Index and explore its recent performance following the signing of this bill. Furthermore, we will look at how renewables, as a percentage of global energy production, are estimated to grow through 2050 as reported by the U.S. Energy Information Administration (EIA).

S&P Global Clean Energy Index Has Rallied

The S&P Global Clean Energy Index seeks to track global companies that generate power from renewable sources or are involved in clean-energy-related businesses. The index includes not only companies that produce clean energy but also those involved in related technologies. Therefore, it attempts to measure a broad cross section of companies in the global renewable energy ecosystem. Furthermore, by weighting companies proportional to the product of their float market cap and exposure score, the index overweights those most focused on clean energy.

The index began to rally in late July coinciding with Senator Joe Manchin’s announcement of his support for the Inflation Reduction Act on July 27, 2022 and experienced further increases when the bill passed in the Senate on Aug. 7, 2022.

Exhibit 1 shows that since July 27, 2022, the S&P Global Clean Energy Index was up 14.92%, outperforming the S&P Global BMI by 9.4%.

Continuation of the Global Trend to a Cleaner Future

While the U.S. is the latest country to make great strides toward affecting change, many parts of the world are embracing renewables and developing clean technologies. A significant impetus behind the shift from fossil fuels to renewables is an international desire to lower the global carbon footprint as established in the landmark Paris Agreement. Exhibit 2 demonstrates that progress is already being made—the renewable energy industry has grown from approximately 10.8% of all energy produced globally in 2010 to 14.8% as of 2020.

Looking ahead, Exhibit 3 shows that the U.S. EIA estimates that the renewable energy industry will grow to account for approximately 26.5% of all energy consumed globally by 2050.

Given that the initiative to move toward renewables is a global one, it is fitting that the S&P Global Clean Energy Index provides exposure to both developed and emerging markets. While the U.S. has the largest weight, as Exhibit 4 shows, over 50% of the index weight is attributed to other countries.

If we focus on the U.S. again, it is compelling to examine the role that renewables are already playing in electricity generation, accounting for 21% in 2021 as reported by the EIA. The EIA is further forecasting that renewables will overtake all other energy sources, contributing 44% of new capacity by 2050.

Examining the types of renewables used in U.S. electricity generation in Exhibit 6, we see a mix of solar, wind, geothermal and hydroelectric sources. The S&P Global Clean Energy Index approach aims to track companies involved in those sources.

As these projections show, renewables are expected to play an increasingly significant role in energy production over the next few decades and beyond. It is certainly an exciting time to follow this sector, and the S&P Global Clean Energy Index is a prominent benchmark for those who want to keep a pulse on where renewables go from here.

For additional details, please refer to S&P Global Clean Energy Index methodology.

The posts on this blog are opinions, not advice. Please read our Disclaimers.

Using Indices to Help Align ESG Goals and Values

Take a closer look at the importance of index construction and underlying data across the ESG spectrum with S&P DJI’s Ben Leale-Green.


The posts on this blog are opinions, not advice. Please read our Disclaimers.

Minimizing Carbon Intensity with the S&P Carbon Control Indices

Contributor Image
Barbara Velado

Senior Analyst, Research & Design, Sustainability Indices

S&P Dow Jones Indices

When it comes to climate change, one of the most effective mitigation options is to decarbonize the economy.1 Not only does the world need to rethink energy systems, transport technologies and materials production processes, but also the role of capital in financing the low-carbon transition. Low-carbon indices offer market participants an efficient way of managing and mitigating carbon-related financial risks within investments. Launched in August 2021, the S&P Carbon Control Indices seek to systematically reduce index-level carbon intensity2 relative to its underlying benchmark while maintaining similar industry group and country composition. Here, we explore how.

How Are the S&P Carbon Control Indices Constructed?

Exhibit 1 highlights how the S&P Carbon Control Indices are constructed. First, within each underlying universe, the carbon control index excludes based on a variety of factors, including:

  • Companies with poor S&P DJI ESG Score3 relative to their GICS industry group peers;
  • Companies involved in detrimental business activities; and
  • UNGC violators and companies involved in controversies.

Then, the index reweights stocks to minimize index-level-weighted average carbon intensity compared to that of its market-cap-weighted benchmark.4

Understanding Sources of Emissions

Unsurprisingly, when looking at sectors more closely, we find that Utilities, Materials and Energy have been the largest carbon emitters of direct and first-tier upstream emissions per unit of revenue,5 accounting for more than 80% of total emissions. It’s also interesting to note how Utilities and Materials companies within emerging markets are more carbon intense than their counterparts in the developed market region (see Exhibit 2). It follows that the S&P Carbon Control Indices underweighted those sectors while overweighting Financials, Information Technology and Communication Services, whose products and services have been generally low-carbon intense (see Exhibit 3).

Systematically Reducing Carbon Intensity

As seen in Exhibit 5, the S&P Carbon Control Indices minimized index-level weighted average carbon intensity by 70% and 80%, for the developed and emerging market regions, respectively. Further, they also reduced fossil fuel reserves emissions by 100%, mostly due to the fossil fuel exclusions. As these indices also incorporate the S&P DJI ESG Score into the selection stage of index constituents, it also provides an overall improvement of the index-level S&P DJI ESG Score and its sub-dimensional scores. This is a beneficial outcome: S&P DJI ESG Scores cover far more areas than carbon emissions, thus only incorporating carbon intensity would not guarantee that broader ESG objectives would be accounted for.


The S&P Carbon Control Indices have shown positive performance relative to their market-cap-weighted benchmarks, both in the back-tested and live periods of the indices, with a three-year tracking error of 1.16% and 1.36% for the emerging and developed market regions, respectively.

As the world pushes to transition to a greener economy, carbon will continue to represent an imminent risk for businesses and the investment community alike. The S&P Carbon Control Indices combine selection and reweighting approaches that significantly reduce index-level carbon intensity relative to their underlying benchmarks. Simply put, these indices provide a relative improvement—not an absolute one. For carbon-conscious market participants, this may be just the right fit.

1 According to the IPCC, to keep warming below 1.5°C as called for in the Paris Agreement, by 2030, global emissions need to be reduced by 45% and reach net zero by 2050. Please note that the S&P Carbon Control Indices do not seek to align with the objectives of the Paris Agreement to keep warming below 1.5°C.

2 Carbon intensity is defined as the metrics tons of operational and first-tier supply chain carbon emissions per USD 1 million in revenues.

3 For more information on S&P DJI ESG Scores, please see here.

4 For more information on the S&P Carbon Control Indices, please refer to the methodology.

5 For more information on greenhouse gas emissions calculated by Trucost, please see here.

6 For more information on index carbon metrics, please see here.

The posts on this blog are opinions, not advice. Please read our Disclaimers.