Get Indexology® Blog updates via email.

In This List

Hedging Inflation with the S&P/BMV IPC

Emerging Market-Listed Companies Enter the S&P Global Clean Energy Index

The (Re)Balancing Act of the S&P 500 ESG Index

Perspectives on the Current Crypto Slump

A Practical Look at Index Liquidity in Asia

Hedging Inflation with the S&P/BMV IPC

Contributor Image
Eduardo Olazabal

Associate Director, Global Exchange Indices

S&P Dow Jones Indices

Inflation in Mexico has reached levels not seen in over 20 years, as the S&P/BMV IPC has receded from its all-time high reached earlier this year (see Exhibit 1). In this environment, market participants may question how inflation may affect index performance and the effectiveness of equity allocations as a hedge against it.

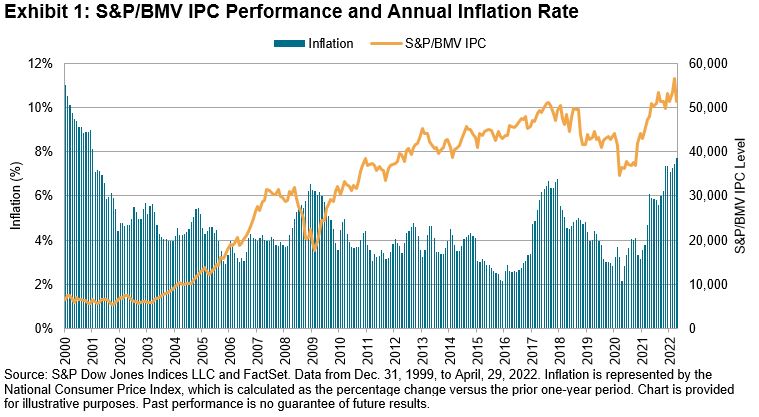
First, let’s analyze how the index has performed during periods of rising inflation. Exhibit 2 shows the rolling 12-month return of the S&P/BMV IPC compared with changes in inflation represented by the National Consumer Price Index (CPI) since 2000. For periods corresponding to rising inflation, the index returns were positive 75% of the time; however, during periods of sharp increases in inflation (over 3%), this figure increased to 100%, as shown by the returns in the circle. This shows that, historically, high inflation was associated with strong performance in the Mexican equity market.

How has the S&P/BMV IPC performed relative to inflation? Have allocations to the index served as a hedge against inflation, especially during periods of high inflation?

We can see in Exhibit 3 that, excluding periods of externally driven economic turmoil (the dot-com bubble, the Great Financial Crisis of 2008, the NAFTA renegotiation in the late 2010s and the COVID-19 pandemic), the market generally outperformed inflation by a significant amount. Since 2000, the index outperformed inflation in 60% of rolling 12-month periods. Including dividends being reinvested as measured by the S&P/BMV IRT, this grew to 68%. If we look at the past 10 years, the average outperformance was 9.4% on a price return basis and 10.4% including dividends. Analyzing the entire period in Exhibit 4, the S&P/BMV IPC provided a cumulative return of 127% over inflation and 168% with reinvested dividends, as represented by the S&P/BMV IRT.

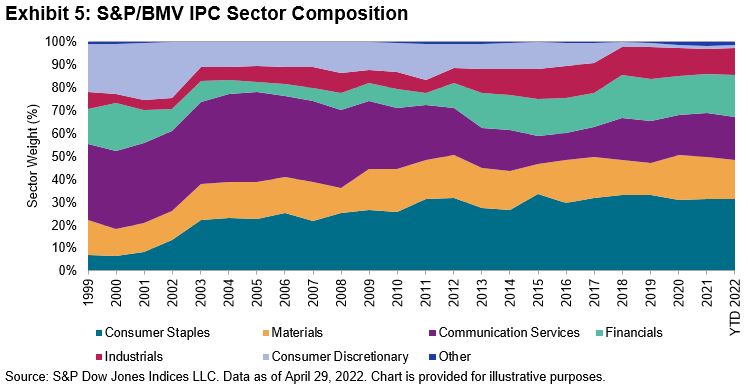
Lastly, this strong performance during rising inflation can be explained in part by the index’s composition. Consumer Staples and Materials, two sectors commonly considered to perform relatively well in inflationarity environments,1 make up nearly 50% on average of the S&P/BMV IPC over the past 10 years (see Exhibit 5). Therefore, their contribution to the index’s total return can be significant during these periods.

In conclusion, the S&P/BMV IPC has generally performed well during periods of rising inflation, more so during sharp increases, and has provided signficant real returns above inflation over the long run.


1 Demand for Consumer Staples tend to be relatively inelastic, so these companies are typically able to pass along rising prices better than other sectors. Commodity-oriented sectors such as Materials also tend to perform well in inflationary environments, as these companies benefit from rising commodity prices.

The posts on this blog are opinions, not advice. Please read our Disclaimers.

Emerging Market-Listed Companies Enter the S&P Global Clean Energy Index

Contributor Image
Zachary Botzenhart

Associate Director, Strategy Indices

S&P Dow Jones Indices

In October 2021, the S&P Global Clean Energy Index implemented most of the items addressed in the August 2021 consultation, which improved transparency, reduced the index’s carbon footprint and better aligned the index methodology with market trends.1 The latest rebalance (effective April 25, 2022), was a continuation of that consultation, with a focus on diversification by adding companies listed in emerging markets.2

The Inclusion of Emerging Market Companies Has Created a ‘Cleaner’ Clean Energy Index

The expansion to include companies listed in emerging markets allows the index to track a larger selection universe. The index is now composed of 100 constituents (formerly 75), thus achieving the target count as outlined in the index methodology. Further, the index purity, as defined by the weighted average exposure score,3 has also improved (see Exhibit 1). The current target stock count is achieved by selecting companies that have either exposure scores of 1 or 0.75, with the majority of companies achieving a score of 1. Previously, the index also included companies with an exposure score of 0.5.

Exhibit 1 shows that close to 75% of the index weight is now composed of companies that have been assigned a maximum clean energy exposure score, a notable improvement compared to the previous composition. Additionally, we observe an improvement in the carbon intensity score.

Emerging Markets Companies Added at “Half” Weight

S&P Dow Jones Indices announced in February 2022 that companies listed in emerging markets will be incorporated in a two-phased approach coinciding with the reconstitutions in April and October 2022. Therefore, all emerging market-listed companies that were added at this April rebalance were added at one-half of their target weights, with the remaining half to be added at the October 2022 rebalance. Of the 33 companies added to the index, 29 were listings from emerging markets, making up 9% of the index weight. The weights of these companies are expected to double at the next rebalance in October 2022. Considering all changes for the April 2022 rebalance, the one-way turnover incurred was 24.5%.

China and Brazil Increased Their Presence in the S&P Global Clean Energy Index

The countries with the most additions were China (16) and Brazil (6), which increased their respective country weights to 11.7% and 3.9% within the index. Conversely, companies from Denmark and the U.K. were most affected in the opposite direction, with decreases of 3.35% and 4.14%, respectively (see Exhibit 2). Overall, emerging market companies have increased their overall weight in the index by 10%, representing close to 20% of the S&P Global Clean Energy Index. At full inclusion, after the October 2022 rebalance, we anticipate that this figure will rise above 25% (see Exhibit 3).

Emerging Markets Inclusion Has Improved the S&P Global Clean Energy Index

Our analysis in this blog highlights that the expansion has aligned the index even more with its intent to focus on companies that are related to clean energy. Additionally, the broader index delivers greater geographical diversification. The International Energy Agency5 has seen a 50% increase in clean energy spending since October, and it has noted that it expects this to increase. As the clean energy transition takes shape in emerging economies,6 we expect these developments to be fairly reflected within the S&P Global Clean Energy Index.


1 Rajendra, Ari. “S&P Global Clean Energy Index: A Path toward Greater Transparency.” S&P Dow Jones Indices. Oct. 20, 2021.

2 The S&P Global Clean Energy Index previously included emerging market companies that were listed on developed exchanges.

3 All companies in the S&P Global Clean Energy Index universe are assigned exposure scores that denote their involvement in clean energy-related businesses. An exposure score of 1 is assigned to companies with maximum clean energy exposure, 0.75 to companies with significant clean energy exposure, 0.5 to companies with moderate clean energy exposure, and 0 to companies with no exposure.

4 The carbon-to-revenue (carbon intensity) footprint standard score is calculated for each stock in the preliminary universe. The score is calculated by subtracting the mean carbon-to-revenue footprint of all preliminary universe stocks with an exposure score of 1 as of the rebalancing reference date from each stock’s carbon-to-revenue footprint, and then dividing the difference by the standard deviation (also determined based on preliminary universe stocks with an exposure score of 1). The top and bottom 5% are excluded from the mean and standard deviation calculations. Companies with a score greater than 3 will not be eligible for inclusion.

5 International Energy Agency. “Clean Energy Spending Has Surged 50%.” April 12, 2022.

6 International Energy Agency. “Clean Energy Transitions in Emerging Economies.”

The posts on this blog are opinions, not advice. Please read our Disclaimers.

The (Re)Balancing Act of the S&P 500 ESG Index

Contributor Image
Margaret Dorn

Senior Director, Head of ESG Indices, North America

S&P Dow Jones Indices

It is that time of year yet again: the seasons are changing, spring is in the air and the S&P 500® ESG Index has undergone its fourth annual rebalance. Just as it has in years past, the changes of the 2022 rebalance reflect the delicate balancing act of providing for broad-based market exposure but with meaningful and measurable sustainability-focused enhancements.

Without further ado, let’s spring into some of those changes.

The Results

It is important that the methodology of the S&P 500 ESG Index reflect the evolving sentiments of a sustainability-minded investor. These views were voiced in the results of a recent market consultation that led to a revised and expanded list of exclusions based on a company’s involvement in certain business activities such as small arms, military contracting and oil sands. The consultation also addressed several other relevant updates, including more frequent eligibility check for business involvement and UNGC exclusions.1 Even with these enhancements, the S&P 500 ESG Index design still retains its main objective, which is to maintain similar overall industry group weights to the S&P 500 while enhancing the overall sustainability profile of the index. The index has indeed been able to accomplish this delicate balancing act, exhibiting a similar historical risk/return profile to that of the S&P 500 as well as an improvement in S&P DJI ESG Score2 (see Exhibit 1)—even achieving a bit of welcomed outperformance over the past one year (see Exhibit 2).

Who’s In and Who’s Out

Of the 308 constituents that were selected for inclusion in the S&P 500 ESG Index, names like Apple, Microsoft, Amazon and Alphabet once again made the cut (see Exhibit 3).

However, one familiar name may stick out as being absent from that list: Tesla. Tesla was ineligible for index inclusion due to its low S&P DJI ESG Score,3 which fell in the bottom 25% of its global GICS® industry group peers. It joins Berkshire Hathaway, Johnson & Johnson and Meta, which have once again met the index methodology’s chopping block (see Exhibit 4).

But, how can a company whose self-declared mission is to “accelerate the world’s transition to sustainable energy” not make the cut in an ESG index? There are many reasons.

Talking Tesla

First and foremost, the GICS industry group in which Tesla is assessed (Automobiles & Components) experienced an overall increase in its average S&P DJI ESG Score. So, while Tesla’s S&P DJI ESG Score has remained fairly stable year-over-year, it was pushed further down the ranks relative to its global industry group peers.4 A few of the factors contributing to its 2021 S&P DJI ESG Score were a decline in criteria level scores related to Tesla’s (lack of) low carbon strategy5 and codes of business conduct.6 In addition, a Media and Stakeholder Analysis,7 a process that seeks to identify a company’s current and potential future exposure to risks stemming from its involvement in a controversial incident, identified two separate events centered around claims of racial discrimination and poor working conditions at Tesla’s Fremont factory, as well as its handling of the NHTSA investigation after multiple deaths and injuries were linked to its autopilot vehicles. Both of these events had a negative impact on the company’s S&P DJI ESG Score at the criteria level, and subsequently its overall score. While Tesla may be playing its part in taking fuel-powered cars off the road, it has fallen behind its peers when examined through a wider ESG lens.

Onward and Upward

So, while Tesla and others may not have been included in the index this year, the beauty of the annual rebalance is that they will once again have an opportunity to be reviewed for inclusion in years to come. For now, the (re)balancing act of the S&P 500 ESG Index has once again been achieved.


More information about the S&P 500 ESG Index methodology can be found here.

For more information about hypothetical back-tested data, please see the Performance Disclosure. For information about the creation of Back-Tested Data with respect to the S&P 500 ESG Index, please also see the Back-Tested Data Assumptions FAQ.


1 Maria Sanchez. “What Is New in S&P ESG Indices?” S&P Dow Jones Indices. April 27, 2022.

2 The index achieved an S&P DJI ESG Score improvement of 8.79% (at the index level), representing 28% of the overall ESG improvement potential, given the sustainability characteristics of the starting universe.

3 The S&P DJI ESG Scores are the result of further scoring methodology refinements to the S&P Global ESG Scores that result from S&P Global’s annual Corporate Sustainability Assessment, a bottom-up research process that aggregates underlying company ESG data to score levels.

4 Tesla’s S&P Global ESG Score improved 13 points from 2020 to 2021, whereas the S&P DJI ESG Score declined 2 points over the same time period. While several components of the scoring process are the same, such as the underlying research methodology, data collection and quality assurance, there are meaningful differences in the scoring process between S&P Global ESG Scores and S&P DJI ESG Scores. For more information on these differences, please visit FAQ: S&P DJI ESG Scores

5 Low Carbon strategy criteria focus on companies’ strategies to reduce the carbon intensity of its car portfolio (efficient technologies), but also assess its current portfolio exposure to regulatory risks.

6 Codes of business conduct criteria encompass a company’s implementation, transparent reporting on breaches and the occurrence of corruption and bribery cases and anti-competitive practices.

7 The Media & Stakeholder Analysis is an ongoing screening of company controversies that may have financial or reputational impacts on companies assessed in the Corporate Sustainability Assessment.

The posts on this blog are opinions, not advice. Please read our Disclaimers.

Perspectives on the Current Crypto Slump

Contributor Image
Sharon Liebowitz

Former Head of Innovation

S&P Dow Jones Indices

I’ll avoid the usual platitudes about the market downturn. Instead, I’d like to focus on how we can better understand the current cryptocurrency market movement by looking at the S&P Cryptocurrency Indices. First, to set the context for the current drawdown, we’ll take a look at the biggest declines in Bitcoin. Then, we’ll take a more detailed look at the performance of specific cryptocurrency market-cap segments in this period.

Setting the Context

Even before the current downturn, most would agree—and the data shows—that there is a significant amount of volatility in the cryptocurrency market. The initial S&P Cryptocurrency Indices, as reported in our whitepaper and based on back-tested data, have frequently experienced high annualized returns, accompanied by significant volatility and downside risk (see charts on pages 15-16 of the whitepaper.)

When we look at the S&P Bitcoin Index specifically, we can see that the two largest drawdowns since inception were 76% and 71%. The first one started in late 2017 and lasted more than a year. The second one dates back to 2014 and also lasted more than a year. (Drawdowns are within the back-tested history of the index, starting Jan. 1, 2014). The third largest drawdown was 40%, significantly less than the two largest and also more recent, in 2021 (see Exhibit 1).

If we compare these drawdowns with the most recent period of decline (from March 28, 2022, to May 11, 2022), the drawdown was 39%. In other words, the current market drop is competing for third place in the list of largest historical drawdowns of the S&P Bitcoin Index on our record.

In times of significant market declines, it is particularly helpful to view the recent market environment in the context of earlier drawdowns. In the current case, the context shows that the asset class has been through worse conditions. For those who have started following cryptocurrency more recently, there is a term “crypto winter,” which describes past sharp declines in price followed by a period of little growth. Whether the market will head into winter or rebound remains to be seen.

Performance of the Broader Cryptocurrency Market

Looking at the S&P Cryptocurrency Indices overall, we can see that performance has varied based on market cap YTD.

In general, the coin-related indices with the largest market cap have experienced relatively smaller declines (see Exhibit 2). Specifically, the S&P Bitcoin Index and S&P Ethereum Index have fared better than the other broad indices. Whether this weathering is a function purely of market cap, or also due to the fact that these are the oldest, most liquid coins, is not easy to parse.

As we move down the cap table, we can see the worst-performing index YTD was the S&P Cryptocurrency BDM Ex-LargeCap Index. This index includes over 350 smaller coins and does not include the potentially stabilizing influence of Bitcoin or Ethereum. This performance too suggests that the market has historically favored the large-cap coins over small-cap coins.

Finally, it’s worth noting that S&P DJI does not include stablecoins or any other pegged digital assets in our existing cryptocurrency indices. This exclusion is because, while stablecoins may be considered an essential part of the cryptocurrency ecosystem, they do not necessarily reflect growth (or declines) in the market.

The recent events with stablecoin UST (TerraUSD) and its companion Luna, however, show that stablecoins can lose their peg, decline rapidly in the market and create systemic risk to crypto market stability overall.1

For more information about the S&P Cryptocurrency Indices, please see here.


1 https://www.nytimes.com/2022/05/12/technology/cryptocurrencies-crash-bitcoin.html

The posts on this blog are opinions, not advice. Please read our Disclaimers.

A Practical Look at Index Liquidity in Asia

What role does index liquidity play in helping market-participants in Asia participate in the U.S. equity ecosystem during Asia’s trading hours? Join S&P DJI and State Street Global Advisors for a practical look at using indices to assess the potential opportunity set.

Learn more: Regional Relevancy of S&P 500 and Dow Jones Industrial Average Futures in Asia – Education | S&P Dow Jones Indices (spglobal.com)

The posts on this blog are opinions, not advice. Please read our Disclaimers.