Get Indexology® Blog updates via email.

In This List

The (Re)Balancing Act of the S&P 500 ESG Index

Perspectives on the Current Crypto Slump

A Practical Look at Index Liquidity in Asia

S&P 500 Weekly Options Now Expire Five Days a Week

Transparency, Independence and Integrity as the Bedrocks of Indexing

The (Re)Balancing Act of the S&P 500 ESG Index

Contributor Image
Margaret Dorn

Senior Director, Head of ESG Indices, North America

S&P Dow Jones Indices

It is that time of year yet again: the seasons are changing, spring is in the air and the S&P 500® ESG Index has undergone its fourth annual rebalance. Just as it has in years past, the changes of the 2022 rebalance reflect the delicate balancing act of providing for broad-based market exposure but with meaningful and measurable sustainability-focused enhancements.

Without further ado, let’s spring into some of those changes.

The Results

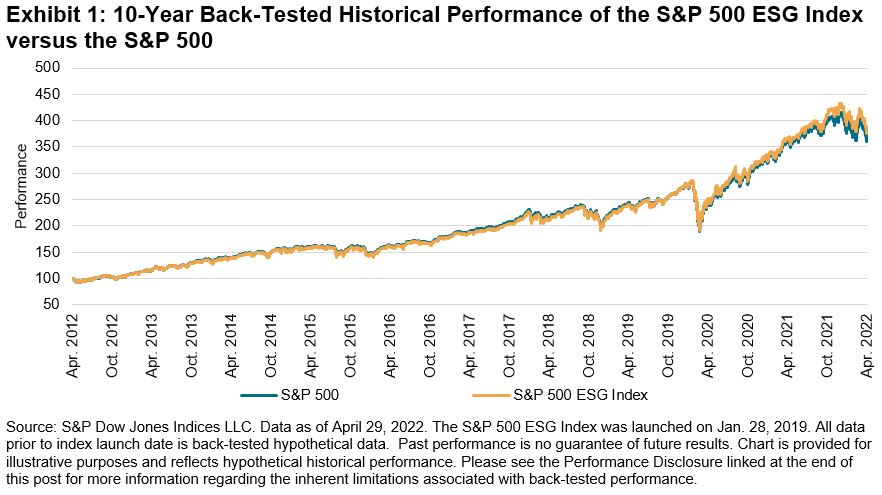
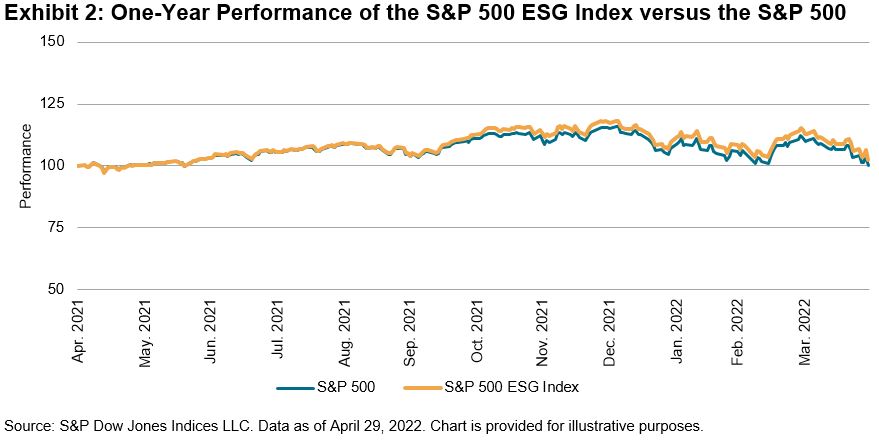
It is important that the methodology of the S&P 500 ESG Index reflect the evolving sentiments of a sustainability-minded investor. These views were voiced in the results of a recent market consultation that led to a revised and expanded list of exclusions based on a company’s involvement in certain business activities such as small arms, military contracting and oil sands. The consultation also addressed several other relevant updates, including more frequent eligibility check for business involvement and UNGC exclusions.1 Even with these enhancements, the S&P 500 ESG Index design still retains its main objective, which is to maintain similar overall industry group weights to the S&P 500 while enhancing the overall sustainability profile of the index. The index has indeed been able to accomplish this delicate balancing act, exhibiting a similar historical risk/return profile to that of the S&P 500 as well as an improvement in S&P DJI ESG Score2 (see Exhibit 1)—even achieving a bit of welcomed outperformance over the past one year (see Exhibit 2).

Who’s In and Who’s Out

Of the 308 constituents that were selected for inclusion in the S&P 500 ESG Index, names like Apple, Microsoft, Amazon and Alphabet once again made the cut (see Exhibit 3).

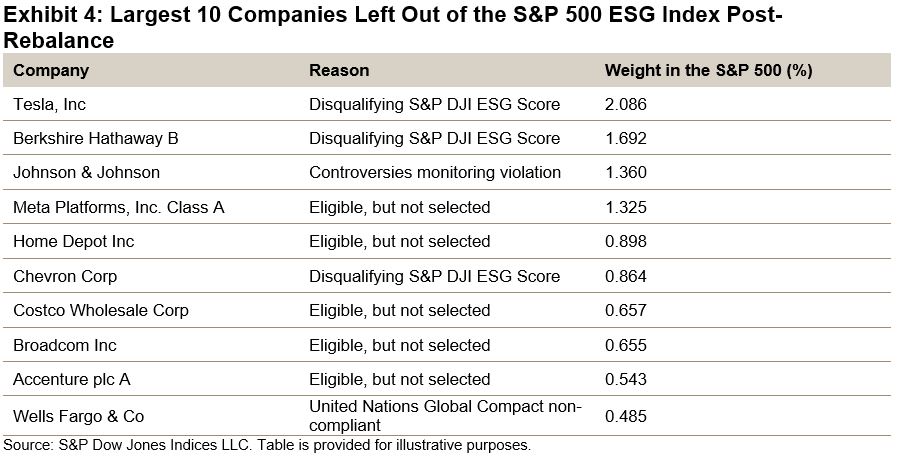
However, one familiar name may stick out as being absent from that list: Tesla. Tesla was ineligible for index inclusion due to its low S&P DJI ESG Score,3 which fell in the bottom 25% of its global GICS® industry group peers. It joins Berkshire Hathaway, Johnson & Johnson and Meta, which have once again met the index methodology’s chopping block (see Exhibit 4).

But, how can a company whose self-declared mission is to “accelerate the world’s transition to sustainable energy” not make the cut in an ESG index? There are many reasons.

Talking Tesla

First and foremost, the GICS industry group in which Tesla is assessed (Automobiles & Components) experienced an overall increase in its average S&P DJI ESG Score. So, while Tesla’s S&P DJI ESG Score has remained fairly stable year-over-year, it was pushed further down the ranks relative to its global industry group peers.4 A few of the factors contributing to its 2021 S&P DJI ESG Score were a decline in criteria level scores related to Tesla’s (lack of) low carbon strategy5 and codes of business conduct.6 In addition, a Media and Stakeholder Analysis,7 a process that seeks to identify a company’s current and potential future exposure to risks stemming from its involvement in a controversial incident, identified two separate events centered around claims of racial discrimination and poor working conditions at Tesla’s Fremont factory, as well as its handling of the NHTSA investigation after multiple deaths and injuries were linked to its autopilot vehicles. Both of these events had a negative impact on the company’s S&P DJI ESG Score at the criteria level, and subsequently its overall score. While Tesla may be playing its part in taking fuel-powered cars off the road, it has fallen behind its peers when examined through a wider ESG lens.

Onward and Upward

So, while Tesla and others may not have been included in the index this year, the beauty of the annual rebalance is that they will once again have an opportunity to be reviewed for inclusion in years to come. For now, the (re)balancing act of the S&P 500 ESG Index has once again been achieved.


More information about the S&P 500 ESG Index methodology can be found here.

For more information about hypothetical back-tested data, please see the Performance Disclosure. For information about the creation of Back-Tested Data with respect to the S&P 500 ESG Index, please also see the Back-Tested Data Assumptions FAQ.


1 Maria Sanchez. “What Is New in S&P ESG Indices?” S&P Dow Jones Indices. April 27, 2022.

2 The index achieved an S&P DJI ESG Score improvement of 8.79% (at the index level), representing 28% of the overall ESG improvement potential, given the sustainability characteristics of the starting universe.

3 The S&P DJI ESG Scores are the result of further scoring methodology refinements to the S&P Global ESG Scores that result from S&P Global’s annual Corporate Sustainability Assessment, a bottom-up research process that aggregates underlying company ESG data to score levels.

4 Tesla’s S&P Global ESG Score improved 13 points from 2020 to 2021, whereas the S&P DJI ESG Score declined 2 points over the same time period. While several components of the scoring process are the same, such as the underlying research methodology, data collection and quality assurance, there are meaningful differences in the scoring process between S&P Global ESG Scores and S&P DJI ESG Scores. For more information on these differences, please visit FAQ: S&P DJI ESG Scores

5 Low Carbon strategy criteria focus on companies’ strategies to reduce the carbon intensity of its car portfolio (efficient technologies), but also assess its current portfolio exposure to regulatory risks.

6 Codes of business conduct criteria encompass a company’s implementation, transparent reporting on breaches and the occurrence of corruption and bribery cases and anti-competitive practices.

7 The Media & Stakeholder Analysis is an ongoing screening of company controversies that may have financial or reputational impacts on companies assessed in the Corporate Sustainability Assessment.

The posts on this blog are opinions, not advice. Please read our Disclaimers.

Perspectives on the Current Crypto Slump

Contributor Image
Sharon Liebowitz

Former Head of Innovation

S&P Dow Jones Indices

I’ll avoid the usual platitudes about the market downturn. Instead, I’d like to focus on how we can better understand the current cryptocurrency market movement by looking at the S&P Cryptocurrency Indices. First, to set the context for the current drawdown, we’ll take a look at the biggest declines in Bitcoin. Then, we’ll take a more detailed look at the performance of specific cryptocurrency market-cap segments in this period.

Setting the Context

Even before the current downturn, most would agree—and the data shows—that there is a significant amount of volatility in the cryptocurrency market. The initial S&P Cryptocurrency Indices, as reported in our whitepaper and based on back-tested data, have frequently experienced high annualized returns, accompanied by significant volatility and downside risk (see charts on pages 15-16 of the whitepaper.)

When we look at the S&P Bitcoin Index specifically, we can see that the two largest drawdowns since inception were 76% and 71%. The first one started in late 2017 and lasted more than a year. The second one dates back to 2014 and also lasted more than a year. (Drawdowns are within the back-tested history of the index, starting Jan. 1, 2014). The third largest drawdown was 40%, significantly less than the two largest and also more recent, in 2021 (see Exhibit 1).

If we compare these drawdowns with the most recent period of decline (from March 28, 2022, to May 11, 2022), the drawdown was 39%. In other words, the current market drop is competing for third place in the list of largest historical drawdowns of the S&P Bitcoin Index on our record.

In times of significant market declines, it is particularly helpful to view the recent market environment in the context of earlier drawdowns. In the current case, the context shows that the asset class has been through worse conditions. For those who have started following cryptocurrency more recently, there is a term “crypto winter,” which describes past sharp declines in price followed by a period of little growth. Whether the market will head into winter or rebound remains to be seen.

Performance of the Broader Cryptocurrency Market

Looking at the S&P Cryptocurrency Indices overall, we can see that performance has varied based on market cap YTD.

In general, the coin-related indices with the largest market cap have experienced relatively smaller declines (see Exhibit 2). Specifically, the S&P Bitcoin Index and S&P Ethereum Index have fared better than the other broad indices. Whether this weathering is a function purely of market cap, or also due to the fact that these are the oldest, most liquid coins, is not easy to parse.

As we move down the cap table, we can see the worst-performing index YTD was the S&P Cryptocurrency BDM Ex-LargeCap Index. This index includes over 350 smaller coins and does not include the potentially stabilizing influence of Bitcoin or Ethereum. This performance too suggests that the market has historically favored the large-cap coins over small-cap coins.

Finally, it’s worth noting that S&P DJI does not include stablecoins or any other pegged digital assets in our existing cryptocurrency indices. This exclusion is because, while stablecoins may be considered an essential part of the cryptocurrency ecosystem, they do not necessarily reflect growth (or declines) in the market.

The recent events with stablecoin UST (TerraUSD) and its companion Luna, however, show that stablecoins can lose their peg, decline rapidly in the market and create systemic risk to crypto market stability overall.1

For more information about the S&P Cryptocurrency Indices, please see here.


1 https://www.nytimes.com/2022/05/12/technology/cryptocurrencies-crash-bitcoin.html

The posts on this blog are opinions, not advice. Please read our Disclaimers.

A Practical Look at Index Liquidity in Asia

What role does index liquidity play in helping market-participants in Asia participate in the U.S. equity ecosystem during Asia’s trading hours? Join S&P DJI and State Street Global Advisors for a practical look at using indices to assess the potential opportunity set.

Learn more: Regional Relevancy of S&P 500 and Dow Jones Industrial Average Futures in Asia – Education | S&P Dow Jones Indices (spglobal.com)

The posts on this blog are opinions, not advice. Please read our Disclaimers.

S&P 500 Weekly Options Now Expire Five Days a Week

Contributor Image
Berlinda Liu

Former Director, Multi-Asset Indices

S&P Dow Jones Indices

Since their debut in 1983, S&P 500 options have grown into the most liquid index options in the market today.1 In 2005, Cboe introduced PM-settled S&P 500 weekly options (SPXW) to meet market demand for additional trading frequency. The first weekly options expired only on Fridays, with Monday and Wednesday expirations added over time. On April 18 and May 11, 2022, respectively, Tuesday and Thursday expirations were added to complete the suite. Now SPXW options have five expirations a week.

Adding Tuesday and Thursday expirations reflects the increasing popularity of SPXW options. S&P 500 option trading has grown significantly in recent years; in the first quarter of 2022, S&P 500 option average daily trading volume (ADTV) exceeded 1.7 million, five times higher than that of 2005 (~285,000). Of that, SPXW option ADTV topped 1.2 million, about 70% of the total. Among the weeklies, roughly 45% ADTV expires on Fridays, 46% is split between Monday and Wednesday expirations, and the remaining 9% expires on Tuesdays or Thursdays because of holidays and end-of-month expirations.

Adding more expirations will offer more trading flexibility. Demand for short-term expirations has grown drastically since 2020. A Cboe study2 showed that in 2021, almost half of trading volume came from options that expired within five business days. Day trading and ultra-short-term option trading have broadly gained popularity. Whether the goal is to adjust exposure to imminent events or target specific risk/return objectives, more expirations allow more precise positioning.

Ultra-short-term options also come handy in option trading strategies. For example, in a calendar spread, a market participant expresses their view through a long position in a longer-dated option and sells a nearer-dated option to finance it. Ultra-short-term options tend to be less noisy compared with longer-term ones, due to their limited time frame. Therefore, participants implementing spread trade may benefit from the increased selection of ultra-short option expirations.

Since its introduction in mid-April, the ADTV of Tuesday-expired SPXW options increased to 211,714 in the first week of May, catching up the ADTV of Monday-expired (303,191) and Wednesday-expired (261,523) options. Five expirations per week is exciting news for market participants and could boost the S&P 500 options trading to a new level.


1 Cboe. “Cboe Global Markets Monthly Trading Statistics.” https://www.cboe.com/us/options/market_statistics/monthly_volume_rpc_reports/.

2 Cboe. “Trading SPXW Options with Expirations Five Days a Week.” April 20, 2022.

The posts on this blog are opinions, not advice. Please read our Disclaimers.

Transparency, Independence and Integrity as the Bedrocks of Indexing

Contributor Image
Dan Draper

Chief Executive Officer

S&P Dow Jones Indices

I am deeply honored to assume the chairmanship of the Index Industry Association (IIA) this year. Since 2012, the IIA has been a tireless advocate for independent index providers globally. As the IIA celebrates its 10th anniversary this year, now more than ever, our role in educating people about how indexing has transformed and democratized access to financial markets is crucial.

Indeed, indexing has rapidly evolved over the past three decades, growing from a relatively niche and obscure segment of the global financial market into a mainstream part of investing, retirement saving and generational wealth-building.

Today, global index providers collectively offer roughly three million indices that track and measure the broader markets as well as more targeted market sectors and segments. This means that overall, the indexing industry is ripe for competition and innovation.

Transparency has been a founding principle of the IIA, with its members committing to making index methodologies publicly available. Thanks to transparency and independent indices, there are more data and insights available today to help us better understand and evaluate market risks, returns and opportunities. Indices help investors make informed decisions to meet a wide range of financial goals.

Indices themselves have been around for a long time. Iconic gauges such as the Dow Jones Industrial Average® (DJIA), the S&P 500® and many other benchmarks are not only tracking the market’s daily ups and downs but are also reflecting its most pivotal moments. For example, indices have borne witness to the changing fortunes of the corporate world, industry shifts in the global economy and the rise of new companies. Indices reflect the market’s history and longevity and provide an eye toward its future.

The value and benefits that indices and indexing have brought to global markets cannot be underestimated. While independent index providers do not manage money, trade or develop investment strategies, indices are licensed and utilized as building blocks for index-based financial products such as exchange-traded funds (ETFs). The demand for indices and index-based products such as ETFs continues to grow, driven by their transparency, efficiency and low cost.

An S&P Dow Jones Indices study illustrated the strength of savings derived from indexing over the past 25 years. S&P DJI estimated that indexing has generated approximately USD 357 billion in cumulative savings in management fees. This study used three of S&P DJI’s core U.S. equity indices as a sample. If we consider the cumulative benefits derived from all the indices available linked to ETFs and other index-based investment products, the aggregate amount of savings would likely be far higher.

In addition to lower costs, performance is another key driver of the growth of indexing and the shift to index-based or passive investing from active management. S&P DJI has been tracking the performance of actively managed funds versus their respective indices and has found that active managers, which typically charge higher management fees, tend to trail their benchmarks in terms of performance. In the SPIVA® U.S. Year-End 2021 Scorecard, S&P DJI found that more than 80% of U.S. large-cap funds underperformed the S&P 500 over a 10-year period. Indices and indexing with their cost benefits have contributed to increased market competition. Ultimately, it seems that healthy competition among index providers and a diversity of choice benefit end investors.

Indices and the indexing industry as a whole will continue to reflect the ongoing evolution of global financial markets. Since its founding a decade ago, the IIA has served as a unified voice for the indexing industry and remains committed to maintaining an open and constructive dialogue with a diverse group of market participants and stakeholders.

The IIA and its members recognize their important contributions to and role in the broader financial ecosystem and will continue to uphold the highest standards of integrity and transparency in our industry to promote sustainable global financial markets and foster healthy competition and innovation.

This article was first published on the Index Industry Association website on March 31, 2022, as part of the series Voices of IIA.

The posts on this blog are opinions, not advice. Please read our Disclaimers.