Get Indexology® Blog updates via email.

In This List

Reductions in Risk Caused Disparate Returns for Commodities in April

ESG in Australian Strategies: How Does It Look?

Results from the SPIVA India Year-End 2021 Scorecard

S&P Risk Parity Indices Outperformed in Q1 2022

What Is New in S&P ESG Indices?

Reductions in Risk Caused Disparate Returns for Commodities in April

Contributor Image
Jim Wiederhold

Former Director, Commodities and Real Assets

S&P Dow Jones Indices

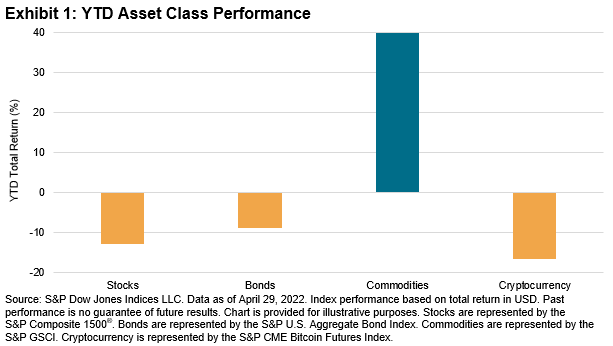
Another higher inflation reading helped the S&P GSCI, the broad commodities benchmark, to post an additional 5.1% gain in April. Many market participants realized the U.S. Fed may be behind the curve and have started allocating capital to commodities in 2022. Agriculture and energy continued to outperform last month, while metals and livestock underperformed. Among the major asset classes, commodities’ outperformance YTD is striking (see Exhibit 1).

The S&P GSCI Energy rose another 9.0% in April, with an impressive 59.2% YTD performance. Natural gas and heating oil led the way for the month, rising 26.9% and 24.7%, respectively, as the major crude oil grades continued to consolidate from the March peak in prices. Demand for U.S. natural gas exports rose dramatically this year with the global push to break dependence on Russian supplies. Natural gas production in the U.S. has slowed and the Energy Information Administration increased its price forecasts for 2022 to reflect this supply/demand imbalance.

Consolidation was evident in the metals markets in April. The S&P GSCI Industrial Metals declined 7.6%. Copper and aluminum fell notably, as COVID-19 restrictions in top consumer China and the growing likelihood of aggressive interest rate hikes fueled concern of weaker global growth.

Gold’s appeal waned in April. While gold is perceived as an inflation hedge, higher short-term U.S. interest rates and bond yields tend to increase the opportunity cost of holding a zero-yield asset such as the yellow metal. The S&P GSCI Precious Metals ended the month down 2.1%.

The S&P GSCI Agriculture gained 5.8% over the month, propelled higher by strong performance across the grains and oilseeds complex. The stand-out performer for the month was corn; the S&P GSCI Corn rallied 9.6%. U.S. corn planting in the last week of April was the slowest pace since 2013; the risk of late corn planting is that the crop is likely to pollinate later, and that can often feature hotter, yield-limiting temperatures. U.S. corn predominantly pollinates in July. The S&P GSCI Soybean Oil rose to record levels in April, ending the month up 23.0%. Access to oils for making food and fuel has been thrown into disarray, as war in Ukraine and weather-driven supply woes reduced availability, and the situation was exacerbated in April following Indonesia’s sweeping ban on palm oil exports.

Livestock markets struggled in April under the weight of higher feed costs and the protracted lockdown across China, a key export market particularly for U.S pork. The S&P GSCI Livestock ended the month 6.9% lower.

The posts on this blog are opinions, not advice. Please read our Disclaimers.

ESG in Australian Strategies: How Does It Look?

Contributor Image
Barbara Velado

Senior Analyst, Research & Design, Sustainability Indices

S&P Dow Jones Indices

The world of sustainable investing, better known for incorporating environmental, social and governance (ESG) criteria into what was before mostly financially driven investment decision-making, seems to be here to stay. As ESG index investing continues to evolve, so does our suite of ESG indices—expanding both in terms of methodologies and regions covered. Australia is no exception. In a recent paper, we looked at how a hypothetical ESG index of indices could provide tangible ESG benefits while not deviating much from a hypothetical baseline index of indices. Let’s see how.

How Were the Baseline and ESG Indices of Indices Constructed?

We can think about these as a collection of indices, with the baseline comprised of traditional market-cap-weighted indices and the ESG one made up of their respective ESG counterparts. Weights were assigned based on the latest Australian asset allocation data.1 The underlying ESG indices include a broad-based Australian ESG index, international carbon control indices, a global ESG real estate index and a global net zero 2050 infrastructure index. Each of these ESG index series were created to serve different investment and ESG objectives.

A Closer Look at the Underlying Indices

Exhibit 2 highlights how all of the ESG index variants have historically closely tracked their benchmark indices2 (annual tracking error ranging from 1.0% to 2.6%), while Exhibit 3 reflects the relationship between ESG gains and level of tracking error.

Most ESG indices displayed both S&P DJI ESG Score improvement and carbon intensity reductions at the index level (see Exhibit 3). The S&P Carbon Control Indices led for carbon intensity reduction, followed by the Dow Jones Brookfield Global Infrastructure Net Zero 2050 Climate Transition ESG Index. This is in line with both the indices’ objectives—to minimize carbon intensity and be compatible with a 1.5°C scenario, respectively. As for S&P DJI ESG Score improvement,3 the winners were the S&P ASX 200 ESG Index and Dow Jones Global Select ESG RESI, which were designed to raise index sustainability performance measured by the S&P DJI ESG Scores and the GRESB Scores, respectively.

Combining Underlying Indices into Baseline and ESG Indices of Indices

The ESG index of indices shows reductions in carbon intensity and fossil fuel reserve emissions close to 50%, as well as enhancements in the S&P DJI ESG Score and its dimensional environmental, social and governance scores, relative to the baseline index of indices (see Exhibit 4). All these ESG gains were attained for a low level of tracking error (0.81% annualized; see Exhibit 5).

We highlighted how a collection of ESG-focused indices could reflect substantial ESG improvements, from lower carbon intensity and minimized fossil fuel reserve emissions to improved S&P DJI ESG Scores, as well as dimensional E, S and G score enhancements, while closely tracking the baseline collection of indices. The variety of underlying sustainable indices used reflects the diverse nature of investment and ESG needs. Combined into a holistic strategy, ESG indices could present an effective, sustainable alternative to traditional cap-weighted benchmarks, helping drive sustainable strategies forward.


1 Based on back-tested data for the period analyzed.

2 Sourced from the Australian Prudential Regulation Authority (APRA). Available here.

3 S&P DJI ESG Score improvement is calculated as the difference between index-level ESG score of the ESG index and its benchmark.

The posts on this blog are opinions, not advice. Please read our Disclaimers.

Results from the SPIVA India Year-End 2021 Scorecard

Contributor Image
Benedek Vörös

Director, Index Investment Strategy

S&P Dow Jones Indices

The S&P Indices Versus Active (SPIVA®) Scorecard,1 published semiannually, measures the performance of actively managed funds against their corresponding benchmarks. The latest SPIVA India report provides a number of interesting insights about the performance of active versus passive across active fund categories.

1. Long-Term Outperformance of Active Funds Was Difficult

Indian bond funds had a tough time throughout the past decade, with most active bond managers underperforming their respective benchmarks over 1-, 3-, 5- and 10-year time horizons. Equity funds fared slightly better, with almost three-quarters of Indian ELSS active managers outperforming their benchmark in the past year and just over half of Indian Equity Mid-/Small-Cap managers outperforming over a three-year time horizon. Over a holding period of 5 or 10 years, however, most actively managed equity and bond funds underperformed, while a full 100% of Indian Composite Bond funds underperformed the S&P BSE India Government Bond Index over the past 10 years.

2. Government Bond Funds Have Struggled to Survive, While ELSS Funds Have Proven Long(er)-Lasting

The survivorship rates of Indian funds deteriorated over time across all categories, but the rate at which funds went extinct varied greatly across categories. While Indian ELSS funds have proven resilient, with over four-fifths surviving after 10 years, Indian Government Bond funds had the lowest survival rate, with 60% closing up after a decade.

3. There Was a Wide Dispersion in Active Fund Performance, Especially in the Mid-/Small-Cap Category

As we previously highlighted, Indian Mid-/Small-Cap managers fared better in the long run than active fund managers in other categories. While one may argue that long-term “alpha” exists in the mid-/small-cap space, identifying outperforming managers in advance can be difficult. The difference between a “good” and a “bad” choice is material. Highlighting the significant fund selection risk that investors face in this category, the interquartile range (which is the spread between the first and third quartile breakpoints of active funds in a given category) was a substantial 19% for Indian Mid-/Small-Cap funds in 2021, and over 4% annualized over the past decade.

1 SPIVA Scorecards: An Overview. https://www.spglobal.com/spdji/en/education/article/spiva-scorecards-an-overview

The posts on this blog are opinions, not advice. Please read our Disclaimers.

S&P Risk Parity Indices Outperformed in Q1 2022

Contributor Image
Berlinda Liu

Former Director, Multi-Asset Indices

S&P Dow Jones Indices

The S&P 500® lost 4.6% in the first quarter of 2022, with the market shaken by high inflation, the new variant of COVID-19 and geopolitical tensions in Europe. The S&P Risk Parity Indices, designed to offer diversified risk exposure across asset classes, stood the test and outperformed equities, as well as other active and passive risk parity benchmarks.

The S&P Risk Parity Index – 10% Target Volatility led the pack, with a quarterly return of -0.66%, followed by the S&P Risk Parity 2.0 Index – 10% Target Volatility (-2.77%). Both S&P Risk Parity Indices outperformed the HFR Risk Parity Index (-4.93%), which measures the weighted average return of risk parity active funds, and the Wilshire Risk Parity Index (-4.49%).

S&P Dow Jones Indices has two variations of risk parity index series, with several methodological differences between the two. The S&P Risk Parity Index Series, launched in 2018,1 was the first transparent, rules-based, tradable index series in the risk parity marketplace. Then in 2021, we launched the S&P Risk Parity 2.0 Indices, which are designed to offer a hedge against inflation risk for fixed income securities through a distinct TIPS allocation, while the S&P Risk Parity Indices tend to allocate more to commodities. In the past quarter, rising commodity prices helped the S&P Risk Parity Indices’ performance relative to S&P Risk Parity 2.0 Indices. For a complete comparison of these two index methodologies, please refer to my previous blog.

Risk factors such as inflation, geopolitical tensions, COVID-19 and rising rates will likely continue to be top of mind for market participants in the coming months. The S&P Risk Parity Index Series may help diversify and reduce risk exposure in the current market environment.

1 The S&P Risk Parity Index Series were relaunched in April 2020 to align the roll schedule of underlying securities with existing S&P DJI indices.

The posts on this blog are opinions, not advice. Please read our Disclaimers.

What Is New in S&P ESG Indices?

Contributor Image
Maria Sanchez

Director, Sustainability Index Product Management, U.S. Equity Indices

S&P Dow Jones Indices

In a recent public consultation, evolving investor sentiment and the changing needs of the ESG landscape were reflected through S&P DJI stakeholders’ feedback on the S&P ESG Indices. The results were published April 1, 2022.1 So, what are the changes?

  • Quarterly eligibility checks instead of annual to incorporate the latest available information on a more timely basis and to avoid including companies that violate eligibility criteria for a longer period
  • Additionally, an expanded and revised list of product involvement exclusions, including oil sands, small arms and military contracting exclusions
  • As well as a switch of United Nations Global Compact (UNGC) data provider from Arabesque to Sustainalytics.

EXCLUSIONS BASED ON BUSINESS ACTIVITIES

The adoption of negative screens has increasingly come into focus for many ESG strategies. This shift in preference was reflected in the additional exclusions covering:

  • Small Arms: Companies with any involvement in the manufacture or sale of small arms. Companies whose revenues from the retail or distribution of small arms are above or equal to 5%. Companies with significant ownership (above or equal to 25%) of companies that manufacture or sell small arms.
  • Military Contracting: Companies that manufacture military weapon systems or integral, tailor-made components of these weapons, or that provide tailor-made products or services that support military weapons with a revenue threshold greater than or equal to 10%.
  • Controversial Weapons: Companies with any revenue coming from providing components or services for the core weapon system, which are either not considered tailor-made or not essential to the lethal use of the weapon. Companies with significant ownership (above or equal to 25%) of the companies described above.
  • Oil Sands: Companies with revenue greater than or equal to 5% coming from oils sands extraction.

The consultation results also reflected the need for stricter rules around companies’ involvement in activities such as tobacco, which resulted in the lowering of the business involvement threshold from 10% to 5%. Tobacco was also one of the categories in which significant ownership exclusions will no longer be applied, so as to not unfairly penalize certain companies.

For companies involved in tobacco, thermal coal, oil sands, controversial weapons, small arms or military contracting, the consultation results have further defined certain maximum revenue thresholds. If a company generates revenue exceeding these thresholds, it will be excluded at the quarterly index eligibility review. Companies with business practices out of alignment with the UNGC will also be excluded at the quarterly index eligibility review.

Please see the following link for more information on the impact disclosed in the public consultation.

EXCLUSIONS BASED ON THE UNITED NATIONS GLOBAL COMPACT

S&P DJI will change the provider of UNGC data from Arabesque to Sustainalytics, and will exclude companies deemed to be non-compliant. Sustainalytics’ Global Standards Screening assesses companies’ impact and the extent to which a company causes, contributes or is linked to violations of international norms and standards such as the UNGC principles.

S&P DJI maintains its ongoing commitment to keep live ESG index methodologies relevant and match investor conviction. Methodology changes will be implemented in conjunction with the upcoming rebalancing.

1 To view all announcements, please see here.

The posts on this blog are opinions, not advice. Please read our Disclaimers.