Get Indexology® Blog updates via email.

In This List

Revisiting ETF Usage in Insurance General Accounts

Global Islamic Indices Lagged in Q1 2022 in a Reversal from 2021

The S&P PACT Indices: Leading the Net Zero Charge for Two Years

A Much-Anticipated Reversal of Fortunes for Latin American Equities

Finding a Factor Fit

Revisiting ETF Usage in Insurance General Accounts

Contributor Image
Raghu Ramachandran

Former Head of Insurance Asset Channel

S&P Dow Jones Indices

S&P Dow Jones Indices annually publishes an in-depth report that examines ETF usage within insurance general account portfolios, leveraging the Schedule D data from annual insurance company filings. Following a generally consistent upward trend, from 2019 to 2020, U.S. insurance companies increased their ETF AUM by 18% to USD 36.9 billion.1 An early look at 2021 data suggests this upward trend will continue.

Nuances in the reporting process make it challenging to cover the entire insurance universe at the time of publication. When we analyzed the use of ETFs in insurance general accounts in May 2021, the data available for the insurance industry was mostly complete—with 98.6% of companies reporting.2 As we begin the 2022 analysis, which examines 2021 data, the incomplete 2020 data now automatically captures late filings. As a result, when we publish the forthcoming report examining 2021 ETF usage, the 2020 data we cite as a point of comparison will be slightly different than what we reported last year. For transparency and completeness, we highlight those differences below.

Of note, P&C companies reported USD 1.8 billion in ETF investments.

We will publish the analysis of insurance ETF holdings, as of 2021 year-end, at the end of May. Subscribe to be notified when the report becomes available.


1 As of May 2021, when the report was published.

2 See Appendix 1.1 of “ETFs in Insurance General Accounts – 2021

The posts on this blog are opinions, not advice. Please read our Disclaimers.

Global Islamic Indices Lagged in Q1 2022 in a Reversal from 2021

Contributor Image
John Welling

Senior Director, Head of Global Equity Indices

S&P Dow Jones Indices

Global equities fell during the first quarter of the year, declining 5.5% as measured by the S&P Global BMI amid heightened volatility, surging inflation and the Russia-Ukraine conflict.

Shariah-compliant benchmarks, including the S&P Global BMI Shariah and Dow Jones Islamic Market (DJIM) World Index, underperformed their conventional counterparts during the quarter, as the Information Technology sector, which is overweight in Shariah indices, receded more than 10%. The Pan Arab region stood out, surging upward by 15.0% despite declines across every other global region.

Drivers of Q1 2022 Shariah Index Performance

While global equities enjoyed broad gains in 2021, the trend reversed in Q1 2022. Information Technology—which tends to hold an overweight position in global Islamic indices—fell 10.4%, contributing heavily toward negative returns during the quarter, and representing a course change following robust performance in 2021.

Energy was by far the best-performing sector—following a substantial rebound in 2021, the sector continued to surge in Q1 2022 amid supply constraints due to the Russia-Ukraine conflict. Due to its low weight in Islamic indices, however, the performance impact was relatively muted.

On a regional basis, high average weight toward the U.S. and Canada benefited the global Shariah index during the quarter, as those countries enjoyed the best regional performance during the period. The relative underperformance of Asia Pacific and Europe developed markets acted as a drag on returns.

MENA Equities Surge Higher

Supported by rising energy prices, MENA regional equities gained considerably, as the S&P Pan Arab Composite advanced 15.0%. All GCC country indices enjoyed double digit gains, led by the S&P United Arab Emirates BMI (up 19.0%), followed closely by the S&P Kuwait BMI (up 17.9%). Meanwhile, the S&P Egypt BMI (down 20.0%) and S&P Morocco BMI (down 8.9%) suffered steep losses, as they were conversely affected by global supply shocks,.

For more information on how Shariah-compliant benchmarks performed in Q1 2022, read our latest Shariah Scorecard.

This article was first published in IFN Volume 19 Issue 15 dated the 13th April 2022.

The posts on this blog are opinions, not advice. Please read our Disclaimers.

The S&P PACT Indices: Leading the Net Zero Charge for Two Years

Contributor Image
Kieran Trevor

Analyst, ESG Research & Design, ESG Indices

S&P Dow Jones Indices

Two years is a long time in the sphere of ESG. While the world wrestled with the worst pandemic in a century, S&P Dow Jones Indices (S&P DJI) shook the ESG indexing space and cemented its position as a leader in climate indices. April 20, 2022, marks the two-year anniversary of the launch of the first of the S&P PACT™ Indices (S&P Paris-Aligned & Climate Transition Indices), which aim to align with a 1.5⁰C scenario, the EU’s minimum standards for Climate Transition Benchmarks (CTBs) and Paris-aligned Benchmarks (PABs) and the recommendations of the Task Force on Climate-related Financial Disclosures (TCFD). Furthermore, the S&P PACT Indices go beyond the EU’s minimum standards for CTBs and PABs by using pioneering, forward-looking carbon and physical risk data provided by S&P Global Trucost, as well as incorporating Science Based Targets (SBTi) in its approach.

Exhibit 1 shows how the index series has changed since its launch, including expansion into new regions and index construction consultations, adapting to an ever-evolving sustainable investing landscape.

Performance Metrics

All S&P PACT Indices are designed to uphold their climate-related objectives while maintaining a similar sector and industry composition to their benchmarks, minimizing active risk. These objectives have held up well, as we can see in Exhibit 2, with each S&P PACT Index having stayed broadly close to its respective benchmark in terms of risk and return.

In fact, we see that most S&P PACT Indices have outperformed their market-cap-weighted underlying benchmarks over their history. Exhibits 3 display the S&P PACT Indices’ resilience to the market downturn during the pandemic, while the recent underperformance in 2022 coincides with the price surge in Energy stocks, which tend to be underweighted or excluded from each index (see our paper Exploring S&P PACT Indices Weight Attribution for further details).

Carbon Reduction

As reflected in the S&P PACT Index Methodology, one of the main requirements of the EU’s minimum standards for CTBs and PABs is the 7% year-over-year reduction in carbon intensity, a key component in staying aligned with a 1.5⁰C scenario. The use of the S&P Global Trucost Transition Pathway Model is a powerful way to help ensure each index within the S&P PACT Index Series aligns with a 1.5⁰C greenhouse gas (GHG) emission reduction pathway. The S&P Global Trucost Transition Pathway Model compares each S&P PACT Index constituent’s GHG emissions with its 1.5⁰C-aligned carbon budget, utilizing both forward- and backward-looking carbon data.

Exhibit 4 shows how S&P DJI’s sophisticated approach to the construction of the S&P PACT Indices has resulted in significantly improved carbon metrics relative to their benchmarks, going beyond the minimum standards set out by the EU PABs and CTBs.

Similarly, the S&P PACT Indices showed improvements in overall ESG performance (as measured by their S&P DJI ESG Score) relative to their market-cap-weighted benchmarks, as seen in Exhibit 5.

To conclude, despite significant uncertainty in global markets and geopolitics since their inception two years ago, the S&P PACT Indices have demonstrated their value by maintaining benchmark-like performance while meeting stringent climate objectives and aligning with a 1.5⁰C scenario. For an index focused on the long term, it doesn’t look half bad in the short term.

For further information on our net zero index solutions, please see here.

1 For the latest S&P PACT Index education piece, please see here.

2 For more on the first consultation, methodology changes, further exclusions and their effects on the indices, please see here.

3 For more on the second consultation, methodology changes, country and sector neutrality and their effects on the indices, please see here.

The posts on this blog are opinions, not advice. Please read our Disclaimers.

A Much-Anticipated Reversal of Fortunes for Latin American Equities

Contributor Image
Silvia Kitchener

Director, Global Equity Indices, Latin America

S&P Dow Jones Indices

The Latin American pendulum has swung back from negative to positive returns in the past three months. The S&P Latin America 40 ended the quarter up 29.5%, its best Q1 performance since 1991. This is in stark contrast to other global equity markets, which ended in the red, with the S&P 500® losing 4.6%, the S&P Europe 350® down 7.3% and the S&P Emerging BMI down 6.5%.

Two years into the COVID-19 pandemic, most of the world seems to be turning the corner, despite different variants continuing to appear. However, the uncertainty of the ups and downs of the virus is still leaving many countries in a scrambled state. Added to this, the Russia-Ukraine conflict has caused major geopolitical and macroeconomic shocks—most notably by triggering a sharp rise in commodity prices, which has broadly supported the Latin American region’s markets and economic activity. However, these benefits may ultimately be offset by some economic and political risks, such as rising inflation, ongoing supply chain disruptions and newly elected governments coming into play.

Despite the existing political, economic and social environment, the markets greatly rebounded in Q1. So much so that on March 31, 2022, the flagship indices for Mexico and Peru both reached their all-time highs. The S&P/BMV IRT, which was launched on Oct. 30, 1978, with a base value of 0.7816, ended March 2022 at a record high of 83,810.9. The S&P/BVL Peru General Index, which was launched on Jan. 31, 1992, at a base level of 108.55, closed March at an all-time high level of 24,915.50. All the other Latin American markets’ main indices also ended with positive returns. Exhibit 1 shows the strong returns among Latin American country headline indices contrasted with the negative returns across other major global regions.

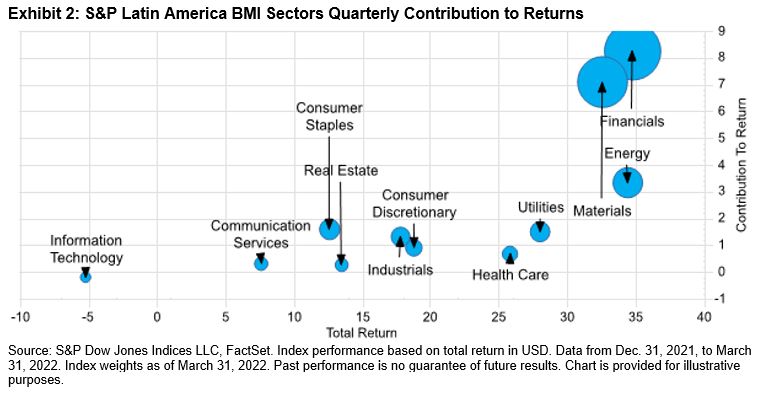
Which sectors were the biggest contributors to the regional performance? Based on the S&P Latin America BMI sectors, only Information Technology did poorly, losing 5.2% in Q1; all others had strong positive returns. Exhibit 2 shows the contribution of each sector to the total return of the S&P Latin America BMI. Financials (35.0%) and Materials (32.5%) were the largest sectors by weight, and in Q1, they made the largest contribution to the total return of the broad regional index.

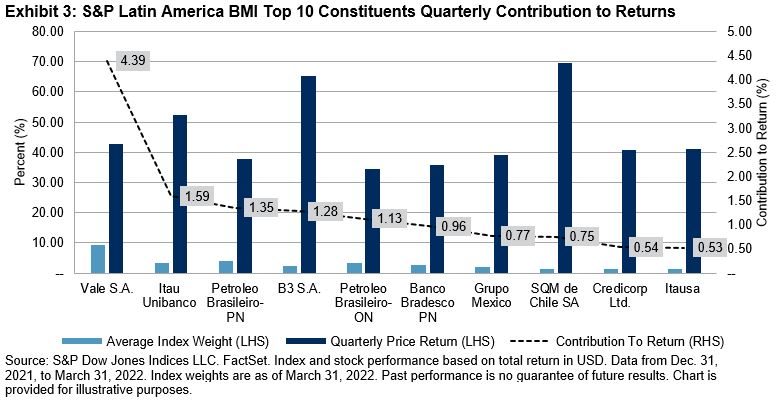
If we dig a little deeper, we can see that Latin American equity market gains were widespread. As shown in Exhibit 3, the S&P Latin America BMI gained 25.3% in Q1, with the index’s top 10 constituents representing approximately 13.3% of the total return. Brazil’s Vale S.A. (up 42.6% in Q1) was the largest contributor to returns, followed by Chile’s SQM (up 69.7% in Q1). Brazilian financial companies like B3 S.A. (up 65.2% in Q1), Itau Unibanco (up 52.3% in Q1) and Itausa (up 41.0% in Q1) also had a big hand in the pendulum’s swing.

Despite geopolitical turmoil and market volatility throughout the world, Latin American equities had a great start to the year. The prospects of the region will be dependent on the development of the Russia-Ukraine conflict and on the economic and social policies each government implements throughout the year.

For more information on how Latin American benchmarks performed in Q1 2022, read our latest Latin America Scorecard.

The posts on this blog are opinions, not advice. Please read our Disclaimers.

Finding a Factor Fit

How can three decades of factor index performance history help investors make more informed decisions and measure the effectiveness of active managers? Join S&P DJI’s Craig Lazzara and Anu Ganti for a closer look at factor performance across a range of market environments.

Learn more: https://www.spglobal.com/spdji/en/research/article/factor-indices-a-simple-compendium/

The posts on this blog are opinions, not advice. Please read our Disclaimers.