Get Indexology® Blog updates via email.

In This List

A Much-Anticipated Reversal of Fortunes for Latin American Equities

Finding a Factor Fit

S&P QVM Top 90% Indices: Looking under the Hood of the March 2022 Rebalance

Hedging Diversification Bets

Commodities Continued to March Higher Last Month

A Much-Anticipated Reversal of Fortunes for Latin American Equities

Contributor Image
Silvia Kitchener

Director, Global Equity Indices, Latin America

S&P Dow Jones Indices

The Latin American pendulum has swung back from negative to positive returns in the past three months. The S&P Latin America 40 ended the quarter up 29.5%, its best Q1 performance since 1991. This is in stark contrast to other global equity markets, which ended in the red, with the S&P 500® losing 4.6%, the S&P Europe 350® down 7.3% and the S&P Emerging BMI down 6.5%.

Two years into the COVID-19 pandemic, most of the world seems to be turning the corner, despite different variants continuing to appear. However, the uncertainty of the ups and downs of the virus is still leaving many countries in a scrambled state. Added to this, the Russia-Ukraine conflict has caused major geopolitical and macroeconomic shocks—most notably by triggering a sharp rise in commodity prices, which has broadly supported the Latin American region’s markets and economic activity. However, these benefits may ultimately be offset by some economic and political risks, such as rising inflation, ongoing supply chain disruptions and newly elected governments coming into play.

Despite the existing political, economic and social environment, the markets greatly rebounded in Q1. So much so that on March 31, 2022, the flagship indices for Mexico and Peru both reached their all-time highs. The S&P/BMV IRT, which was launched on Oct. 30, 1978, with a base value of 0.7816, ended March 2022 at a record high of 83,810.9. The S&P/BVL Peru General Index, which was launched on Jan. 31, 1992, at a base level of 108.55, closed March at an all-time high level of 24,915.50. All the other Latin American markets’ main indices also ended with positive returns. Exhibit 1 shows the strong returns among Latin American country headline indices contrasted with the negative returns across other major global regions.

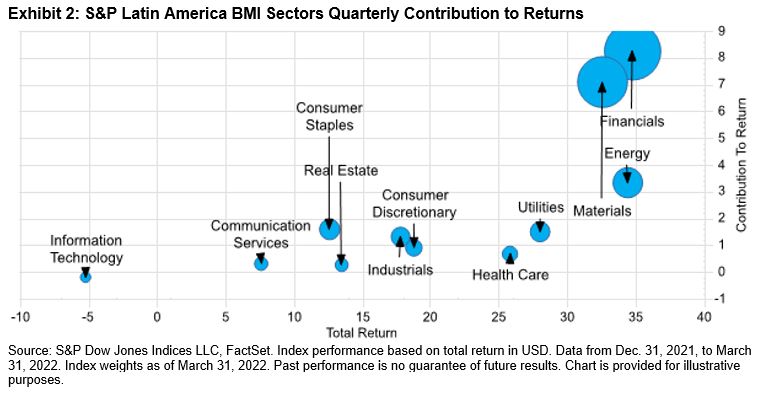
Which sectors were the biggest contributors to the regional performance? Based on the S&P Latin America BMI sectors, only Information Technology did poorly, losing 5.2% in Q1; all others had strong positive returns. Exhibit 2 shows the contribution of each sector to the total return of the S&P Latin America BMI. Financials (35.0%) and Materials (32.5%) were the largest sectors by weight, and in Q1, they made the largest contribution to the total return of the broad regional index.

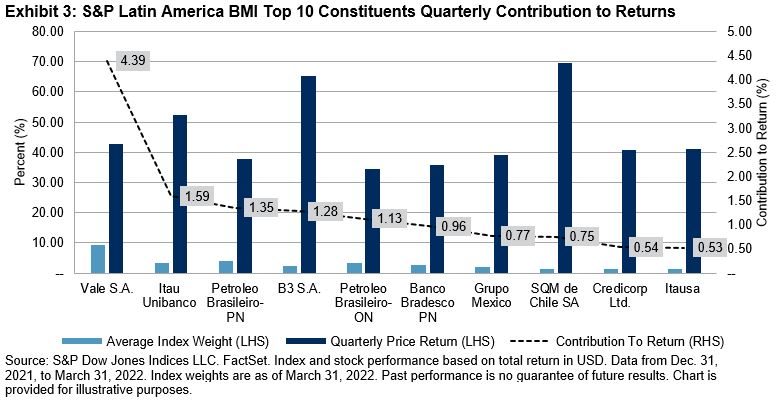
If we dig a little deeper, we can see that Latin American equity market gains were widespread. As shown in Exhibit 3, the S&P Latin America BMI gained 25.3% in Q1, with the index’s top 10 constituents representing approximately 13.3% of the total return. Brazil’s Vale S.A. (up 42.6% in Q1) was the largest contributor to returns, followed by Chile’s SQM (up 69.7% in Q1). Brazilian financial companies like B3 S.A. (up 65.2% in Q1), Itau Unibanco (up 52.3% in Q1) and Itausa (up 41.0% in Q1) also had a big hand in the pendulum’s swing.

Despite geopolitical turmoil and market volatility throughout the world, Latin American equities had a great start to the year. The prospects of the region will be dependent on the development of the Russia-Ukraine conflict and on the economic and social policies each government implements throughout the year.

For more information on how Latin American benchmarks performed in Q1 2022, read our latest Latin America Scorecard.

The posts on this blog are opinions, not advice. Please read our Disclaimers.

Finding a Factor Fit

How can three decades of factor index performance history help investors make more informed decisions and measure the effectiveness of active managers? Join S&P DJI’s Craig Lazzara and Anu Ganti for a closer look at factor performance across a range of market environments.

Learn more: https://www.spglobal.com/spdji/en/research/article/factor-indices-a-simple-compendium/

The posts on this blog are opinions, not advice. Please read our Disclaimers.

S&P QVM Top 90% Indices: Looking under the Hood of the March 2022 Rebalance

Contributor Image
Rupert Watts

Head of Factors and Dividends

S&P Dow Jones Indices

Since their launch in April 2021, the S&P Quality, Value, and Momentum Top 90% Multi-factor Indices (the “S&P QVM Top 90% Indices”) have been a great addition to our multi-factor lineup. These indices are designed to track companies in the top 90% of their respective underlying index universe, ranked by their multi-factor score.

To support this index series, we plan to publish quarterly blogs providing transparency into rebalance adds and drops. Exhibits 1, 2 and 3 summarize the March 2022 rebalance adds and drops for these indices, as well as the decile rank of their individual quality, value and momentum scores.

The 1st decile includes companies ranked in the top 10% of the universe (by their respective factor score), the 2nd decile includes companies ranked in the next highest 10%, and so on through to the 10th decile.

S&P 500® QVM Top 90% Index Rebalance Adds/Drops:

Since the December 2021 rebalance, Gap Inc. has been removed from the index as it moved to the S&P MidCap 400®, and IHS Markit has been removed since it merged with our parent company, S&P Global. This explains why there were 13 drops and 15 adds in the March 2022 rebalance.

Risk-adjusted return played a major role in the drops, with 61% in the 10th decile based on momentum score. Based on quality score, 30% of the drops were in the 10th decile, and based on value score, 38% were in the 10th decile.

Based on the overall multi-factor score rank, 40% of the adds ranked in the top half of the universe, mostly driven by quality and momentum.

S&P MidCap 400 QVM Top 90% Index Rebalance Adds/Drops:

Seven companies had been removed either due to corporate action related events or due to movements across the cap range since the December 2021 rebalance. Therefore, there were seven more adds than drops in the March 2022 rebalance.

Company fundamentals had a significant impact on the drops, as 75% were in the 10th decile based on value score. Based on momentum score, 50% of drops were in the 10th decile, and 25% were in the 10th decile based on quality score.

From reviewing the adds, 60% of companies had at least two factors ranked in the top half of the universe, and two-thirds were in the top half based on quality score rank.

S&P SmallCap 600® QVM Top 90% Index Rebalance Adds/Drops:

There were nine more adds than drops in the March 2022 rebalance, since nine companies had been removed either due to corporate action related events or movements across the cap range.

In terms of the drops, most of the companies ranked quite poorly across all three factors. Based on quality score, 44% of drops were in the 10th decile, 33% were in the 10th decile based on value score, and 33% were in the 10th decile based on momentum score.

With respect to the adds, about half were ranked in the top half of the universe based on momentum score.

Sector Weights

Due to the index construction methodology, significant deviations from the benchmark sector weight are uncommon. Exhibits 4, 5 and 6 show the pre- and post-rebalance active sector weights for each of the three S&P QVM Top 90% Indices.

Exhibit 4 shows that the relatively large underweight in the Consumer Discretionary sector has increased, as have the overweights in IT, Financials and Health Care.

For the S&P MidCap 400 universe, the largest underweights are in Health Care and IT, which increased and decreased, respectively. The largest overweights are in Financials and Consumer Discretionary.

For the S&P SmallCap 600 QVM Top 90% Index, Health Care has the largest underweight, at -1.35%, and Financials has the largest overweight, at 1.46%.

The posts on this blog are opinions, not advice. Please read our Disclaimers.

Hedging Diversification Bets

Contributor Image
Fei Mei Chan

Former Director, Core Product Management

S&P Dow Jones Indices

Low volatility strategies were designed for times like the ones we’ve experienced so far in 2022. Year-to-date through March 31, 2022, equities have struggled. In the U.S., the S&P 500® was down 4.6% YTD. The S&P Developed Ex-U.S. BMI and the S&P Emerging Plus LargeMidCap fared even worse, plummeting 5.6% and 6.7% YTD, respectively. But emerging markets have underperformed broader global benchmarks and the U.S. since long before the first quarter of 2022. In the past 25 years, the S&P Emerging Plus LargeMidCap gained 6.8%, while the S&P 500 was up 8.6%.

Hindsight, of course, is 20/20, and we don’t know how emerging markets will perform relative to their developed counterparts going forward. Often, people look to international markets to diversify their home-country investments—and with good reason. The correlation between the S&P 500 and S&P Emerging Plus LargeMidCap over the past 25 years was 0.74. Diversification may be the “only free lunch in finance,” but the performance of emerging markets does tend to be more volatile—49% more volatile than the S&P 500, to be precise.

What tend to be more reliable, however, are strategies that are explicitly designed to extract a certain pattern of returns relative to the broader market. In the past 25 years, the S&P BMI Emerging Markets Low Volatility Index returned 8.6%, compared with 6.8% for its underlying index.

By losing less when markets fall, low volatility strategies have typically outperformed over the long run. This phenomenon is observable universally across markets. The resulting performance pattern is captured in Exhibit 2, which shows the relative performance of the S&P BMI Emerging Markets Low Volatility Index (vertical axis) against the monthly performance of the S&P Emerging Plus LargeMidCap (horizontal axis).

In times of high stress, low volatility strategies tend to have more bandwidth to offer a buffer against volatility. This has proven to be true in the case of the S&P 500 and S&P 500 Low Volatility Index so far in 2022, declining 4.6% and 1.7%, respectively. It has been even more impactful in the case of emerging markets, where conditions are innately more volatile. In the first quarter of 2022, the S&P BMI Emerging Markets Low Volatility Index outperformed its underlying index by 11.3%.

The posts on this blog are opinions, not advice. Please read our Disclaimers.

Commodities Continued to March Higher Last Month

Contributor Image
Jim Wiederhold

Former Director, Commodities and Real Assets

S&P Dow Jones Indices

The S&P GSCI posted its best quarterly return in decades, as inflation continued to post the highest readings in decades. Commodities rose another 9.63% in March after an 8.8% rise in February. Geopolitical conflict and inflation were the two main reasons for the broad-based uptick in commodities prices (see Exhibit 1).

The S&P GSCI Energy continued to lead the way last month, up 12.47% in March. The uncertain supply situation from Russia, the world’s largest natural gas exporter and third largest oil exporter, led the U.S. to release a record amount of emergency oil from the Strategic Petroleum Reserve. Germany, highly dependent on Russian energy, initiated an emergency plan that could lead to energy rationing.

The S&P GSCI Agriculture rose 6.15%, as cotton and sugar rose by double digits, while coffee and soybeans dipped negative. The S&P GSCI Corn rose 8.44%, while the S&P GSCI Wheat rose 7.75% in March. Both grains were top exports from Russia and Ukraine but now shipments have been disrupted as the conflict continues and Black Sea ports have been sidelined. Egypt is highly dependent on wheat imports, with 80% coming from that region. Delayed shipments led the country to look to alternative countries such as the U.S. Wheat supplies in the U.S. are at their lowest levels in 14 years.

Within the S&P GSCI Industrial Metals, nickel recorded one of its biggest spikes in the history of the contract. After a wild ride with trading suspended after a massive short squeeze harangued the world’s largest nickel and stainless steel company, the S&P GSCI Nickel finished the month up 31.25%. The S&P GSCI Zinc rose 14.21%, as smelter production stalled and exchange stocks continued to move lower toward 15-year lows.

While all this volatility occurred in other sectors, the S&P GSCI Precious Metals quietly rose 2.70% due to its safe-haven status and a somewhat more cautious U.S. Fed tightening expectations caused tailwinds.

The posts on this blog are opinions, not advice. Please read our Disclaimers.