Get Indexology® Blog updates via email.

In This List

The Fed Is Doing What It Can – Will Emerging Markets Suffer What They Must?

Resilience to Rising Carbon Prices: Do Eurozone S&P PACT Indices Stand the Test?

Information Technology Has Evolved to Become a Consistent Presence in the S&P 500 Low Volatility Index

Introducing the S&P 500 Twitter Sentiment Index Series

No Time to Thrive

The Fed Is Doing What It Can – Will Emerging Markets Suffer What They Must?

Contributor Image
Benedek Vörös

Director, Index Investment Strategy

S&P Dow Jones Indices

                                        “The dollar is our currency, but it’s your problem.”

Former U.S. Treasury Secretary John Connally (Feb. 27, 1917 – June 15, 1993)

When John Connally uttered the famous words above, exactly 50 years ago today at a meeting of major finance ministers in Rome, it was just three months after the U.S. had unilaterally dismantled the post-World War II global monetary system known as Bretton Woods. The “problem” Connally referred to was a rapidly depreciating U.S. dollar, which threatened the competitiveness of exporters based in the U.S.’s main trading partners.

In the decades since, however, developing countries have faced the opposite challenge. Time and again, a bout of U.S. dollar strengthening has triggered turmoil in emerging economies that predominantly borrow abroad in foreign currencies, usually U.S. dollars. Thus, a strengthening U.S. dollar has increased emerging markets’ debt burden, depressing consumption and economic growth, and consequently leading to dismal domestic equity market returns.

The last such instance was triggered in May 2013, when then-Federal Reserve Chairman Ben Bernanke revealed plans to wind down the Fed’s gargantuan quantitative easing program, setting off a so-called “taper tantrum”: bond yields surged around the world, ex-U.S. stock prices tumbled, and a soaring greenback put severe strain on emerging market economies worldwide. Between May 2013 and December 2015, the S&P Emerging BMI dropped 16% in U.S. dollar terms, underperforming the S&P Developed BMI by 33%. A “Fragile Five” composed of Turkey, Brazil, Indonesia, India, and South Africa were particularly hard hit, underperforming by an average of 44% against the S&P Developed BMI.

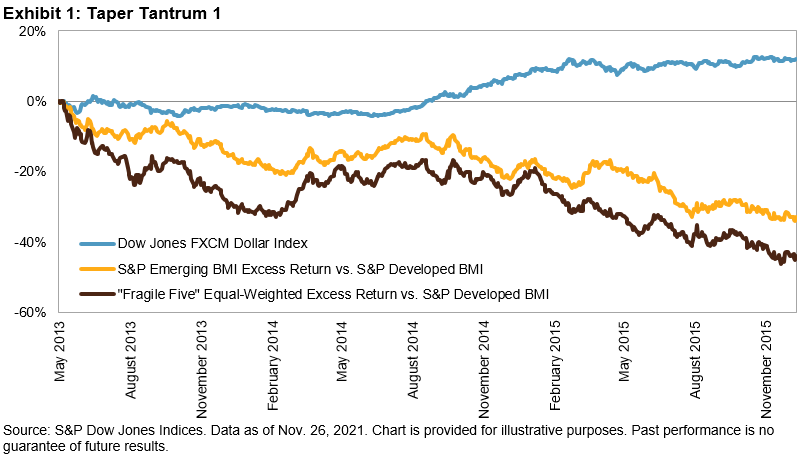
What made the “Fragile Five” particularly vulnerable? Factors included low foreign exchange reserves as a percentage of their external debt, and high current account deficits as a percentage of their GDP. Having perhaps learned their lessons, four out of the five have since made significant economic readjustments: India and South Africa swung from a current account deficit to a surplus, while Indonesia and Brazil cut their deficit by 87% and 49%, respectively. Turkey, on the other hand, remains highly vulnerable as the current account deficit barely budged, while the country’s FX reserves plummeted by 36% as a percentage of total external debt between the end of 2013 and 2020. India also increased its FX reserves significantly, from 70% to 105% of total external debt, while South Africa, Indonesia, and Brazil registered moderate decreases between 8%-14%.

As the Fed gets ready yet again to “taper,” the U.S. dollar has entered another round of strengthening. Since the start of June 2021, the Dow Jones FXCM Dollar Index, which is designed to measure the broad performance of the U.S. dollar against four developed market currencies, has risen 4%. Emerging market equities have also come under pressure, but a few of the former “Fragile Five” have fared considerably better than last time, particularly India. Since June 2021, the S&P India BMI is up 10%, compared to a 14% decline in the S&P Turkey BMI.

International allocators may be wise to heed the Greek historian Thucydides and distinguish between those currency regions well-positioned to weather the storm, and those more at risk from a rise in the dollar: “The strong do what they can, and the weak suffer what they must.”


The posts on this blog are opinions, not advice. Please read our Disclaimers.

Resilience to Rising Carbon Prices: Do Eurozone S&P PACT Indices Stand the Test?

Contributor Image
Barbara Velado

Senior Analyst, Research & Design, Sustainability Indices

S&P Dow Jones Indices

“Code red for humanity.” That’s how the imminent effects of climate change were described by the UN.1 Human-induced global warming stands at 1.1°C above pre-industrial levels, and will likely reach more than 2.7°C by 2100.2 If the world is to achieve the goals of the Paris Agreement and limit global warming to 1.5°C, decarbonization is the answer. The S&P PACTTM Indices (S&P Paris-Aligned & Climate Transition Indices) aim to align with the Paris Agreement goals and be compatible with net-zero emissions by 2050.

Carbon pricing encourages companies to reduce greenhouse gas (GHG) emissions, accelerating the transition to a low-carbon economy. Growing carbon prices have been observed within the EU Emissions Trading Scheme, whose price has surged 126.58% in one year.3

To curb global warming to 1.5°C, carbon prices would likely need to increase dramatically over the upcoming decades, much more than if that target were pushed to above 2°C. However, the uncertainty surrounding that increase is huge. Naturally, this translates into potential financial risk, as companies would have to either absorb the additional cost of their carbon emissions or pass it on to consumers—the so-called carbon price premium.

Using S&P Global Trucost’s Carbon Earnings at Risk dataset, we test whether the eurozone S&P PACT Indices show more financial resilience to a growing carbon price, or rather, if we observe lower portfolio earnings at risk, relative to its benchmark. Trucost developed the following three carbon price pathways.

  1. Low carbon price reflecting countries’ NDCs4
  2. Medium carbon price assuming a 2°C goal, but with short-term action delayed
  3. High carbon price aligned with the 2°C goal of the Paris Agreement

Sectors have different exposures to this transition risk, with Utilities and Materials being some of the most vulnerable to soaring carbon prices, given their operational nature.5

We examine the proportion of the eurozone S&P PACT Indices earnings at risk from potential rising carbon prices, as a percentage of earnings before interest, tax, depreciation, and amortization (EBITDA). Both the S&P Paris-Aligned (PA) Index and S&P Climate Transition (CT) Index carbon earnings at risk were lower than the underlying S&P Eurozone LargeMidCap under each scenario from 2020 to 2050.

If the world aligns with the Paris Agreement goals and adopts a high carbon price (shown by the dark purple bars and yellow lines), that implies both the PA and CT indices have 8.99% and 6.50% less portfolio earnings at risk by 2030 relative to their underlying index, respectively.6 When looking at 2050, that increases to 15.86% and 11.36%.

Trucost’s models suggest that the eurozone S&P PACT Indices are more financially robust on a forward-looking basis than their underlying market-cap-weighted index. The magnitude of their potential climate resiliency would be dependent on the specific climate trajectory the world ends up pursuing.

1 UN Secretary-General António Guterres’ statement on the Intergovernmental Panel on Climate Change (IPCC) Working Group 1 report on the physical science basis of the sixth assessment, available here.

2 Based on the Nationally Determined Contributions (NDCs)and pledges submitted as of 2020, the world is on track for 2.7°C of warming, according to the contribution from Working Group I on the IPCC AR6 Report: Climate Change 2021: The Physical Science Basis.

3 As of Sept. 30, 2021.

4 NDCs form the basis for countries to achieve the objectives of the Paris Agreement. They contain information on targets, policies, and measures for reducing national emissions and on adapting to climate change impacts (UNFCC, 2021).

5 Please note Trucost’s Carbon Earnings at Risk dataset only includes Scopes 1 and 2 of GHG emissions.

6 All data as of Sept. 1 2021.

The posts on this blog are opinions, not advice. Please read our Disclaimers.

Information Technology Has Evolved to Become a Consistent Presence in the S&P 500 Low Volatility Index

Contributor Image
Fei Mei Chan

Director, Core Product Management

S&P Dow Jones Indices

Equities in 2021 had a slow start, but as December approaches it looks to be another stellar year. Through Nov. 18, 2021, the S&P 500® was up 27%. For a strategy that is explicitly designed to mitigate risk, the S&P 500 Low Volatility Index’s year-to-date gain of “only” 17% is well within the range of reasonable expectations.

One-year volatility declined across all sectors of the S&P 500, with Information Technology experiencing the largest reduction.

Changes in the latest rebalance for the S&P 500 Low Volatility Index, effective after the market close on Nov. 19, 2021, were small. Notably, IT still holds a significant weight (9%) in the context of the history of the low volatility index. Since 2017, it has maintained a weight of 5% or more in the low volatility index, the lengthiest run in index history back to 1991.

Health Care pared its weight to 12% of the index. Consumer Staples, Utilities, and Industrials together accounted for more than half of the index. Energy’s weight remained at 0%.

For the broader S&P 500, IT’s underweight is still the largest difference between the S&P 500 Low Volatility Index and the S&P 500. The overweights in Utilities and Consumers Staples pick up the slack on the other end of the spectrum.

The posts on this blog are opinions, not advice. Please read our Disclaimers.

Introducing the S&P 500 Twitter Sentiment Index Series

Contributor Image
Therese Simberg

Director, Innovation and Strategy

S&P Dow Jones Indices

We are excited to introduce a new index series utilizing sentiment—the S&P 500® Twitter Sentiment Index Series, which adds another dimension to the way we measure broad U.S. equities.

Over the past few years, social media has evolved to encompass commentary about stocks and financial markets. As the technology has improved, these views are now able to be analyzed; as a result, it is possible to interpret and try to understand what the online community is saying about a specific company by aggregating an analysis of these messages. This index measures market sentiment using Twitter data, specifically Tweets containing $cashtags, which indicate that the Tweet is referring to a particular stock. S&P DJI uses artificial intelligence technology to analyze the sentiment around these stocks to generate a sentiment score for the companies within the S&P 500.

The S&P 500 Twitter Sentiment Indices have been created to reflect the performance of the companies in the S&P 500 that have the most positive sentiment, as indicated by the Twitter community. The index provides a means of examining whether the most positive sentiment names outperform their peers over a given period of time. Constant or building sentiment for the index members could lead to such outperformance, where changing sentiment might cause the opposite.

As of Nov. 18, 2021, the index series consists of the following indices:

S&P 500 Twitter Sentiment Index: This index is designed to track the performance of the 200 constituents with the most positive sentiment from the S&P 500, which are weighted on a float-adjusted market capitalization (FMC) basis, with a 10% cap at rebalance.

S&P 500 Twitter Sentiment Select Equal Weight Index: This index is designed to track the performance of a selection of the 50 constituents with the most positive sentiment from the S&P 500 Twitter Sentiment Index, which have been equally weighted at rebalance.

Both indices have been designed as diverse and liquid and actively filter for spam (lower-relevance Tweets), and each company included in the indices must have a sufficient number of Tweets to qualify.

Adding this exciting new dimension of analyzing and assessing sentiment in social media is just the start of this new chapter for S&P DJI. We are hoping to bring to market further factor-based, strategic indices capturing social media sentiment for the passive investment community, so stay tuned.


1Back-tested information reflects the application of the index methodology and selection of index constituents in hindsight. No hypothetical record can completely account for the impact of financial risk in actual trading. For example, there are numerous factors related to the equities, fixed income, or commodities markets in general which cannot be, and have not been accounted for in the preparation of the index information set forth, all of which can affect actual performance. The back-test calculations are based on the same methodology that was in effect on the index launch date. However, when creating back-tested history for periods of market anomalies or other periods that do not reflect the general current market environment, index methodology rules may be relaxed to capture a large enough universe of securities to simulate the target market the index is designed to measure or strategy the index is designed to capture. The back-test for the S&P Twitter Sentiment Indices is calculated for the period January 2018 to October 2021. S&P Dow Jones Indices designed the sentiment scoring model using data from approximately the same time range. The sentiment scoring model is a natural language processing tool based on linguistic classification of the degree to which a Tweet is likely to be positive or negative. Complete index methodology details are available at www.spdji.com. Past performance of the Index is not an indication of future results. Prospective application of the methodology used to construct the Index may not result in performance commensurate with the back-test returns shown.

The S&P 500 Twitter Sentiment Index is a product of S&P Dow Jones Indices LLC. S&P® and S&P 500® are registered trademarks of Standard & Poor’s Financial Services LLC; Twitter® is a registered trademark of Twitter, Inc. The Index is meant for informational purposes only and is not a recommendation to buy or sell any securities. Any investment entails a risk of loss. Please consult your financial advisor before investing.

The posts on this blog are opinions, not advice. Please read our Disclaimers.

No Time to Thrive

Contributor Image
Sherifa Issifu

Senior Analyst, U.S. Equity Indices

S&P Dow Jones Indices

S&P DJI has just released the final regional edition of our S&P Index Versus Active (SPIVA®) Mid-Year 2021 Scorecards. The semiannual reports cover the performance of actively managed funds in the U.S., Canada, Latin America, Europe, South Africa, India, Japan, Australia, and our newest regional addition, the Middle East and North Africa (MENA). SPIVA Scorecards offer a wealth of insights into the performance of active funds globally, including the percentage of all the available actively managed funds that underperformed an appropriate S&P DJI benchmark over various time horizons. Exhibit 1 summarizes the performance of domestically focused active funds across the various regions over the one-year period ending in June 2021.

In every region apart from Australia, most active funds underperformed. Intriguingly, although we often hear that index-based strategies “don’t work” as well in Emerging Markets, the rate of underperformance  was generally higher in those markets: 86% of Indian active managers failed to beat the S&P BSE 100, with similar underperformance among Mexican and Brazilian funds. This speaks to the shrinking alpha that is often seen as markets increasingly professionalize; put simply, it becomes harder and harder to remain “above average.”

Beyond the headline figures, the biannual reports dig into a wide range of specialized equity and fixed income fund categories and, as usual, the latest reports identify a few pockets where active managers had more reason to boast, and those markets where outperformance was hardest to find. Exhibit 2 shows the top underperforming and outperforming fund categories across all our regional reports. Canadian Dividend & Income Equity funds had the largest rate of underperformance, with more than 98% of funds underperforming the S&P/TSX Canadian Dividend Aristocrats®. At the other end of the spectrum, U.S. bond fund managers, in particular, stood out for their benchmark-beating returns (although the excellent 12-month record in the Government Long, U.S. Government/Credit Long, and Emerging Markets Debt fund categories is qualified by close to 100% underperformance over a 10-year horizon). The most extreme case of outperformance was among South African Short-Term Bond funds, with only 8% of active managers underperforming the STeFI Composite.

Turning to cross-region comparisons (summarized in Exhibit 3), the best active U.S. equity managers over the one-year period ending in June 2021 were, perhaps surprisingly, more likely to sit on a different continent than the stocks they managed, with 51% of Japanese and European active U.S. equity managers underperforming the S&P 500, versus the U.S.’s 58%. However, over the long run, U.S. active managers did achieve a better outperformance rate than other regional managers, not only in U.S. equities, but also across Global and Emerging Market equity market categories, too.

Explore the latest SPIVA scorecards at https://www.spglobal.com/spdji/en/research-insights/spiva/.

The posts on this blog are opinions, not advice. Please read our Disclaimers.