Get Indexology® Blog updates via email.

In This List

Gold Demand in India Bounced Back in 2021

Stretched Supply Chains Spur Commodities Prices Higher

Net Zero Index Strategies for Developed Markets

The S&P SmallCap 600 – A Sector-Led Bounce Back

Closing the Retirement Gap with Indices

Gold Demand in India Bounced Back in 2021

Contributor Image
Jim Wiederhold

Former Director, Commodities and Real Assets

S&P Dow Jones Indices

In 2020, pandemic-driven lockdowns in India caused gold demand to drop. So far in 2021, Indian demand for gold is 500 tons greater, even with two months left in the calendar year. China has been the primary destination for gold over the past few years and that continued this year, but a strong pickup in Indian demand coupled with lower growth in consumption from China is allowing India to gradually narrow the gap. According to the World Gold Council, jewelry demand rose 58% year-over-year in India in Q3 2021, compared with 32% growth in China over the same period. Similar year-over-year outperformance was seen in gold bar and coin investment growth from India versus China. Depending on demand in Q4 2021 with the Diwali festival, India could return to peak levels last seen in 2013. That year was the last time India was the number one destination for gold, beating out China.

There are a few positive catalysts helping the second most populous country in Asia. The government lowered the import duty to 7.5% from the prior 12.5%, making it cheaper to buy in India this year. Previously, a relatively high duty compared with other major economies dampened demand somewhat, but the sheer size of gold jewelry demand in India seemed to always overcome this headwind. This is less of a headwind after the reduction.

Pent-up demand after a once-in-100-years pandemic played a role in the massive increase this year. Base effects distorted most economic data at some point, but the increase in demand was unexpected by most analysts. India was hit hard by COVID-19 but each time restrictions were lifted, imports picked up. Gold imports initially contracted sharply in May and June 2021, but surged from July through September from pent-up demand for weddings and improved business sentiment in the gems and jewelry industry, according to the Reserve Bank of India.

Switzerland is the world’s largest exporter of gold and the origin of half of India’s gold imports in a typical year. The percentage of India’s total gold imports coming from Switzerland has been on the rise over the past few years, as it is known for having some of the best gold refineries producing the finest quality gold.

With the Diwali season providing a strong backdrop for gold demand, the typically price-sensitive Indian buyers are seeing gold as more attractive at these lower levels compared with last year. During this festive time, gold may find its footing again as the market turns attention back to the precious metal.

The posts on this blog are opinions, not advice. Please read our Disclaimers.

Stretched Supply Chains Spur Commodities Prices Higher

Contributor Image
Fiona Boal

Managing Director, Global Head of Equities

S&P Dow Jones Indices

The S&P GSCI, the broad commodities benchmark, rallied 5.8% in October. Performance was solid across sectors, with energy-related commodities continuing to outperform and grains and metals regaining some of their recent weakness. With two months of the year remaining, the S&P GSCI is up 46.3% YTD, the index’s best performance over the first 10 months of a calendar year in its 30-year history.

Natural gas prices in Europe and coal prices in China lost some of their luster in October, with countries intervening after record price spikes in September. The S&P GSCI Natural Gas fell 10.0%, as Russia came to the rescue promising more exports to Europe. The S&P GSCI Petroleum continued higher by 9.7%, almost matching the prior month’s strong performance. A perfect storm of catalysts from delayed production increases, strong global demand, and logistics issues were still very much in play in global energy markets.

Most commodities within the agriculture space rallied in October, with the S&P GSCI Agriculture ending the month 3.6% higher. The S&P GSCI Kansas Wheat jumped 7.4% over the month. Strong import demand, poor spring wheat harvests, and an export duty imposed by Russia have heightened expectations of relatively tight global wheat supplies this season. For the second consecutive month, S&P GSCI Cotton was the best performer in the agriculture complex, rallying 8.6%. The rally has been fuelled by optimist estimates of demand, as consumers emerge from COVID-19 restrictions, while the overall harvesting pace for the U.S. crop has been slowed by various forms of weather adversities and maturation rates.

The S&P GSCI Livestock fell 1.5% in October, with lean hog prices tumbling. Hog supplies in the U.S. continue to greatly outpace demand. U.S. pork exports to China have fallen for the last three months, while record pork prices in the domestic market are having a negative impact on per capita consumption.

Most industrial metals charged higher in October, while the S&P GSCI Aluminum was the only one to cool off by 4.9%, but it still showed a sector-best 34.4% YTD performance. The remaining major LME-traded industrial metals rose each by at least 7.0%. The S&P GSCI Zinc hit a 14 year high after major smelters around the world cut output on the back of higher power costs. The S&P GSCI Lead lagged the other industrial metals YTD, but lead the way in October by rising 15.2%.

Gold enjoyed a modest revival in October, with the S&P GSCI Gold gaining 1.5%. After lagging other inflation-sensitive assets for most of 2021, and with inflation showing few signs of abating, market participants may be reassessing their gold positions. On the flip side, while gold is considered an inflation hedge, reduced stimulus and interest rate hikes would likely push government bond yields and the U.S. dollar up, denting non-yielding gold’s appeal.

The posts on this blog are opinions, not advice. Please read our Disclaimers.

Net Zero Index Strategies for Developed Markets

Contributor Image
Ben Leale-Green

Former Associate Director, Research & Design, ESG Indices

S&P Dow Jones Indices

The S&P PACTTM Indices (S&P Paris-Aligned & Climate Transition Indices) comprise the S&P Climate Transition (CT) Indices and the more ambitious S&P Paris-Aligned (PA) Indices. These indices are intended to meet the EU’s minimum standards for EU Climate Transition benchmarks and EU Paris-aligned benchmarks under the Regulation (EU) 2016/1011 (EU Benchmark Regulation). The indices follow a 1.5°C scenario toward net zero by 2050 and incorporate recommendations of the Task Force on Climate-related Financial Disclosures (TCFD). This blog focuses on the S&P PA Index for developed markets (the S&P Developed Ex-Korea LargeMidCap Net Zero 2050 Paris-Aligned ESG Index).

What are the high-level ESG exposures? The indices show improvements across a large range of climate and ESG factors, including physical risks, transition risks, and opportunities, alongside environmental, social, and governance exposure improvements.

Which ESG factors are important in driving the weights of the index? First, approximately 23% of the weight from the investable universe is excluded and a further 16% active share (which measures the percentage of index weights that differ from the underlying index) is taken on from reweighting.

The active share from exclusions is easy to quantify—it is simply the excluded weight of the underlying index. The active share from reweighting is attributed to climate factors (see Exhibit 3), largely caused by the transition pathway (aligning with 1.5°C on a forward-looking basis), high impact revenues (to maintain neutrality, per the EU Benchmark Regulation), physical risk, and ESG scores.

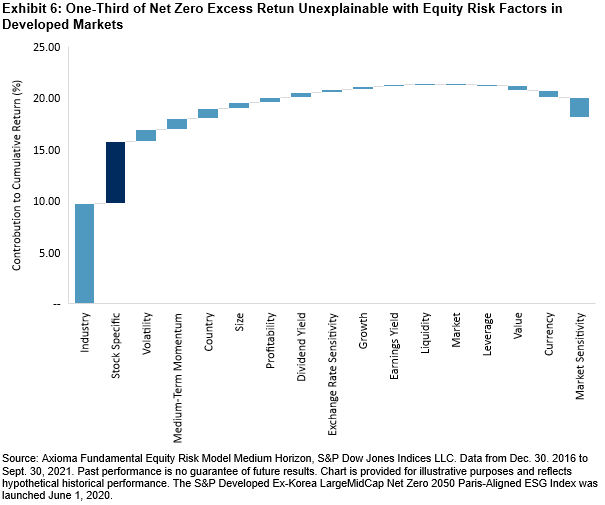
How has the index performed? We see an excess return from the S&P Paris-Aligned Index, with lower volatility and max drawdown, resulting in a higher risk-adjusted return. Of this excess return, around two-thirds can be explained by equity risk factors, leaving around one-third of the excess return as unexplained alpha (stock specific).

To learn more about the S&P PACT Indices, we have a short overview and longer paper to explain some technical details, both of which and much more can be found on our Net Zero investment theme page.

The posts on this blog are opinions, not advice. Please read our Disclaimers.

The S&P SmallCap 600 – A Sector-Led Bounce Back

Contributor Image
Garrett Glawe

Former Managing Director, Head of U.S. Equity Indices

S&P Dow Jones Indices

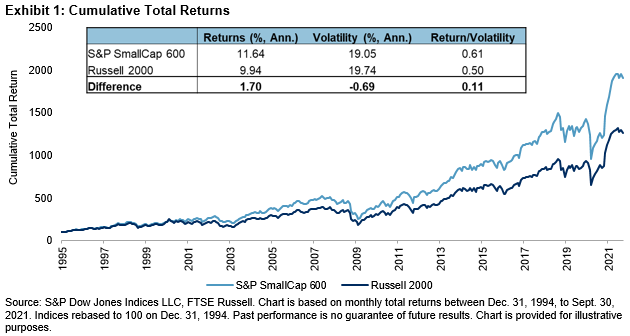
For over 11 years, S&P Dow Jones Indices has been exploring the long-term, persistent outperformance of the S&P SmallCap 600® relative to the Russell 2000. As shown in Exhibit 1, the S&P 600TM has outperformed the Russell 2000 by 1.70% on an annualized basis from Dec. 31, 1994, to Sept. 30, 2021. The S&P 600 has also experienced slightly lower volatility.

The S&P 600’s historical outperformance has been consistent over various rolling time periods, especially over longer horizons. Indeed, Exhibit 2 shows that the S&P 600 outperformed the Russell 2000 in 202 of the 310 (or 65%) rolling one-year periods between Dec. 31, 1994, and Sept. 30, 2021. The frequency of outperformance increased with the time horizons.

Despite the long-term track record, there have been periods where the S&P 600 has underperformed. For example, the S&P 600 underperformed by 8.86% and 8.65% in 1999 and 2020, respectively. These were the two worst calendar year periods for the S&P 600, based on relative returns. However, both examples were followed by substantial bounce backs in the following year. The S&P 600’s best year of relative performance came in 2000 (up 14.83%), and the S&P 600 has outperformed the Russell 2000 by 7.64% YTD in 2021, as of Sept. 30, 2021.

So, what has been behind this recent turnaround?

A large part of the relative performance in 2020 and 2021 can be explained by the exposure of each index to a single sector—Health Care. Exhibits 4 and 5 show a Brinson Attribution for 2020 and YTD 2021, using the S&P 600 as the portfolio and the Russell 2000 as the benchmark. Here we use the iShares Russell 2000 ETF as a proxy for the Russell 2000, so the returns do not tie out exactly to Exhibit 3.

In Exhibit 4, the Total Effect column on the far right shows that the S&P 600 underperformed the Russell 2000 by 8.59% in 2020. The rows in the table show the 11 GICS® sectors along with the two industry groups within the Health Care sector. The Contribution to Return columns indicates how much each sector or industry group contributed to the relative return for each index.

In 2020, we can see that the S&P 600 had an average weight of 12.62% in the Health Care sector compared with 20.51% for the Russell 2000, resulting in an underweight of 7.89%. The Health Care sector contributed -4.21% to the -8.59% relative performance of the S&P 600 (or 49%). We can further decompose the performance of the Health Care sector into an allocation effect (the impact of underweighting the sector) of -1.84% and selection effect (the impact of selecting stocks that underperformed their peers in the sector) of -2.37%. Drilling further into the industry groups within the Health Care sector, we can see that Pharmaceuticals, Biotechnology & Life Sciences was the largest contributor, at -2.67%.

Turning to Exhibit 5, we can see that the story of 2020 has largely reversed in 2021. The S&P 600 has remained underweight in Health Care (-8.14%), but this year the sector has underperformed the broad small-cap market significantly. Year-to-date, the S&P 600 outperformed the Russell 2000 by 7.07%, indicated by the Total Effect column on the far right. The Health Care sector accounted for 3.30% (or 47%) of the outperformance. Looking at the industry groups within the Health Care sector, we can see that Pharmaceuticals, Biotechnology & Life Sciences has contributed most of the outperformance, at 2.90%.

Since Dec. 31, 1994, the S&P 600 has outperformed the Russell 2000 by 1.70% annualized. This outperformance has been consistent through time, particularly when we look at longer time horizons. However, when we look at annual returns, we can see periods when the S&P 600 has underperformed. The two worst years of relative performance for the S&P 600 (1999 and 2020) have been followed by significant bounce backs the following year. Year-to-date in 2021, much of that bounce back can be attributed to the S&P 600 having less exposure to health care companies compared with the Russell 2000.

The posts on this blog are opinions, not advice. Please read our Disclaimers.

Closing the Retirement Gap with Indices

How can indices help retirees achieve retirement income goals? Nobel Laureate and Resident Scientist at Dimensional Fund Advisors, Dr. Robert Merton joins S&P DJI’s Dan Draper and Aye Soe for a deep dive into the U.S. retirement ecosystem.

The posts on this blog are opinions, not advice. Please read our Disclaimers.