Get Indexology® Blog updates via email.

In This List

Net Zero Index Strategies for Developed Markets

The S&P SmallCap 600 – A Sector-Led Bounce Back

Closing the Retirement Gap with Indices

A Deeper Dive into the Digital Assets Ecosystem

Measuring the Impact of Generosity

Net Zero Index Strategies for Developed Markets

Contributor Image
Ben Leale-Green

Former Associate Director, Research & Design, ESG Indices

S&P Dow Jones Indices

The S&P PACTTM Indices (S&P Paris-Aligned & Climate Transition Indices) comprise the S&P Climate Transition (CT) Indices and the more ambitious S&P Paris-Aligned (PA) Indices. These indices are intended to meet the EU’s minimum standards for EU Climate Transition benchmarks and EU Paris-aligned benchmarks under the Regulation (EU) 2016/1011 (EU Benchmark Regulation). The indices follow a 1.5°C scenario toward net zero by 2050 and incorporate recommendations of the Task Force on Climate-related Financial Disclosures (TCFD). This blog focuses on the S&P PA Index for developed markets (the S&P Developed Ex-Korea LargeMidCap Net Zero 2050 Paris-Aligned ESG Index).

What are the high-level ESG exposures? The indices show improvements across a large range of climate and ESG factors, including physical risks, transition risks, and opportunities, alongside environmental, social, and governance exposure improvements.

Which ESG factors are important in driving the weights of the index? First, approximately 23% of the weight from the investable universe is excluded and a further 16% active share (which measures the percentage of index weights that differ from the underlying index) is taken on from reweighting.

The active share from exclusions is easy to quantify—it is simply the excluded weight of the underlying index. The active share from reweighting is attributed to climate factors (see Exhibit 3), largely caused by the transition pathway (aligning with 1.5°C on a forward-looking basis), high impact revenues (to maintain neutrality, per the EU Benchmark Regulation), physical risk, and ESG scores.

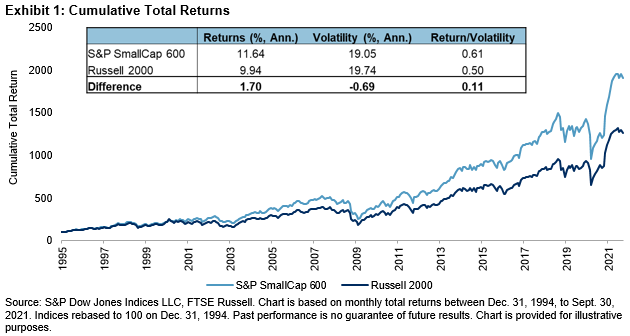
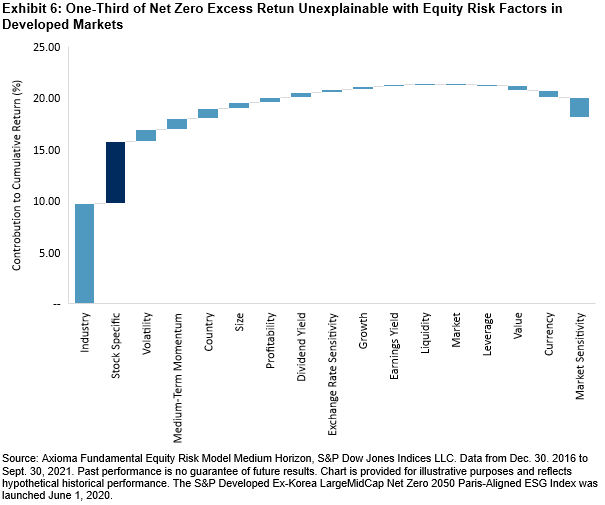
How has the index performed? We see an excess return from the S&P Paris-Aligned Index, with lower volatility and max drawdown, resulting in a higher risk-adjusted return. Of this excess return, around two-thirds can be explained by equity risk factors, leaving around one-third of the excess return as unexplained alpha (stock specific).

To learn more about the S&P PACT Indices, we have a short overview and longer paper to explain some technical details, both of which and much more can be found on our Net Zero investment theme page.

The posts on this blog are opinions, not advice. Please read our Disclaimers.

The S&P SmallCap 600 – A Sector-Led Bounce Back

Contributor Image
Garrett Glawe

Former Managing Director, Head of U.S. Equity Indices

S&P Dow Jones Indices

For over 11 years, S&P Dow Jones Indices has been exploring the long-term, persistent outperformance of the S&P SmallCap 600® relative to the Russell 2000. As shown in Exhibit 1, the S&P 600TM has outperformed the Russell 2000 by 1.70% on an annualized basis from Dec. 31, 1994, to Sept. 30, 2021. The S&P 600 has also experienced slightly lower volatility.

The S&P 600’s historical outperformance has been consistent over various rolling time periods, especially over longer horizons. Indeed, Exhibit 2 shows that the S&P 600 outperformed the Russell 2000 in 202 of the 310 (or 65%) rolling one-year periods between Dec. 31, 1994, and Sept. 30, 2021. The frequency of outperformance increased with the time horizons.

Despite the long-term track record, there have been periods where the S&P 600 has underperformed. For example, the S&P 600 underperformed by 8.86% and 8.65% in 1999 and 2020, respectively. These were the two worst calendar year periods for the S&P 600, based on relative returns. However, both examples were followed by substantial bounce backs in the following year. The S&P 600’s best year of relative performance came in 2000 (up 14.83%), and the S&P 600 has outperformed the Russell 2000 by 7.64% YTD in 2021, as of Sept. 30, 2021.

So, what has been behind this recent turnaround?

A large part of the relative performance in 2020 and 2021 can be explained by the exposure of each index to a single sector—Health Care. Exhibits 4 and 5 show a Brinson Attribution for 2020 and YTD 2021, using the S&P 600 as the portfolio and the Russell 2000 as the benchmark. Here we use the iShares Russell 2000 ETF as a proxy for the Russell 2000, so the returns do not tie out exactly to Exhibit 3.

In Exhibit 4, the Total Effect column on the far right shows that the S&P 600 underperformed the Russell 2000 by 8.59% in 2020. The rows in the table show the 11 GICS® sectors along with the two industry groups within the Health Care sector. The Contribution to Return columns indicates how much each sector or industry group contributed to the relative return for each index.

In 2020, we can see that the S&P 600 had an average weight of 12.62% in the Health Care sector compared with 20.51% for the Russell 2000, resulting in an underweight of 7.89%. The Health Care sector contributed -4.21% to the -8.59% relative performance of the S&P 600 (or 49%). We can further decompose the performance of the Health Care sector into an allocation effect (the impact of underweighting the sector) of -1.84% and selection effect (the impact of selecting stocks that underperformed their peers in the sector) of -2.37%. Drilling further into the industry groups within the Health Care sector, we can see that Pharmaceuticals, Biotechnology & Life Sciences was the largest contributor, at -2.67%.

Turning to Exhibit 5, we can see that the story of 2020 has largely reversed in 2021. The S&P 600 has remained underweight in Health Care (-8.14%), but this year the sector has underperformed the broad small-cap market significantly. Year-to-date, the S&P 600 outperformed the Russell 2000 by 7.07%, indicated by the Total Effect column on the far right. The Health Care sector accounted for 3.30% (or 47%) of the outperformance. Looking at the industry groups within the Health Care sector, we can see that Pharmaceuticals, Biotechnology & Life Sciences has contributed most of the outperformance, at 2.90%.

Since Dec. 31, 1994, the S&P 600 has outperformed the Russell 2000 by 1.70% annualized. This outperformance has been consistent through time, particularly when we look at longer time horizons. However, when we look at annual returns, we can see periods when the S&P 600 has underperformed. The two worst years of relative performance for the S&P 600 (1999 and 2020) have been followed by significant bounce backs the following year. Year-to-date in 2021, much of that bounce back can be attributed to the S&P 600 having less exposure to health care companies compared with the Russell 2000.

The posts on this blog are opinions, not advice. Please read our Disclaimers.

Closing the Retirement Gap with Indices

How can indices help retirees achieve retirement income goals? Nobel Laureate and Resident Scientist at Dimensional Fund Advisors, Dr. Robert Merton joins S&P DJI’s Dan Draper and Aye Soe for a deep dive into the U.S. retirement ecosystem.

The posts on this blog are opinions, not advice. Please read our Disclaimers.

A Deeper Dive into the Digital Assets Ecosystem

Contributor Image
Sharon Liebowitz

Former Head of Innovation

S&P Dow Jones Indices

S&P Dow Jones Indices launched the S&P Cryptocurrency Indices in May. The indices have shown historically high annualized returns accompanied by significant volatility and downside risk. One of the goals of indexing is to bring accessibility and transparency to markets, and we believe that launching indices with a trusted price provider, Lukka, has allowed market participants to understand the relative growth of various cryptocurrencies, and the overall cryptocurrency market, over time. Our entrance into the market reflects our perception that the asset class is gathering broad appeal among market participants. According to a recent study by Fidelity, 70% of all institutional investors surveyed had a neutral-to-positive perception of digital assets.1 And as broad appeal increases, we believe the market and its surrounding ecosystem will continue to grow in size and complexity.

Our recently published paper, “Bringing Transparency to an Emerging Asset Class: S&P Cryptocurrency Indices,” takes a deeper look at several issues to highlight some key features of this growing market.

Rapid growth of the asset class. One indicator of rapid growth is the number of eligible constituents for the S&P Cryptocurrency Broad Digital Market (BDM) Index. Exhibit 1 illustrates the number of constituents and market cap of the S&P Cryptocurrency BDM Index. This growth in constituents is largely driven by increased market cap (defined by coin supply x price) of many coins beyond Bitcoin and Ethereum. As measured by back-tested data, the number of coins meeting these criteria has grown over the years, especially over the period from March-June 2021. As of Sept. 21, 2021, there were 240 coins that met the minimum requirements to be eligible for the S&P Cryptocurrency BDM Index.

Asset-level characteristics. Cryptocurrencies are not identical in terms of what they offer. Many coins have features that provide utility beyond being a store of value. In general, a number of coins may be used to pay fees on a platform or network and given out as rewards for the operation of a network. These features, in addition to potential momentum created by investor interest, may add to their value as an asset. While these coins are not equity, holding them may allow a user to participate in the growth of a platform. Many coins perform non-financial functions as well—including governance, storage, infrastructure, gaming, and more. An analysis of the correlations among coins within the S&P Cryptocurrency LargeCap Index in the report showed a varied range, affirming our discussion that coins have different profiles.

Correlation. There is currently a low correlation between the S&P Cryptocurrency Indices and other asset classes, as shown in Exhibit 2. This low correlation can help provide strategies for diversification—an important consideration, as investors consider adding cryptocurrency exposure to their portfolios. In addition, Exhibit 2 shows that the S&P Ethereum Index has a lower correlation to other indices in the S&P Cryptocurrency Series. Relationships between cryptos and other asset classes are expected to evolve as this asset class matures.

For more information on comparative performance of the S&P Cryptocurrency Indices with traditional assets, liquidity of the index constituents, rolling correlations, and more, see our report “Bringing Transparency to an Emerging Asset Class: S&P Cryptocurrency Indices”.

Learn more about the S&P Cryptocurrency Index methodology here.


1 THE INSTITUTIONAL INVESTOR DIGITAL ASSETS STUDY, Fidelity Digital Assets, September 2021.  https://www.fidelitydigitalassets.com/bin-public/060_www_fidelity_com/documents/FDAS/2021-digital-asset-study.pdf

The posts on this blog are opinions, not advice. Please read our Disclaimers.

Measuring the Impact of Generosity

How do the philanthropic efforts of public companies impact returns? S&P DJI’s Michael Mell explores a custom index designed to track the 50 most generous companies with Earl Bridges, CEO of Uncommon Giving and Claire Gaudiani, Board Member at Uncommon Investment Funds Trust and author of The Greater Good: How Philanthropy Drives the American Economy and Can Save Capitalism.

The posts on this blog are opinions, not advice. Please read our Disclaimers.