Get Indexology® Blog updates via email.

In This List

Global Diversification Trending in India – Time to Notice?

S&P MAESTRO 5 Index: A Sophisticated Composition Designed to Simplify Risk Management

Chugging Along

Performance Characteristics of the New S&P U.S. SPAC Index

Headwinds on the Active Horizon

Global Diversification Trending in India – Time to Notice?

Contributor Image
Koel Ghosh

Former Head of South Asia

S&P Dow Jones Indices

The merit of international diversification seems to have proven itself lately in the context of the Indian market. Over the past year, interest has increased in adding global exposures to local investment portfolios. Global markets offer the potential opportunity to diversify beyond a traditional concentrated focus on local markets.

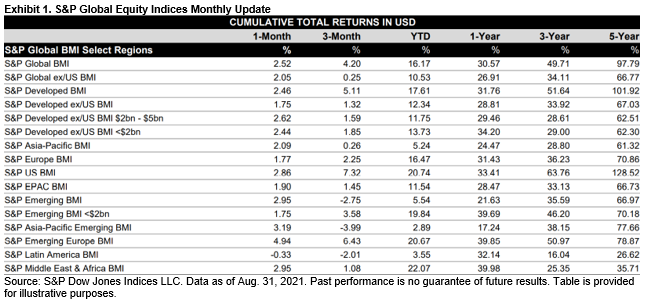
The latest August Global Equity Dashboard reflected the upward trend of global equities, with the S&P Global BMI posting a YTD return of 16% and a one-year return of 30%. The S&P Global BMI is an index that is designed to measure more than 11,000 stocks from 25 developed and 25 emerging markets. The S&P United States BMI and the S&P Emerging Europe BMI have had YTD returns of over 20%, which has resulted in increased interest for allocation in those regions. Furthermore, 44 of the 50 country subindices of the S&P Global BMI gained in the last month. The U.S. had the most significant weight, around 57.5%,1 in the S&P Global BMI in terms of country exposure.

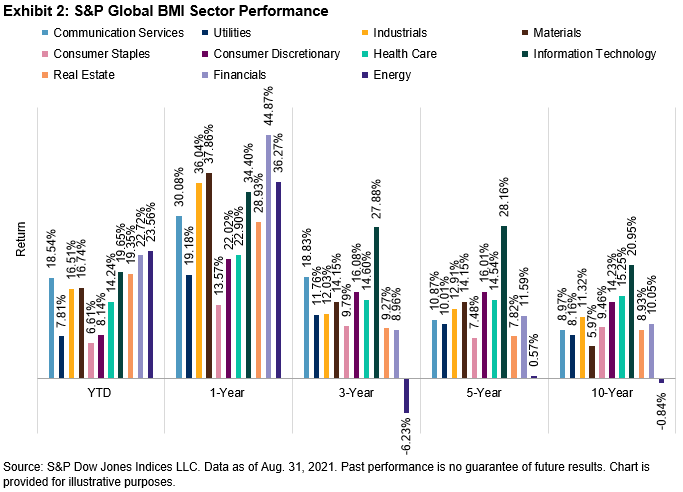
Looking at sector performance, Information Technology led in the 3-, 5-, and 10-year periods, while the 1-year period favored Financials (44.87%), Materials (37.86%), and Energy (36.27%). However, the trend shifted YTD, with Energy (23.56%) outperforming and Financials (22.72%) and Information Technology (19.65%) close behind.

The U.S. markets have been gaining popularity in India among other global options. The S&P 500®, the best single gauge of large-cap U.S. equities, has gained popularity among Indian investors. The index posted its seventh straight month of gains in August, climbing 3.0% for the month supported by positive earnings and continued support from the Fed. The options available for global diversification are growing beyond plain vanilla domestic strategies. Thematic, strategy, and sustainable factors are also becoming available to add additional flavor.

India is known for its home bias, but that trend was bucked last year and has continued YTD. Fund of funds investing overseas have grown more than eight-fold since year-end 2019 from INR 2635 crores to INR 21441 crores in August 2021,2 with a 137% growth YTD. While the number of schemes has not increased significantly, the Indian passive market is looking to offer more options for global diversification. The last year has witnessed a host of new passive product filings, with the Securities and Exchange Board of India clearly demonstrating the growing appetite for international investing among local investors.

1 As of Aug. 31, 2021

2 Source : AMFI

The posts on this blog are opinions, not advice. Please read our Disclaimers.

S&P MAESTRO 5 Index: A Sophisticated Composition Designed to Simplify Risk Management

Get to know the S&P MAESTRO 5 Index, a diversified, multi-asset, multi-factor risk parity strategy designed to help investors hit the right notes across a range of market conditions.

The posts on this blog are opinions, not advice. Please read our Disclaimers.

Chugging Along

Contributor Image
Fei Mei Chan

Former Director, Core Product Management

S&P Dow Jones Indices

In the last three months, the Canadian equity market climbed another three percentage points, bringing the S&P/TSX Composite Index up to an impressive 20.4% YTD through Sept. 16, 2021. In a strong bull market environment, low volatility indices are expected to lag—and they typically have. But overall, the S&P/TSX Composite Low Volatility Index has held its own, gaining 18.8% YTD, just a 1.6% shortfall.

It’s perhaps also no surprise that one-year volatility levels continue to decline (across all GICS® sectors). Health Care remains the most volatile sector, with Information Technology close behind.

The S&P/TSX Composite Low Volatility Index seeks out the lowest volatility at the stock level, but we often look to sector volatility for insights into the dynamics that drive allocations within the index.

The latest rebalance for the S&P/TSX Composite Low Volatility Index was effective following the close of trading on Sept. 17, 2021. Changes in the index were minimal, but that’s not surprising given what we’ve seen in the sector volatility changes. Financials, Real Estate, and Utilities continue to add weight in the index and are the three largest sectors. Most of the increase came at the expense of Industrials, whose weight declined to 7% from 13%. Health Care, which represents 1% of the S&P/TSX Composite, has no weight in the low volatility index.

The posts on this blog are opinions, not advice. Please read our Disclaimers.

Performance Characteristics of the New S&P U.S. SPAC Index

Contributor Image
Smita Chirputkar

Former Director, Global Research & Design

S&P Dow Jones Indices

After exploring the characteristics and lifecycle of special purpose acquisition companies (SPACs) in our previous SPAC blog series, we will now examine the recently launched S&P U.S. SPAC Index.

The S&P U.S. SPAC Index is designed to measure the performance of a minimum of 30 common stocks of SPACs listed on U.S. exchanges. The constituents are weighted by their one-month median daily value traded (MDVT), subject to a single constituent weight cap of 15%.

As of Aug. 31, 2021, the median market capitalization of all listed SPACs was USD 270 million, much lower than the median market capitalization of USD 1.6 billion of S&P SmallCap 600® constituents. Since most SPACs are small- or micro-cap companies, we compared the performance of the S&P U.S. SPAC Index against the S&P SmallCap 600, which is used as its benchmark. Historically, the S&P U.S. SPAC Index exhibited better risk/return characteristics than the benchmark, especially over the short- and mid-term periods. In the 45-month back-tested period ending in August 2021, the strategy exhibited a lower maximum drawdown (-26.8%) compared with the S&P SmallCap 600 (-36.1%; see Exhibit 2).

Over the period studied, the S&P U.S. SPAC Index provided downside protection in times of market turbulence. During all the months in which the benchmark was down between December 2017 and August 2021, the S&P U.S. SPAC Index outperformed 84.6% of the time and generated a monthly average excess return of 6.8% over the benchmark1 (see Exhibit 3).

The ability to provide downside protection exists due to the structure of SPACs. IPO proceeds are held in a trust account and are invested in U.S. Treasuries while the management team is looking for the target. Thus, they have a fixed income component to provide downside protection.

Stay tuned for our upcoming research paper on SPACs!


1 Up months: When the S&P SmallCap 600 has a positive monthly return.
Down months: When the S&P SmallCap 600 has a negative monthly return.

The posts on this blog are opinions, not advice. Please read our Disclaimers.

Headwinds on the Active Horizon

Contributor Image
Anu Ganti

U.S. Head of Index Investment Strategy

S&P Dow Jones Indices

Active managers’ performance was disappointing in 2020, despite the market’s heightened volatility. As the market continues to march upward in 2021, it’s natural to wonder if current conditions are favorable for stock pickers.  We expect active managers’ difficulties to persist.

We can think of volatility in terms of its components: dispersion and correlation. Active managers should prefer above-average dispersion, because stock selection skill is worth more when dispersion is high. At the same time, the price of an active strategy—in terms of incremental volatility—will be relatively small when correlations are high. Both correlation and dispersion are currently below average, as we see in Exhibit 1, indicating relatively inauspicious conditions for active managers.

As a result, the required incremental return for large-cap active managers has risen as correlations have declined, which means they are giving up a greater diversification benefit. Meanwhile, lower dispersion makes it harder to add value. We see similar results for smaller-cap active managers, signaling a relatively more challenging environment for active management.

Large-cap active managers face an additional style bias hurdle. Most active portfolios are closer to equal than cap weighted, which means that they have an advantage when smaller stocks outperform. Unfortunately, Exhibit 2 shows that the largest names have recently been performance leaders.

The dominance of mega caps also hinders stock selection, as illustrated in Exhibit 3. In the first quarter of 2021, 59% of S&P 500 members beat the index, when smaller-caps were outperforming. Since then, the tide has turned, and only 34% of stocks outperformed the index, as mega caps outperformed during this period.

The current bleak environment does not bode well for active managers. We recall that 2020 was characterized by relatively favorable conditions for stock selection, and most active managers still underperformed, proving that genuine stock selection skill is rare. If these trends continue, when SPIVA results for 2021 become available, it would not be surprising if we saw lackluster active management performance once again.

The posts on this blog are opinions, not advice. Please read our Disclaimers.