Get Indexology® Blog updates via email.

In This List

Global Islamic Indices Continued Advance in H1 2021, but Lagged Conventional Counterparts

Understanding the Basics of Sustainability Part 1: Time for a New Strategy?

Exploring a Higher Conviction Approach to ESG

Digital Market Toolkit Expands with the Latest S&P Cryptocurrency Indices

Why ETFs Held Up to 2020's Pressure Test

Global Islamic Indices Continued Advance in H1 2021, but Lagged Conventional Counterparts

Contributor Image
John Welling

Director, Global Equity Indices

S&P Dow Jones Indices

Global equities continued to rise during the second quarter, gaining 7.2% as measured by the S&P Global BMI, raising the YTD tally to 12.8%. Shariah-compliant benchmarks, including the S&P Global BMI Shariah and Dow Jones Islamic Market (DJIM) World Index, somewhat underperformed their conventional counterparts YTD, in part due to continued strength in the Financials sector, which gained 18.7% during the period. All major regional Shariah and conventional benchmarks had positive returns YTD.

Sector Drivers Led to Underperformance of Shariah Benchmarks YTD

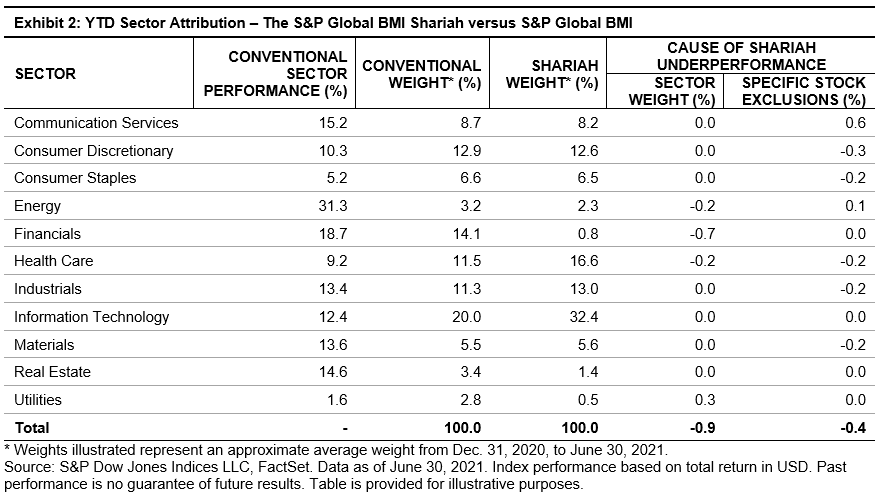
While global equities rallied broadly through H1 2021, sector performance played a part in the relative underperformance of Shariah-compliant equity benchmarks. Financials—which is nearly absent from Islamic indices—outperformed the broader market with a gain of 18.7%, contributing most heavily to the broad outperformance of conventional benchmarks over the period. While Energy represents a smaller portion of broad benchmarks, the sector outpaced the broader market by strides, gaining 31.3%, further adding to the conventional outperformance.

Exhibit 2 displays sector returns along with the effect of over- and under-weight sector allocations of the S&P Global BMI Shariah compared with its conventional counterpart. A large majority of S&P Global BMI Shariah underperformance during the period—0.9%—is explained by differing sector allocations, while 0.4% is explained by the inclusion or exclusion of individual Shariah-compliant stocks within sectors.

MENA Equities in Recovery

MENA regional equities gained considerably YTD, as the S&P Pan Arab Composite advanced 22.5%. The S&P Saudi Arabia BMI led the way in the region, gaining 30.7%, followed by the S&P United Arab Emirates BMI, up 25.8%.

Notably, the S&P Pan Arab Composite Shariah surpassed its conventional counterpart by 2.6% during the quarter, in large part due to significant representation of Saudi Arabia, which outshone its regional peers.

For more information on how Shariah-compliant benchmarks performed in Q2 2021, read our latest Shariah Scorecard.

This article was first published in IFN Volume 18 Issue 27 dated the 7th July 2021.

The posts on this blog are opinions, not advice. Please read our Disclaimers.

Understanding the Basics of Sustainability Part 1: Time for a New Strategy?

Contributor Image
Koel Ghosh

Former Head of South Asia

S&P Dow Jones Indices

The growing importance and inclusion of sustainability values among global investment themes has redefined investors’ views of sustainability factors in portfolio strategies. The idea that sustainability concepts are futuristic is dated—the future has definitely arrived.

The world is changing, and the percentage of retail and institutional investors applying environmental, social, and governance (ESG) principles is on the rise. More and more sustainability data providers are scaling their business to provide deeper qualitative and extensive information, as companies are prioritizing disclosure and reporting. Sustainable funds attracted USD 185.3 billion in net flows in the first quarter of 2021, which was up 17% from the previous quarter at USD 158.3 billion.1 While Europe led the ESG scoreboard followed by the U.S., Asia ex-Japan reported USD 7.8 billion, with 4% of total inflows and 237 funds. Many projections forecast a multifold growth in ESG solutions in investment products, so it might be time to take notice of this new wave.

India is slowly waking up to the growing reality of ESG relevance. While some have embraced this concept, skepticism rules in a market that has the leading country benchmark, the S&P BSE SENSEX, above 52,000 and a one-year annual return of 62%.2 The thought that ESG is just a novelty is still at large. Therefore, a deep dive into this fast-developing concept may be a worthwhile dialogue.

First, what are ESG values and what constitutes them? ESG investing is not about categorizing companies on the basis of how “good” they are but how they manage each of the ESG factors (environmental, social, and corporate governance), thereby helping investment strategies in their selection methodologies. S&P Dow Jones Indices has a wide gamut of indices tracking these factors. ESG indices based on core benchmarks, such as the S&P 500® ESG Index, S&P Europe 350® ESG Index, S&P 500 ESG Elite Index, and S&P BSE 100 ESG Index are just a few.

Exhibit 1 shows that return trends by ESG indices in U.S., Europe, and India tended to be higher than the underlying benchmark. Though nominal outperformance, it does contest many myths that ESG factors lead to underperformance. For the U.S. market, we compared the S&P 500 ESG Elite Index and S&P 500 ESG Index, both of which showed outperformance in the majority of periods, other than a slight underperformance by the S&P 500 ESG Index in the one-year period. The Indian benchmark outperformed the other benchmarks, but the ESG index still outperformed in all periods and by a greater margin than in the U.S. or Europe.

Though these statistics are not a forecast of future performance, it does provide a compelling review of such sustainability factors in investment strategies.

1 https://www.fundssociety.com/en/news/markets/global-assets-in-esg-funds-neared-2-trillion-dollars-boosted-by-record-inflows

2 Yearly annualized returns as of May 31, 2021

The posts on this blog are opinions, not advice. Please read our Disclaimers.

Exploring a Higher Conviction Approach to ESG

With appetite for higher conviction ESG strategies on the rise, how could these darker green approaches help market participants align investments with ESG values? Jon Winslade and Jaspreet Duhra of S&P DJI join Andrew Walsh of UBS Asset Management for a closer look at the S&P 500 ESG Elite Index.


The posts on this blog are opinions, not advice. Please read our Disclaimers.

Digital Market Toolkit Expands with the Latest S&P Cryptocurrency Indices

Contributor Image
Sharon Liebowitz

Former Head of Innovation

S&P Dow Jones Indices

We are proud to announce the launch of our latest cryptocurrency indices, featuring the new S&P Cryptocurrency Broad Digital Market (BDM) Index.

As we have discussed before, cryptocurrencies come with a host of new opportunities and challenges. As an emerging space, one of the biggest issues is a lack of transparency.

Our new S&P Cryptocurrency BDM Indices provide transparency with a wide snapshot of the cryptocurrency market and reflect a view of market performance overall. The S&P Cryptocurrency BDM Index includes more than 240 coins at launch, and we estimate that it covers over 80% of the current total cryptocurrency market capitalization.1

In terms of the indices themselves, the S&P Cryptocurrency BDM Indices are weighted by market capitalization. This corresponds to coin supply multiplied by coin price for cryptocurrencies. Because the market is especially dynamic, the use of fixed ratios or fixed values to determine market capitalization is quickly outdated. Instead, the indices use a clustering algorithm to select the appropriate cohort of constituents. For additional details on the market capitalization classification algorithm, please refer to the methodology.

To be included in the index universe, coins must be priced by Lukka Prime and trade on Lukka-recognized exchanges. Additional eligibility criteria include the following.

  • Market Capitalization – Each constituent must have a market capitalization value greater than or equal to USD 10 million at the time of inclusion in the index.
  • Liquidity – Each constituent must have a three-month median daily value traded (MDVT) of USD 100,000 at the time of inclusion in the index.
  • Validating Research – Each constituent must have a supporting white paper.
  • Exclusions:
    • Stablecoins or any other pegged digital assets are excluded because while they are an essential part of the cryptocurrency ecosystem, they will not reflect growth (or contraction) in the market.
    • Privacy-enhanced coins are excluded since they can hide the identity and profile of their holder.
    • Coins that are or become subject to a regulatory or legal concern may be excluded.

While our initial cryptocurrency indices that launched in May 2021 focused on the two largest and most prominent cryptocurrencies—Bitcoin and Ethereum—this next series offers a broader view of the market. In the cases of certain indices, Bitcoin and Ethereum are excluded.

This launch includes the following indices:2

The exclusions serve to highlight the performance of relatively smaller coins that are overshadowed by the dominance of the two largest coins—which make up approximately 63% of total market capitalization.3 Exhibit 2 shows how the index’s average coin market capitalization diminishes dramatically as mega- and large-cap constituents are excluded—from almost USD 5 billion in the S&P Cryptocurrency BDM Index, to USD 1.1 billion in the S&P Cryptocurrency BDM Ex-MegaCap Index, to just USD 230 million in the S&P Cryptocurrency BDM Ex-LargeCap Index.

Stay tuned as we expand the cryptocurrency index series, and learn more in our paper “Bringing Transparency to an Emerging Asset Class.”

1 Source: S&P Dow Jones Indices LLC, USD 1.46 trillion, based on 950+ assets priced by Lukka Prime, as of June 30, 2021.

2 See FAQ for additional details.

3 Source: Lukka, USD 1.46 trillion, based on 950+ assets priced by Lukka Prime, as of June 30, 2021.

The posts on this blog are opinions, not advice. Please read our Disclaimers.

Why ETFs Held Up to 2020's Pressure Test

What could 2020’s liquidity lessons mean for the insurance investment landscape moving forward? S&P DJI’s Tim Brennan joins State Street Global Advisors’ Ben Woloshin, Citadel’s Katie Stiner, and One America’s Brian Matthews for a closer look at this evolving landscape.

Watch S&P DJI’s Annual Insurance Summit: https://www.spglobal.com/spdji/en/events/annual-insurance-investment-summit-how-are-insurers-staying-ahead-of-the-curve/#summary

The posts on this blog are opinions, not advice. Please read our Disclaimers.