Get Indexology® Blog updates via email.

In This List

How to Value Thematic Strategies

Chile Tilting toward Sustainability

Understanding SOFR

Copper Crashes the Energy Party in February

The S&P Systematic Global Macro Index – Trending to New Highs

How to Value Thematic Strategies

Contributor Image
Matthew Bartolini

Managing Director

State Street Global Advisors

During the pandemic, we’ve seen an evolution of behavioral changes fuel transcendent trends across our economy that may create new future growth opportunities.

This has spurred investor interest in thematic ETFs that seek to provide exposure to firms at the forefront of innovation. In 2020, more than $40 billion flowed into ETFs focused on Future Communication, Clean Energy, Smart Transportation, and Cloud Computing.1

To formulate a fundamental view on these areas of innovation, it is important to consider which valuation metric may be the most appropriate.

Fundamentally thematic

Selecting the most appropriate metric requires understanding the type of firms typically found in the 145 funds we identify as thematic strategies. Our security look-through analysis finds many of these funds are concentrated in the Consumer Discretionary, Health Care, and Information Technology sectors. Importantly, the firms in those sectors typically have significant intangible assets2 on their balance sheets. Price-to-book may not be the best metric here because high intangible assets usually understate a firm’s book value—potentially inflating the firm’s price-to-book measure.

Earnings-related issues for thematics

There is an issue, however, if we use earnings-related metrics (e.g. price-to-earnings (P/E), price-to-next-12-month-earnings, and enterprise value-to-EBITDA). First, negative earnings firms must be removed, resulting in an incomplete exposure being analyzed. And those firms must be removed so as not skew the result (i.e., negative P/E values would tamp down the high P/E values when performing an average calculation for a portfolio).

The presence of negative earnings firms in some thematic exposures means any multiple that has earnings-related information in the denominator should not be utilized. This also holds true for the price-to-earnings-growth ratio (PEG), since it still relies on earnings in the denominator, while normalizing the ratio by expected growth.

No earnings, but revenue, hopefully

While some innovative firms do not have earnings, they likely have sales/revenue. Therefore, using one of these two sales-based metrics may be more optimal: price-to-sales and enterprise value-to-sales. The latter, in my opinion, offers the most appropriate and comprehensive view of a firm’s operations, as enterprise value (EV) accounts for both the firm’s equity value and amount of debt.3 Accounting for the level of leverage/debt utilized by the firm to generate revenue, it tends to be more comparable across industries, given it is capital structure agnostic (i.e., high-debt industries typically look cheaper on a price-to-xyz basis since their debt isn’t captured in the metric, but under EV, the debt is taken into account).

A list of metrics — and the strengths and drawbacks of thematic valuations — are shown below:

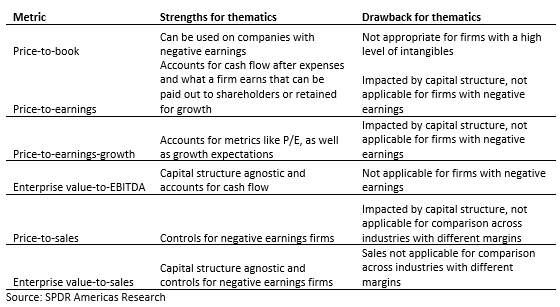
The table below compares the different metrics for an aggregated portfolio of all 18 Broad Innovation funds4 with the broad S&P 500. The average figure for the Broad Innovation category is higher than the broad market — as would be expected. However, when it comes to enterprise value-to-sales, the skew is much tighter, due to dynamics discussed above.

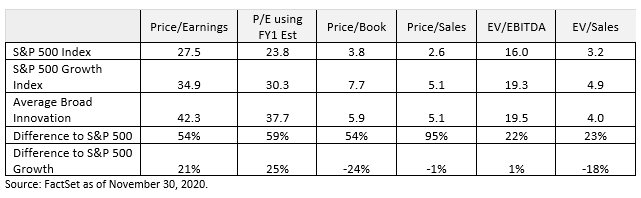
While these exposures were trading rich at the end of last year, the multiples are elevated to the broader market due to higher expected growth estimates and the potential for behavioral changes to create future growth opportunities.

Analysis in 2021 and beyond

The pandemic will continue to spark greater need for innovative technologies that allow for more contactless interactions, advanced medicine, digital connectivity, and intelligent infrastructure.

With more ways to participate in these thematic trends, investors need a classification framework as the first step in due diligence.  It’s also important to understand the construction approaches for each exposure. Of all the valuation multiples available, enterprise value-to-sales may be the most appropriate.


1 Bloomberg Finance L.P. as of December 31, 2020 based on SPDR Americas Research calculations.

2 An intangible asset is an asset that is not physical in nature. Goodwill, brand recognition and intellectual property, such as patents, trademarks, and copyrights, are all intangible assets. Intangible assets exist in opposition to tangible assets, which include land, vehicles, equipment, and inventory.

3 EV is the market capitalization of a company as well as short-term and long-term debt less any cash on the company’s balance sheet.

4 Eighteen funds, as classified by SPDR Americas Research as of December 15, 2020.


Glossary

S&P 500® Index: A popular benchmark for U.S. large-cap equities that includes 500 companies from leading industries and captures approximately 80% coverage of available market capitalization.

S&P 500® Growth Index: A market-capitalization-weighted index developed by Standard and Poor’s consisting of those stocks within the S&P 500 Index that exhibit strong growth characteristics.

Disclosures

The views expressed in this material are the views of Matthew Barotlini through the period ended February 12, 2021 and are subject to change based on market and other conditions. This document contains certain statements that may be deemed forward looking statements. Please note that any such statements are not guarantees of any future performance and actual results or developments may differ materially from those projected. Investing involves risk including the risk of loss of principal. Past performance is no guarantee of future results.

The information provided does not constitute investment advice and it should not be relied on as such. It should not be considered a solicitation to buy or an offer to sell a security. It does not take into account any investor’s particular investment objectives, strategies, tax status or investment horizon. You should consult your tax and financial advisor. All material has been obtained from sources believed to be reliable. There is no representation or warranty as to the accuracy of the information and State Street shall have no liability for decisions based on such information.

The whole or any part of this work may not be reproduced, copied or transmitted or any of its contents disclosed to third parties without State Street Global Advisors’ express written consent.

The trademarks and service marks referenced herein are the property of their respective owners. Third party data providers make no warranties or representations of any kind relating to the accuracy, completeness or timeliness of the data and have no liability for damages of any kind relating to the use of such data.

Investing involves risk including the risk of loss of principal.

ETFs trade like stocks, are subject to investment risk, fluctuate in market value and may trade at prices above or below the ETFs net asset value. Brokerage commissions and ETF expenses will reduce returns.

Standard & Poor’s®, S&P® and SPDR® are registered trademarks of Standard & Poor’s Financial Services LLC (S&P); Dow Jones is a registered trademark of Dow Jones Trademark Holdings LLC (Dow Jones); and these trademarks have been licensed for use by S&P Dow Jones Indices LLC (SPDJI) and sublicensed for certain purposes by State Street Corporation. State Street Corporation’s financial products are not sponsored, endorsed, sold or promoted by SPDJI, Dow Jones, S&P, their respective affiliates and third party licensors and none of such parties make any representation regarding the advisability of investing in such product(s) nor do they have any liability in relation thereto, including for any errors, omissions, or interruptions of any index.

State Street Global Advisors, One Iron Street, Boston, MA 02210.

© 2021 State Street Corporation. All rights reserved.

3373882.2.1.AM.RTL | EXP. 2/28/2022

The posts on this blog are opinions, not advice. Please read our Disclaimers.

Chile Tilting toward Sustainability

Contributor Image
Reid Steadman

Former Managing Director, Global Head of ESG & Innovation

S&P Dow Jones Indices

When investors think of sustainability, what often comes to mind first are progressive companies headquartered in Nordic nations, France, or Switzerland—but this is a dated view. Sustainability has moved beyond these regions, particularly into emerging markets like Latin America, where, one could easily argue, improvements in environmental, social, and governance (ESG) standards matter even more. There is simply more ground to gain.

In emerging markets, however, more tools are required to help investors make informed decisions. With this need in mind, the Santiago Stock Exchange and S&P Dow Jones Indices collaborated to launch the new S&P IPSA ESG Tilted Index to set the standard for sustainable investing for the Chilean equity market.

Defining a Sustainable Benchmark

The S&P IPSA ESG Tilted Index is a modern sustainable benchmark. ESG indices created in the early days of the sustainable investing movement tended to be narrow, focusing on the best ESG companies or a single theme, such as clean energy. Newer ESG benchmarks have forged a new path, still incorporating strict ESG criteria, but doing so in a way that retains a broad set of companies, which tends to result in less volatile, more benchmark-like returns. The S&P IPSA ESG Tilted Index fits this new mold.

The tilting of the parent index, the S&P IPSA, toward more sustainable companies is the defining characteristic of the index and ultimately drives improvements in sustainability. However, before this key adjustment, some basic exclusions are made in line with international norms.

First, companies are excluded that breach revenue thresholds related to business activities commonly viewed as undesirable by sustainable investors around the world. This includes meaningful involvement in controversial weapons (such as nuclear or chemical weapons), tobacco, coal extraction, or generating coal-powered electricity. Further, companies are excluded that are deemed non-compliant with the United Nations Global Compact due to violations related to human rights, corruption, labor rights, and the environment.

After these exclusions are implemented, constituents are tilted according to their S&P DJI ESG Scores, a holistic measure of sustainability based on the S&P Global Corporate Sustainability Assessment (CSA). The methodology spells this process out in detail, but in summary, companies are standardized within their industry groups by their S&P DJI ESG Scores and assigned a “tilt score.” The company’s original weight in the S&P IPSA is multiplied by this tilt score to achieve its new weight in the S&P IPSA ESG Tilted Index.

The S&P IPSA ESG Tilted index is superior from the perspective of the S&P ESG Scores, improving 4.4 points relative to the benchmark index. This is achieved by a reallocation of weights, which can be seen by reviewing the weights of the top five constituents of the S&P IPSA and its new ESG counterpart (see Exhibit 1).

Though improvements in composite S&P DJI ESG Scores are interesting to some, it’s difficult for many to get their minds around what this practically means. Reviewing the various topics of the CSA helps. Companies that score better tend to be stronger in their communication of codes of business conduct, enforcing these codes, and monitoring their impact on the environment and proactively managing their emissions, among many other ways. The S&P IPSA ESG Tilted Index increases the weights of companies that operate with sustainability in mind.

And after all these adjustments, how has the index performed? It has provided benchmark-like returns, in line with the S&P IPSA (see Exhibit 2). This can give investors comfort that this is an index with mainstream characteristics in line with their needs.

How will the S&P IPSA ESG Tilted Index help the Chilean market advance in sustainability-focused investing? Like no index before, it has the potential to connect investors concerned about sustainability with the corporate market. As companies see investors use this index more and more, they will likely seek to improve their ESG performance—as defined by the S&P DJI ESG Scores and CSA—and seek to do better not just for shareholders, but for the broad set of stakeholders affected by their businesses.

The posts on this blog are opinions, not advice. Please read our Disclaimers.

Understanding SOFR

Contributor Image
Hong Xie

Former Senior Director, Global Research & Design

S&P Dow Jones Indices

In June 2023, the U.S. dollar London Inter-Bank Offered Rate (LIBOR) will likely be discontinued. The Alternative Reference Rates Committee has identified the Secured Overnight Funding Rate (SOFR) as the recommended alternative reference rate to replace USD LIBOR. SOFR is calculated as a volume-weighted median of transaction-level U.S. Treasury repurchase agreements data, reflecting borrowing cost in overnight borrowing collateralized by U.S. Treasury securities.

There are three major differences between SOFR and USD LIBOR.

  1. SOFR is based on observable transactions in the largest rates market in the world at a given maturity. Since SOFR’s first publication in April 2018, the daily average volume of trades underlying it is about USD 977 billion (see Exhibit 1). In comparison, the Fed estimates that on a typical day, there are a handful of transactions worth a few hundred million dollars at most that underpin total seven tenors of USD LIBOR in the term unsecured bank funding market (Held, 2019).1 In fact, diminishing transactions underlying LIBOR is one of the main reasons that authorities are pushing the financial industry to transition away from LIBOR to more robust reference rates that are based on observable transactions rather than estimates.
  2. SOFR is an overnight rate and USD LIBOR includes seven tenors of forward-looking term rates.
  3. SOFR is nearly risk free as an overnight secured rate collateralized with U.S. Treasury bonds, while LIBOR is credit sensitive and embeds a bank credit risk premium.

Points 2 and 3 particularly make the transition from LIBOR to SOFR challenging.

One difficulty is that in the absence of SOFR-based term rates, SOFR compounded in arrears currently is the preferred replacement rate in many products. Calculated over the current interest period, it leaves little notice time before payment and poses significant operation disadvantages for some cash products (e.g., syndicated loans). A solution for this challenge would be to develop SOFR-based term rates, which are expected in the first half of 2021. However, the robustness of such rates would depend on the liquidity of relevant SOFR derivatives.

A second problem is that SOFR, without a bank credit premium, is not aligned with bank funding costs, and therefore opens up basis risk in banks’ asset liability management.

In many derivatives and some cash products, a compounded average SOFR is preferred to replace LIBOR, which naturally helps address the concern for the day-to-day volatility of SOFR. Exhibit 2 shows the comparison between three-month USD LIBOR and three-month compounded average SOFR since August 2014.2 The spread between them averages 0.29%, ranging between -0.78% and 0.91%.

USD LIBOR is frequently used as a cash rate in an index that has a cash investment or requires funding. Exhibit 3 compares the cumulative returns of a cash investment using SOFR with overnight and three-month LIBOR. In annualized terms, a SOFR-based cash return was lower than those based on overnight and three-month LIBOR by 0.30% and 0.02%, respectively, over the past six and a half years.

SOFR is expected to replace LIBOR in a variety of financial products as benchmark reference rates. It is imperative to understand SOFR to identify the appropriate form of SOFR for LIBOR replacement and conduct impact analysis.

1 Michael Held: SOFR and the transition from LIBOR

2 The Federal Reserve Bank of New York publishes daily historical indicative SOFR from August 2014 to March 2018. Official SOFR data starts on April 2, 2018.

The posts on this blog are opinions, not advice. Please read our Disclaimers.

Copper Crashes the Energy Party in February

Contributor Image
Jim Wiederhold

Former Director, Commodities and Real Assets

S&P Dow Jones Indices

An inflationary tide lifted almost all commodity boats in February 2021. Most constituents of the S&P GSCI rose while gold, the commodity that market participants often look to for inflation protection, lagged. The S&P GSCI rose 10.6% overall in February, with copper and energy doing most of the heavy lifting.

After a strong January, the S&P GSCI Crude Oil accelerated further in February, rising 18.1%. A combination of continued OPEC+ production compliance and a historic cold weather event in Texas, knocking out more than four million barrels per day of production, were the catalysts driving this oil price gush. The remaining energy commodities followed suit, with gains of at least 9% for the month.

The S&P GSCI Copper woke up in February to join the energy party, rising 15.6%, close to double the next-best-performing industrial metal, the S&P GSCI Aluminum. Copper inventories were depleted and remained at levels not seen since 2005. The swiftness of the decline in copper inventories was unprecedented. The ramp up in manufacturing activity continues across the world, as demonstrated by the latest strong PMI readings. The clean air push is also contributing to the rally in industrial metals. China’s upcoming NPC meeting will be a highlight, with this event likely to affect future demand, as well as the production of aluminum, the most energy-intensive metal to produce.

The S&P GSCI Gold fell 6.6% in February as safe haven assets were sold off in favor of more bullish asset classes and U.S. bond yields spiked. This was the largest monthly drop in gold prices since November 2016. The S&P GSCI Platinum rose 9.8%, breaking out to a five-year high on the back of a potential third year of global supply deficits and new market awareness of the metal’s use in hydrogen energy technologies.

The S&P GSCI Agriculture ended the month up 2.1%; soybeans and corn rallied to multi-year highs, driven by relentless buying from China as it rebuilds its hog herd following the devastation caused by African swine fever. The S&P GSCI Sugar rallied 8.8% in February, with industry forecasters further trimming sugar surplus estimates for the current and new crop years.

The livestock sector was dominated by an impressive rally in lean hogs; the S&P GSCI Lean Hogs rose 13.7%. Lean hog futures have been trending higher since mid-December 2020 due to a combination of higher wholesale prices, extreme weather events, and exports to other markets helping offset the expected decline in shipments to China.

The posts on this blog are opinions, not advice. Please read our Disclaimers.

The S&P Systematic Global Macro Index – Trending to New Highs

Contributor Image
Rupert Watts

Head of Factors and Dividends

S&P Dow Jones Indices

The S&P Systematic Global Macro Index (S&P SGMI) is a trend-following strategy that takes long or short positions in 37 constituent futures across equites, commodities, fixed income, and FX.

In 2020, the S&P SGMI did particularly well during the COVID-19-related drawdowns, finishing March up 11.3%, and closing the year at an all-time high. Thus far in 2021, the index has continued along this path, reaching new highs. As Exhibit 1 shows, the full-year 2020 return was 12.76% and the 2021 return is 11.17% YTD.

Much of the recent positive performance has come from commodities. This mostly occurred during the first quarter of 2020, when downward momentum in energy markets gathered pace, and Q4 2020 and YTD 2021, as vaccine news boosted hopes of an economic recovery and the U.S. dollar weakened.

To highlight the role that commodities played, Exhibit 2 shows the performance of two standalone subindices computed using the same methodology as the S&P SGMI. The first is the S&P Systematic Global Macro Commodities Index (S&P SGMI Commodities; the physical commodity futures component), and the second is the S&P Systematic Global Macro Financials Index (S&P SGMI Financials; the equity, fixed income, and FX components).

Notably, the performance of the S&P SGMI significantly exceeded that of its peers, the SG CTA Index and the SG Trend Index. The SG CTA Index tracks the performance of a pool of commodity trading advisors (CTAs) selected from larger managers that are open to new investment. The SG Trend Index is a subset of the SG CTA Index, and follows traders of trend-following methodologies.

As Exhibit 3 shows, the S&P SGMI outperformed the SG CTA Index and the SG Trend Index by 9.60% and 6.48%, respectively, for the full-year 2020 and by 6.92% and 4.79%, respectively, so far in 2021.

How Does the Index Work?

The S&P SMGI rebalances monthly and the methodology involves two core steps: the position direction decision and the weighting decision.

The Position Direction Decision:

The goal of the trend-following algorithm is to identify the most current, statistically relevant trend by assessing each constituent future independently, using an iterative process.

A linear regression is used to determine if the constituent future is in an upward or downward trend. If the regression slope coefficient is positive (negative), the component is deemed to be in an upward (downward) trend.

While the length of a particular trend will vary, the S&P SGMI uses the most recent period during which the trend was stable. This is determined using an iterative process that starts with a 22-day period and tests additional 5-day increments until the longest stable trend is identified using a statistical test.

The Weighting Decision:

The index allocates risk capital evenly across and within each of the sectors with the goal that no single sector or constituent drives the volatility of the index. The weights are then leveraged to meet the volatility target subject to a 3x leverage constraint.

Conclusion

Trend-following strategies can play an important role in client portfolios, offering diversifying return sources that may improve risk-adjusted return over the long term. As we enter the second year of the COVID-19 pandemic, it will be interesting to see if the S&P SGMI’s strong performance continues.

The posts on this blog are opinions, not advice. Please read our Disclaimers.