Get Indexology® Blog updates via email.

In This List

Accessing the Expanding S&P 500 ESG Index Ecosystem

Accessing the Growth of the “New China” Economy

Low Turnover in the S&P 500 Low Volatility Index Reflects Broader Market Dynamics

From Large Cap to All Cap: Introducing the S&P MidCap 400 ESG and S&P SmallCap 600 ESG Indices

S&P PACT Indices Sector Weight Explanation in Developed and U.S. Markets

Accessing the Expanding S&P 500 ESG Index Ecosystem

The S&P 500 ESG Index has redefined mainstream access to ESG, providing global investors with new tools designed to help them align objectives with their ESG values. Explore how this expanding ESG ecosystem is defining the sustainable core with S&P DJI’s Mona Naqvi, Horizon Investments’ Scott Ladner, Axio Financial’s Peter Horacek, and Sage Advisory’s Bob Smith.


The posts on this blog are opinions, not advice. Please read our Disclaimers.

Accessing the Growth of the “New China” Economy

Contributor Image
John Welling

Director, Global Equity Indices

S&P Dow Jones Indices

As China’s economy matures, consumption and service-related industries are becoming structurally more important. Because the country’s stock market continues to have significant exposure to “old economy” sectors, many market participants are seeking alternative index solutions to participate more directly in China’s fastest growing areas.

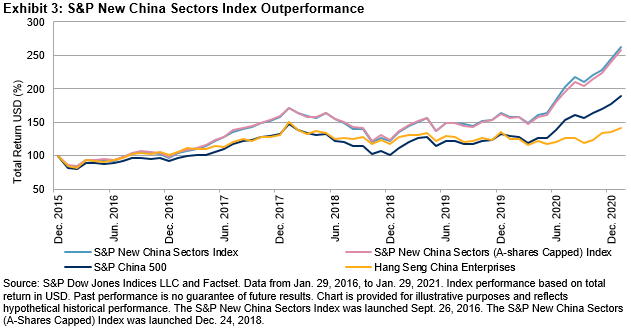
Launched in September 2016, the S&P New China Sectors Index provides access to Chinese companies operating in specific industries poised to benefit from the country’s transition to a consumer- and service-oriented economy. The index includes all Chinese share classes, including A-shares and offshore listings (including those listed in the U.S.), as well as companies with a Hong Kong domicile. To distribute exposure more evenly and improve liquidity, 10% single stock caps are applied semiannually, and selection is limited to large and liquid stocks.

This focus on “new China” provides substantial relief from slower growing sectors of the economy, which retain a high exposure within existing, widely used Chinese equity benchmarks, such as the Hang Seng China Enterprises Index (HSCEI).

Slower growth among these “old economy” sectors has translated into lagging equity performance, particularly in recent years. Over the latest five-year period, the S&P New China Sectors Index has returned more than 25.3% per year, while the HSCEI has returned only 10.8%—an outperformance that speaks to the powerful driving forces of the more surgent economic sectors.

What Has Driven the Outperformance?

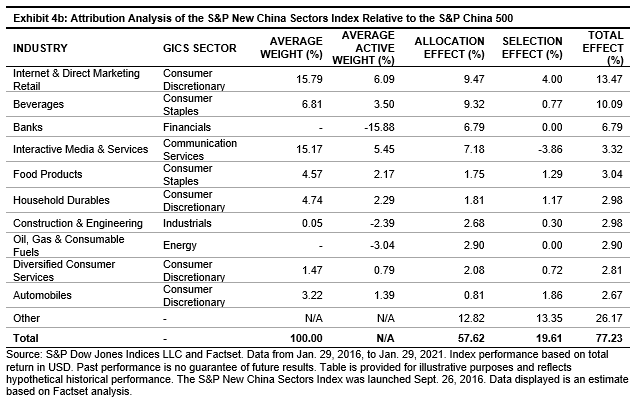
Analysis of top contributors shows that outperformance was spread out widely, with tech-giants Alibaba and Tencent contributing most toward outperformance, while Kweichow Moutai and Meituan Dianping further illustrated the importance of the rising consumer. The top 10 contributors accounted for just under half of the outperformance of the S&P New China Sectors Index versus the broad-based S&P China 500 over the most recent five-year period.

Industry attribution, meanwhile, shows that outperformance was concentrated largely within the “new economy” sectors. This outcome is even more apparent when compared with the HSCEI, in large part due to its greater concentration in banks and other “old economy” industries.

By focusing on consumer- and service-related companies, the S&P New China Sectors Index offers a high level of differentiation from traditional Chinese equity benchmarks and more directly measures one of the key megatrends affecting the Chinese economy.

For further information, refer to our Talking Points overview of the S&P New China Sectors Index.

The posts on this blog are opinions, not advice. Please read our Disclaimers.

Low Turnover in the S&P 500 Low Volatility Index Reflects Broader Market Dynamics

Contributor Image
Fei Mei Chan

Former Director, Core Product Management

S&P Dow Jones Indices

It’s been almost a year since the COVID-19 pandemic hit the U.S., but despite the disruption it brought to daily life, the U.S. equity market has performed remarkably well—rallying powerfully after a sharp decline in March 2020. Through Feb. 18, 2021, the S&P 500® was up 24% since the end of 2019. In the same period, the S&P 500 Low Volatility Index was flat.

The Low Vol index rebalanced after the market’s close on Feb. 19, 2021; not much changed. With the lowest turnover in the history of the index, six names cycled out, accounting for about 5% of the index.

The biggest change was in Health Care, which gave up 3% of its weight. The slack was mostly offset by Information Technology. Real Estate lost a bit of ground as Industrials added about 1%. All other sectors held steady.

Dynamics in sectors provide us with some insight into what drove the changes in the latest rebalance. While volatility remains elevated, similar to the November 2020 rebalance, it continues to decline. Importantly, volatility declined by a similar proportion across all sectors, which explains the minimal turnover in the latest rebalance.

The posts on this blog are opinions, not advice. Please read our Disclaimers.

From Large Cap to All Cap: Introducing the S&P MidCap 400 ESG and S&P SmallCap 600 ESG Indices

Contributor Image
Mona Naqvi

Global Head of ESG Capital Markets Strategy

S&P Global Sustainable1

Whoever said size doesn’t matter, wasn’t talking about ESG. For years, we’ve known that larger companies tend to fare better when it comes to sustainability.1 But thanks to the launch of the S&P MidCap 400® ESG Index and S&P SmallCap 600® ESG Index, that may be about to change.

As per the S&P ESG Index Series Methodology, the indices aim to offer benchmark-like returns and improved sustainability profiles relative to their benchmarks (see Exhibits 1-3). Above all, however, they represent a new sustainable frontier in a space left largely untouched by ESG indexing to date. Indeed, scant reporting of sustainability metrics among smaller-sized firms has thus far dampened ESG efforts below a certain cap size. But thanks to the rules-based selection process and direct company engagement of our annual Corporate Sustainability Assessment (CSA), the methodology is uniquely positioned to:

  1. Educate smaller firms on sustainability topics of growing importance to investors;2 and
  2. Raise the bar on sustainable business practices as companies compete to join the ranks of the ESG indices.

Perhaps the biggest contribution these indices may make, then, is to influence greater reporting and sustainability standards among medium and small-sized firms—beyond just the typical titans of the S&P 500®.

However, the fact remains that there is relatively less disclosure of ESG topics among smaller firms at present,3 and that larger companies tend to perform better on these issues (i.e., size really does matter).4 This positive correlation between ESG performance and firm size means that the standard ESG score exclusion criteria would likely result in an eligible universe that is simply too narrow to maintain a broad and diversified index.5 To remedy this, we apply minor adjustments to the methodology for the 400 and 600 versions to ensure the indices can satisfy the S&P ESG Index Series objective. For instance, screening out companies at lower ESG score thresholds where necessary and at the local index level, rather than among global industry group peers.6

With these adjustments, the resulting 274 constituents of the S&P MidCap 400 ESG Index and 407 constituents of the S&P SmallCap 600 ESG Index manage to closely replicate the underlying risk/return profile of the respective benchmark (with welcome outperformance; see Exhibit 1)—as well as provide measurable ESG improvements (see Exhibits 2 and 3). This result, coupled with an almost identical underlying factor exposure to their benchmarks (even when it comes to size, surprisingly) confirms that these new ESG indices are poised to do precisely what they are intended to do (see Exhibits 4 and 5). Thus, as these indices assume their rightful place alongside the flagship S&P 500 ESG Index, we can finally say that sustainable investing is no longer just a large-cap solution—it is now an all-cap solution.

For more on the S&P MidCap 400 ESG Index and S&P SmallCap 600 ESG Index, read the addendum to our white paper, “The S&P 500 ESG Index: Defining the Sustainable Core.”


1 A positive correlation between sustainability performance and firm size is generally observed due to the greater visibility, access to resources, and operating scale associated with large firms. See, for example, Drempetic, S., Klein, C., and Zwergel, B. “The Influence of Firm Size on the ESG Score: Corporate Sustainability Ratings Under Review.” Journal of Business Ethics (2019) for more information.

2 See Naqvi, M. and Jus, M. “The Benchmark that Changed the World: Celebrating 20 Years of the Dow Jones Sustainability Indices”, S&P Global (2019) for more information.

3 According to this WSJ article (2019), “Midsize and small companies generally lag behind their larger peers in terms of disclosure because they are less likely to have resources such as ESG-dedicated team or a sustainability department”.

4 See footnote 1.

5 As per the standard S&P ESG Index Series Methodology, companies with an S&P DJI ESG score that falls within the worst 25% of ESG scores from each GICS Global Industry Group are excluded from the indices (alongside other exclusions (tobacco, controversial weapons, thermal coal, companies that perform poorly on the UNGC principles, and companies involved in material controversies), before then targeting 75% of the remaining, eligible universe of companies ranked by S&P DJI ESG score within their respective index industry group.

6 See page 8 of the S&P ESG Index Series Methodology for more details on the adjustments made to the exclusion criteria for the S&P MidCap 400 ESG Index and S&P SmallCap 600 ESG Index.

7 The relatively low index-level ESG score improvement is a consequence of the generally low ESG scores among small- and mid-sized companies, as discussed. Please refer to Exhibits 2 and 3 to better understand the sustainability enhancements associated with the S&P MidCap 400 ESG Index and S&P SmallCap 600 ESG Index across the individual E, S, and G dimensions.

The posts on this blog are opinions, not advice. Please read our Disclaimers.

S&P PACT Indices Sector Weight Explanation in Developed and U.S. Markets

Contributor Image
Ben Leale-Green

Former Associate Director, Research & Design, ESG Indices

S&P Dow Jones Indices

In April 2020, we launched the S&P PACTTM (Paris-Aligned & Climate Transition) Indices. The indices aim to align with a 1.5oC climate scenario, the EU’s minimum standards for EU Climate Transition Benchmarks and EU Paris-Aligned Benchmarks, and the recommendations of the Task Force on Climate-related Financial Disclosures (TCFD), while maintaining a broad, diversified exposure. The S&P PACT Indices consist of the S&P Paris-Aligned (PA) Climate Indices and S&P Climate Transition (CT) Indices. The index methodology excludes certain companies (exclusion effect), then reweights remaining constituents (reweighting effect) based on their climate performance (see Exhibit 1), as discussed in a previous blog.

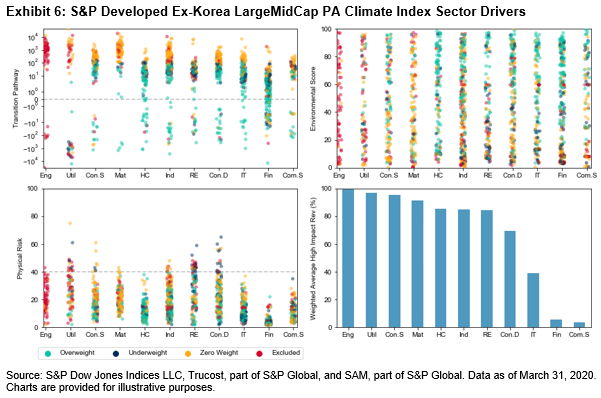
We published a paper explaining the weight attribution of constituents in the S&P PACT Indices, where we isolated the transition pathway, environmental score, physical risk, and level of high climate impact revenue as important weight drivers. Elaborating on Barbara’s recent blog, we highlight observations of how sector allocations were driven by climate factors and exclusions within the S&P 500® PACT and S&P Developed Ex-Korea PACT Indices.

Similar to the S&P Europe LargeMidCap PA Climate Index and the S&P Eurozone LargeMidCap PA Climate Index, the S&P Developed Ex-Korea LargeMidCap PA Climate Index and S&P 500 PA Climate Index saw large Energy exclusions due to oil, gas, and coal exposure. Within the S&P 500 PA Climate Index specifically, no Energy stocks were eligible due to these exclusions. Furthermore, the removal of highly intensive power generation companies affected Utilities.

However, unlike the S&P Europe LargeMidCap CT Index and the S&P Eurozone LargeMidCap CT Index, the Utilities sector of the S&P 500 CT Index experienced underweighting. While this was observed within the S&P 500 PA Climate Index due to additional power generation exclusions, the underweight in the S&P 500 CT Index was likely driven by climate factors, particularly high physical risk. Utilities companies were largely either well above or below their 1.5oC budget (assessed by Trucost’s Transition Pathway dataset). The only overweighted Utilities company in the S&P 500 PA Climate Index had the lowest physical risk among its peers, despite being slightly above its allocated carbon budget.

While companies are not individually required to be 1.5oC compatible for eligibility for the S&P PACT Indices, we observed those well over budget (around 102 in the S&P Developed Ex-Korea LargeMidCap PACT and S&P 500 PACT Indices) rarely saw any weight allocation, whereas those under budget frequently realize large overweighting.

Health Care experienced a large overweight in the S&P 500 and S&P Developed Ex-Korea LargeMidCap PACT Indices. In each region, we observed few Health Care companies well over their 1.5oC budget, and high physical risk was rarely an issue.

High climate impact revenues were constrained to avoid greenwashing. Most sectors had both high and low climate impact revenues streams. High climate impact revenues made the biggest impact on weights at the company level within sectors, rather than at sector level. Within sectors that had a mix of companies with high and low climate impact revenue streams, those with majority low climate impact revenues tended to be underweighted. This is particularly apparent within the Consumer Discretionary and Health Care sectors, as seen on the right-hand charts of Exhibits 2 and 3.

While there are further observations that can be made from the exhibits in this blog, we hope this picks out some key points of interest.


The posts on this blog are opinions, not advice. Please read our Disclaimers.