In a previous blog, we explored the glide paths of the S&P Risk-Managed Target Date Indices. In this post, we will compare the index construction of the S&P Risk-Managed Target Date Indices with that of the S&P Target Date Indices and examine their performance.
Index Construction of the Baseline S&P Risk-Managed Target Date Indices
Each S&P Target Date Index and each S&P Risk-Managed Target Date Index is designed to measure the performance of a set of weighted return indices, each aligned with specific target date years, also referred to as vintages. Both series are based off the same underlying survey data, though there are differences in the way the indices are constructed (see Exhibit 1).
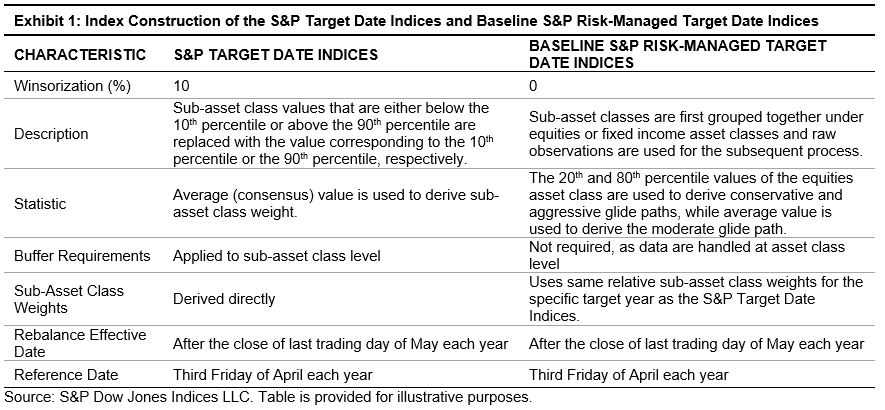
The construction of these baseline indices for the S&P Risk-Managed Target Date Indices is the first step of the process.
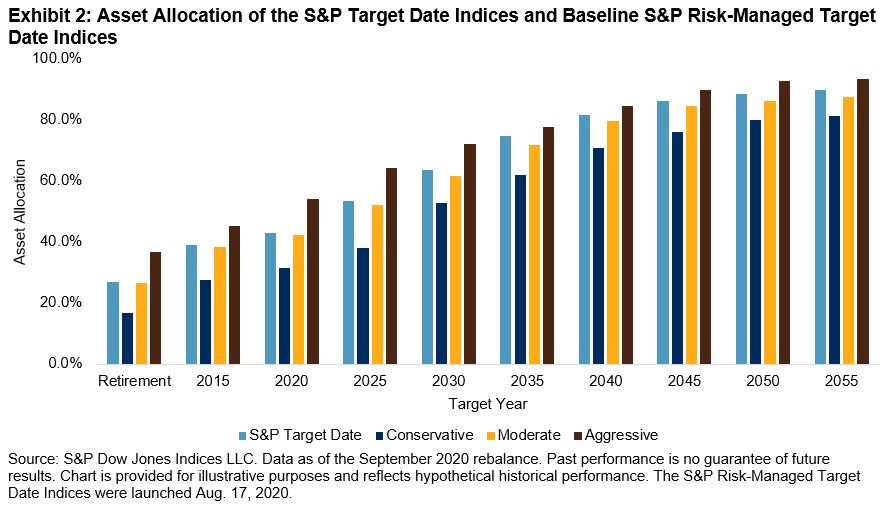
Exhibit 2 shows the respective equity allocations of the baseline S&P Risk-Managed Target Date Indices (conservative,moderate and aggressive)and S&P Target Date Indices. The allocations of the baseline S&P Risk-Managed Target Date (Moderate Glide Path) Indices were similar to those of the S&P Target Date Indices, but they were not identical due to differences in the construction explained in Exhibit 1.
Performance from June 2012 to September 2020
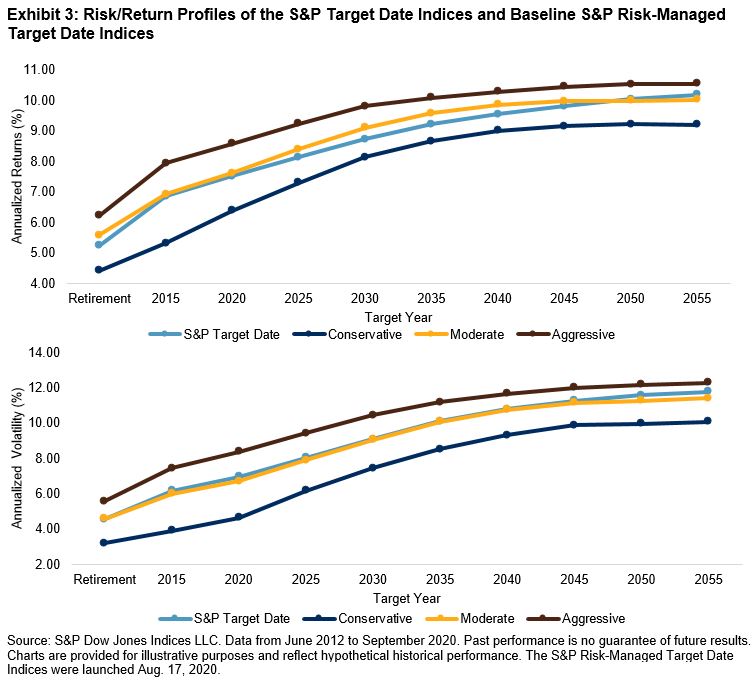
Exhibit 3 shows annualized returns and annualized volatilities of the baseline S&P Risk-Managed Target Date Indices and S&P Target Date Indices from June 2012 to September 2020. The annualized returns curve is upward sloping, indicating that far-dated vintages generated higher annualized returns than the near-dated vintages. This was due to higher equity allocated to far-dated vintages relative to near-dated vintages. The volatility curve is also upward sloping, indicating that the far-dated vintages exhibited higher annualized volatility than the near-dated vintages.The risk/return profile of the baseline S&P Risk-Managed Target Date (Moderate Glide Path) Indices was similar to that of the S&P Target Date Indices, though they exhibited differences in the underlying data (raw versus winsorized), which contributed to the slight variation in the performance and risk.
The Addition of the S&P 500® Managed Risk 2.0 Index and Its Performance
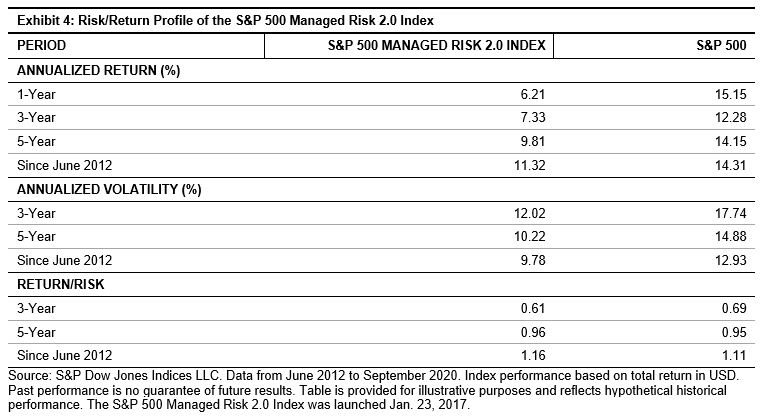
The last step in the construction of the S&P Risk-Managed Target Date Indices is to combine the respective baseline S&P Risk-Managed Target Date Indices (conservative, moderate, and aggressive) with the S&P 500 Managed Risk 2.0 Index. The S&P Target Date Indices do not have this additional component. The S&P 500 Managed Risk 2.0 Index generated similar risk-adjusted returns from June 2012 to September 2020, with a volatility reduction of 24.3% compared with the volatility of the S&P 500 (see Exhibit 4).
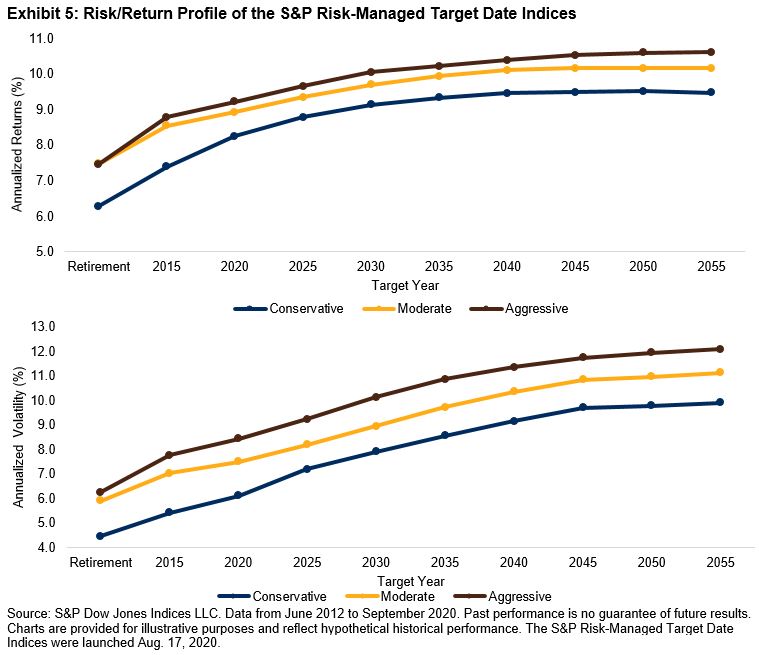
The annualized returns of the S&P Risk-Managed Target Date (Moderate Glide Path) Indices were consistently higher than those of the corresponding S&P Target Date Indices for each vintage during the analysis period (June 2012 to September 2020).The performance difference was attributed to the relative performances of the baseline indices and the allocation to the S&P 500 Managed Risk 2.0 Index and its performance during the analysis period.
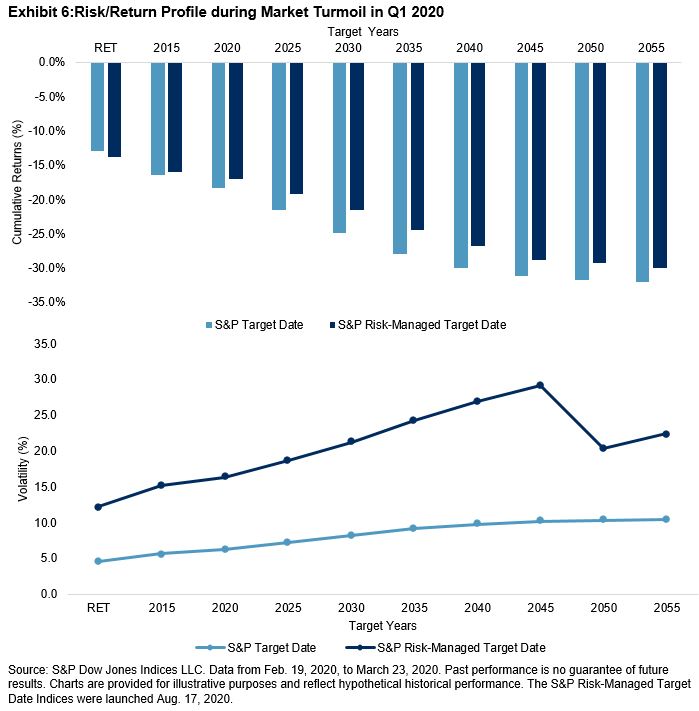
Performance during Market Turmoil in Q1 2020
We examined the performance of both series during the period of market turmoil from Feb. 19, 2020, to March 23, 2020. Due to an additional built-in risk component, the S&P Risk-Managed Target Date Indices were able to provide greater downside protection than the S&P Target Date Indices by mitigating losses and generating higher returns on risk-adjusted and absolute basis for all the vintages except for the retirement index (see Exhibit 6).
Thus, we have seen that there is a difference in the design of the S&P Target Date Indices and the S&P Risk-Managed Target Date Indices. The difference in allocation to various asset classes and their performance contributed to the overall differences in the risk/return profile of the indices during the analyzed period. Please refer to the S&P Target Date Index Series Methodology for more details.
The posts on this blog are opinions, not advice. Please read our Disclaimers.