Before making its permanent home at S&P DJI in 2004, the S&P Global BMI Series was introduced 15 years prior by Salomon Brothers in 1989. Although MSCI EAFE has the honor of being the first international equity index, the S&P Global BMI lays claim to a number of important firsts in the global indexing industry—the most important of these being that it was the first to incorporate float adjustment into the index methodology and to include large-, mid-, and small-cap constituents in a single, modular index series. In this regard, the S&P Global BMI set many of the key standards for modern global benchmark construction, as both MSCI and FTSE followed many years later in incorporating these core benchmark principles into their own index series (see Exhibit 1).
In our first blog in a series highlighting key features of the global equities benchmark landscape, we explore how the unmatched continuity and breadth of the S&P Global BMI historical data provides superior value to market participants.

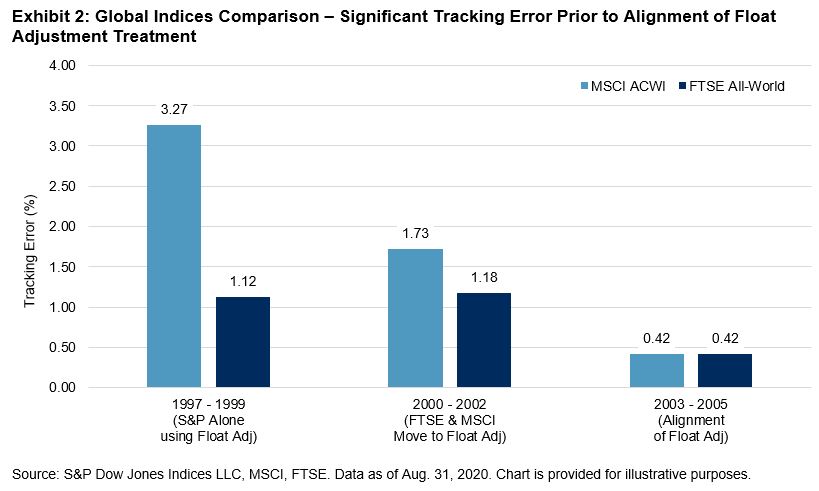
Float adjustment—now the industry standard for equity benchmarks—is necessary to accurately reflect shares that are available to global investors. This is particularly important in many international markets where governments and other strategic holdings tend to represent a significant portion of total equity market cap.
The relative stability derived from a consistent approach to float adjustment throughout history can be seen in the respective return series of similar global benchmarks (see Exhibit 2). Using the S&P Global LargeMidCap returns against competitor benchmarks, we compare the annualized tracking error in three consecutive three-year periods: 1) when S&P DJI was the only provider incorporating float adjustment; 2) during the MSCI and FTSE transition to float adjustment; and 3) after alignment. After 2001, once MSCI and FTSE completed the transition to float adjustment, the tracking error between the S&P Global LargeMidCap and the alternative indices was greatly reduced.
While the convergence of best practices by index providers has led to similar risk/return profiles of the indices in recent years (see Exhibit 3), users should be mindful of the differences that once existed. Significant breaks in methodology construction over time can introduce biases in historical index data, as the change in the methodology itself influences the characteristics and performance of the index.
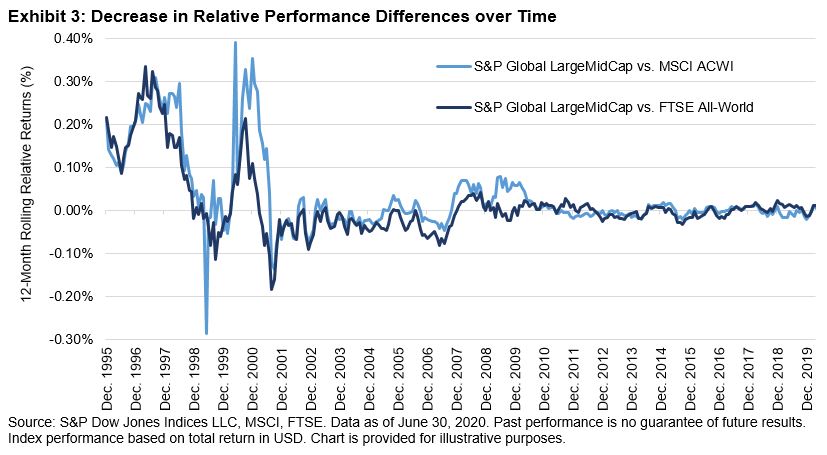
The continuous inclusion of large-, mid-, and small-cap stocks in a single benchmark and consistent use of float adjustment since 1989 means the S&P Global BMI Series eliminates important sources of bias compared with other indices that have undergone fundamental methodology changes during more recent times. Even if a particular index is used for official benchmarking purposes, the S&P Global BMI Series may serve as a valuable secondary data source—particularly if one is seeking an optimal index universe for historical research purposes, such as to back-test global investment strategies.
For further reading, see The S&P Global BMI: Providing Consistent Insights into Global Equity Markets since 1989.
The posts on this blog are opinions, not advice. Please read our Disclaimers.