Get Indexology® Blog updates via email.

In This List

Core and Satellite – The Best of Both Worlds

Viewing 20 Years of Indexed Core Assets Growth through a SPIVA® Lens

Quality Premium Needs Long-Term Investment Horizon

S&P PACT™ Indices: Empowering Investors Looking to Align with a 1.5°C Scenario

June Heatwave for Metal and Petroleum Commodities

Core and Satellite – The Best of Both Worlds

Contributor Image
Koel Ghosh

Former Head of South Asia

S&P Dow Jones Indices

The contentious debate of active versus passive is perpetual. Over the past 15 years, SPIVA® Scorecard results have reflected on the trends of active fund management vis a vis benchmarks, wherein statistics tilt the balance in favor of indexing. This recurring feature of benchmark outperformance is contributing to the adoption and growth of the passive investment space.

India is participating in the global passive growth with assets crossing the USD 25 billion mark. Since 1999, S&P Dow Jones Indices has been contributing to Indian markets by sharing its global index expertise to offer passive solutions and educate investors on the benefits of passive investing. The SPIVA India scorecard made its debut in 2013, and the results bear similarities to global trends. One category that stands out in its potential for passive allocation is the large-cap space, which the benchmark S&P BSE 100 has consistently outperformed (see Exhibit 1).

Asset allocation models are critical to achieving a portfolio’s investment objective. Beyond asset class diversification, a combination of strategies can prove beneficial. This is where the core and satellite strategy assists in effective portfolio construction. A strong core provides stability and can contribute to risk mitigation and, ultimately, reaching the financial objective of the portfolio.

Indexing offers the benefits of diversification, lower costs, transparency, lack of fund manager bias, flexibility, and a variety of investment categories from which to choose. These options vary from standard market beta to factor-, theme-, or strategy-based indices. Region and asset class can further widen the gamut of options. Exhibit 2 is demonstrative of the variance in performance of a standard Indian equity market benchmark versus a fixed income index, a factor-based index such as low volatility, a sectoral index, and a global index such as the S&P 500® over different time periods. Portfolio and investment goals can be directional in their core allocation strategy using various indexing alternatives. An active strategy as a satellite can selectively explore the inefficiencies in the market and scope undervalued market opportunities toward the achievement of the overall portfolio objective.

The core and satellite strategy can be used to derive the best of both worlds by using a diverse selection of indices as the core that provides the benefits of indexing, complemented by an active strategy as the satellite, thereby using a combination of a strategic and tactical allocation approaches to portfolio construction.

The posts on this blog are opinions, not advice. Please read our Disclaimers.

Viewing 20 Years of Indexed Core Assets Growth through a SPIVA® Lens

Contributor Image
Berlinda Liu

Former Director, Multi-Asset Indices

S&P Dow Jones Indices

In 1973, Princeton professor Burton Malkiel wrote the book, A Random Walk Down Wall Street, laying out a case against the mutual funds of the time as persistently underperforming market indices. Malkiel recommended[i] that the New York Stock Exchange create a fund that simply bought and held stock in the companies comprising the indices. Somewhat quaintly, he also suggested that the NYSE run the fund on a non-profit basis.[ii]

The 1976 initial offering for the first equity index mutual fund (tracking the S&P 500®) raised USD 11 million. Boosted by the proliferation of defined contribution retirement programs (401[k] plans in the U.S. arose from the Revenue Act of 1978) and turbocharged by ETFs starting in 1993 (again, first tracking the S&P 500), by 2019, USD 4.6 trillion was directly indexed to the S&P 500, with USD 6.4 trillion tracking all S&P DJI indices. S&P DJI estimates the cumulative savings from indexing versus active equity fund fees at USD 320 billion over 1996-2019, just for the S&P DJI benchmark indices.

While S&P DJI’s SPIVA series regularly looks in more depth around the world and by fund style, perhaps now is a good time to review the longer-term trends and continued value behind indexing. Over the past 20 years (May 2000-April 2020), an investor in an active fund had a roughly 90% chance of being outperformed by the corresponding S&P DJI benchmark. If the underperformance wasn’t punishment enough, nearly two-thirds of funds were merged or liquidated in that time, while one-quarter of funds drifted away from their initial style. Furthermore, SPIVA Persistence reports have consistently shown that even the top funds of one measurement period are unlikely to retain their ranking in the next.

However, the story is more than a binary sieve of funds underperforming or surviving. Exhibits 3 and 4 show the superior returns of indices, benefiting from better stock picking (or, more accurately, no stock picking) and not having the fee drag. Reinforcing Einstein’s claim of compound interest as the Eighth Wonder of the World, a “satisfied-with-just-average investor” earned between 0.8% and 2.8% more in annualized terms, resulting in an impressive 42%-184% cumulative benefit over 20 years.

Malkiel’s seminal work helped launched a revolution in investments and personal finance, arguably putting the book in the same league as The Wealth of Nations (Adam Smith, 1776) and Das Kapital (Karl Marx, 1867) for its influence on asset accumulation. Malkiel’s vision of a low-cost fund for the masses has finally come to fruition: capitalism and technology have guillotined costs, with most U.S. brokerages now charging zero commissions and numerous index funds’ annual fees measured in low-single-digit basis points.

[i] Malkiel was neither the first nor the only person with this observation and recommendation, but his book was more widely read than previous academic publications, especially among non-professional investors.

[ii] In fairness, the NYSE was nominally structured as a non-profit exchange until its 2006 IPO.

The posts on this blog are opinions, not advice. Please read our Disclaimers.

Quality Premium Needs Long-Term Investment Horizon

Contributor Image
Jason Ye

Director, Factors and Thematics Indices

S&P Dow Jones Indices

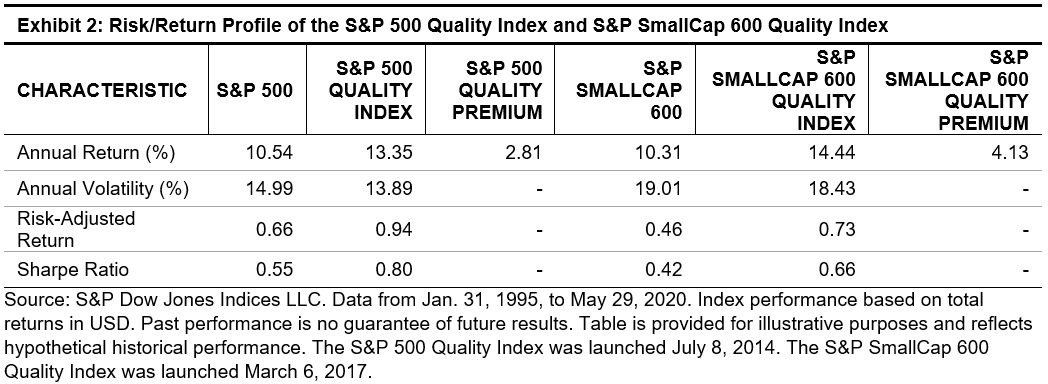
The quality factor has been outperforming the S&P 500® YTD, an accelerating trend in place since 2019.[i] In the small-cap space, however, quality underperformed the S&P SmallCap 600® in 2019 (see Exhibit 1). Despite this short-term divergence, quality has exhibited consistent premium in large caps and more profoundly in small caps throughout its history. To harvest this premium, a long investment horizon might be required.

Quality Stocks Can Offer Higher Return and Lower Risk

Quality is a well-documented premium in academic literature. Its fundamental principle can trace back as early as the 1930s, when Benjamin Graham advocated buying high-quality companies with attractive valuation.[ii] From empirical work over the past decade, researchers have documented quality’s persistence throughout its history[iii] and its prevalence in the U.S. and other countries.[iv]

The S&P 500 Quality Index and S&P SmallCap 600 Quality Index seek to measure the performance of the top 20% of stocks in the S&P 500 and the S&P SmallCap 600, respectively, ranked by their quality scores (equal weighted by their return-to-equity, financial leverage, and balance sheet accrual), weighted by the product of their quality scores and market capitalizations.

Since 1995, both quality indices outperformed their benchmarks with lower volatility (see Exhibit 2).

Looking at calendar-year returns, we found that the S&P 500 Quality Index outperformed the S&P 500 in 18 out of the past 25 years, with an average outperformance of 3.07% per year. Similarly, the S&P SmallCap 600 Quality Index outperformed the S&P SmallCap 600 in 20 out of the past 25 years, with an average outperformance of 4.5% per year (see Exhibit 3).

When Investing in Quality, Time Horizons Matter

Investment horizons have had meaningful impact on the size of the quality premium. Exhibit 4 shows the rolling one-year and three-year return differences between the S&P 500 Quality Index and the S&P 500, as well as between the S&P SmallCap 600 Quality Index and the S&P SmallCap 600. We can see that the three-year rolling outperformance was higher than the one-year rolling outperformance.

Next, we quantified the likelihood of beating the benchmark over different investment horizons (see Exhibit 5).

When the investment horizon was a period of three years, 79% of the S&P 500 Quality Index’s rolling three-year return beat the S&P 500, and 97% of the S&P SmallCap 600 Quality Index beat the S&P SmallCap 600. When the investment horizon increased to 10 years, 100% of quality indices’ rolling 10-year return beat their corresponding benchmarks. Clearly, increasing the investment horizon can improve the likelihood of capturing the quality premium and outperforming the underlying benchmark.

In summary, the quality factor has generated persistent premium in the large- and small-cap universes. To harvest the premium properly, market participants should consider a long-term investment horizon.

[i] Aye Soe. “The Quality Factor Beat the S&P 500 in 2019.” Indexology® Blog. January 2020. https://www.indexologyblog.com/2020/01/14/the-quality-factor-beat-the-sp-500-in-2019/.

[ii] Hamish Preston. “Quality: A Practitioner’s Guide?” S&P Dow Jones Indices. January 2017. https://www.spglobal.com/spdji/en/documents/education/education-quality-a-practicioners-guide.pdf.

[iii] Novy-Marx, R. 2013. The Other Side of Value: The Gross Profitability Premium. Journal of Financial Economics 108: 1-28. https://econpapers.repec.org/article/eeejfinec/v_3a108_3ay_3a2013_3ai_3a1_3ap_3a1-28.htm.

[iv] Fama, E. F. and K. R. French. 2017. International Tests of a Five-Factor Asset Pricing Model. Journal of Financial Economics 123: 441-463. https://www.sciencedirect.com/science/article/abs/pii/S0304405X1630215X.

The posts on this blog are opinions, not advice. Please read our Disclaimers.

S&P PACT™ Indices: Empowering Investors Looking to Align with a 1.5°C Scenario

How can indices provide greater insight into climate risk and help investors looking to go beyond traditional carbon reduction strategies? Take a closer look at the drivers behind the new S&P PACT™ Indices with S&P DJI’s Jaspreet Duhra and Andrew Innes.

Read more here: https://www.spglobal.com/spdji/en/education/article/transition-to-a-15-c-world-with-the-sp-paris-aligned-climate-transition-indices

The posts on this blog are opinions, not advice. Please read our Disclaimers.

June Heatwave for Metal and Petroleum Commodities

Contributor Image
Jim Wiederhold

Former Director, Commodities and Real Assets

S&P Dow Jones Indices

The S&P GSCI rose 5.09% in June and 10.47% for the second quarter of 2020. The recovery in the second quarter did not fully retrace the dramatic downside from the first quarter, as can be seen in the index’s -36.50% YTD return. Continued recovery in petroleum commodities contributed, but bullish sentiment in industrial metals such as copper helped keep the S&P GSCI in positive territory.

V-shaped moves off 2020 lows were not distinctive to just the S&P 500®. The S&P GSCI Brent Crude Oil rose 8.44% in June and 38.18% for Q2 2020. Reopening of economies across the world supported an increase of crude oil demand, as countries in lockdown slowly started to get back to pre-pandemic levels of activity. From a supply perspective, market participants will be closely monitoring the already shaky OPEC+ agreement to cut production with concerns that if it fell apart, there could be a repeat of the Saudi-Russia market share battle witnessed in Q1 2020.

The S&P GSCI Natural Gas tanked 10.13% after a similar severe drop in May, making it the lone energy-related commodity among the S&P GSCI’s 24 constituents with a double-digit percentage loss in June.

The S&P GSCI Industrial Metals rose 7.25% last month and 11.46% for the quarter. The S&P GSCI Copper was the biggest outperformer by far, up 11.91% in June and 21.07% for the second quarter. Higher PMI readings across the world and generally better economic data than the record weakness seen two months ago contributed to the positive sentiment for the building blocks of global industry.

The S&P GSCI Gold made a new high in June and is in striking distance of a new all-time high set back in August 2011. The S&P GSCI Silver experienced some profit taking but was up 29.17% for the second quarter and flat YTD. The gold-to-silver ratio remained above the 20-year average.

With abundant supply, the S&P GSCI Grains fell 0.56% in June. The S&P GSCI Wheat took the biggest hit for the month, down 6.61%. The S&P GSCI Sugar was the lone bright spot among the softs commodities, gaining 8.51% in June. Despite a recovery in prices since the beginning of the pandemic, higher sugar production is expected to weigh heavily on the market over the coming months. The two main products derived from sugarcane in Brazil, the world’s largest producer, are sugar and ethanol. Despite a recovery in oil prices, Brazilian mills continue to produce more sugar because the price of ethanol is low.

The S&P GSCI Livestock fell 7.43% in June. The S&P GSCI Lean Hogs fell 19.15% following ongoing cuts to U.S. slaughter capacity due to COVID-19 outbreaks at numerous plants and news that China would require all exporting countries to certify product free of COVID-19. China is a major export destination for U.S. pork, and in April the country accounted for approximately one-third of all U.S. pork exports.

The posts on this blog are opinions, not advice. Please read our Disclaimers.