Get Indexology® Blog updates via email.

In This List

Quality Premium Needs Long-Term Investment Horizon

S&P PACT™ Indices: Empowering Investors Looking to Align with a 1.5°C Scenario

June Heatwave for Metal and Petroleum Commodities

Can Top-Performing Funds Stay on Top over Time?

Making Sense of the Active Manager’s Conundrum

Quality Premium Needs Long-Term Investment Horizon

Contributor Image
Jason Ye

Director, Factors and Thematics Indices

S&P Dow Jones Indices

The quality factor has been outperforming the S&P 500® YTD, an accelerating trend in place since 2019.[i] In the small-cap space, however, quality underperformed the S&P SmallCap 600® in 2019 (see Exhibit 1). Despite this short-term divergence, quality has exhibited consistent premium in large caps and more profoundly in small caps throughout its history. To harvest this premium, a long investment horizon might be required.

Quality Stocks Can Offer Higher Return and Lower Risk

Quality is a well-documented premium in academic literature. Its fundamental principle can trace back as early as the 1930s, when Benjamin Graham advocated buying high-quality companies with attractive valuation.[ii] From empirical work over the past decade, researchers have documented quality’s persistence throughout its history[iii] and its prevalence in the U.S. and other countries.[iv]

The S&P 500 Quality Index and S&P SmallCap 600 Quality Index seek to measure the performance of the top 20% of stocks in the S&P 500 and the S&P SmallCap 600, respectively, ranked by their quality scores (equal weighted by their return-to-equity, financial leverage, and balance sheet accrual), weighted by the product of their quality scores and market capitalizations.

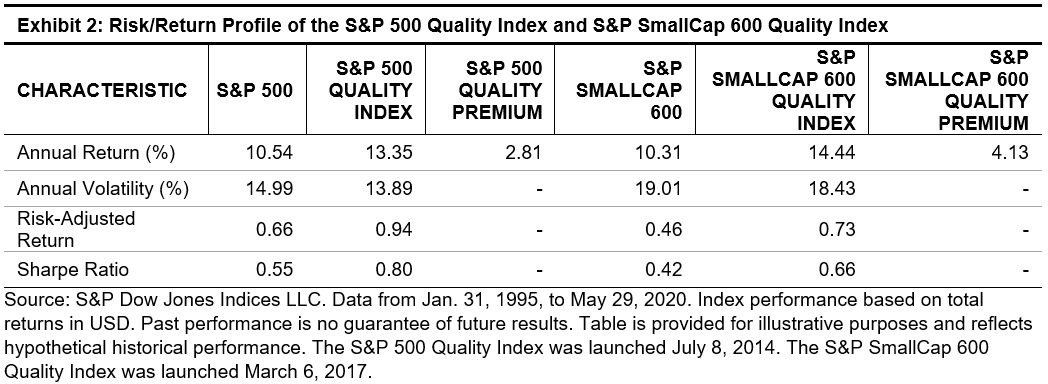
Since 1995, both quality indices outperformed their benchmarks with lower volatility (see Exhibit 2).

Looking at calendar-year returns, we found that the S&P 500 Quality Index outperformed the S&P 500 in 18 out of the past 25 years, with an average outperformance of 3.07% per year. Similarly, the S&P SmallCap 600 Quality Index outperformed the S&P SmallCap 600 in 20 out of the past 25 years, with an average outperformance of 4.5% per year (see Exhibit 3).

When Investing in Quality, Time Horizons Matter

Investment horizons have had meaningful impact on the size of the quality premium. Exhibit 4 shows the rolling one-year and three-year return differences between the S&P 500 Quality Index and the S&P 500, as well as between the S&P SmallCap 600 Quality Index and the S&P SmallCap 600. We can see that the three-year rolling outperformance was higher than the one-year rolling outperformance.

Next, we quantified the likelihood of beating the benchmark over different investment horizons (see Exhibit 5).

When the investment horizon was a period of three years, 79% of the S&P 500 Quality Index’s rolling three-year return beat the S&P 500, and 97% of the S&P SmallCap 600 Quality Index beat the S&P SmallCap 600. When the investment horizon increased to 10 years, 100% of quality indices’ rolling 10-year return beat their corresponding benchmarks. Clearly, increasing the investment horizon can improve the likelihood of capturing the quality premium and outperforming the underlying benchmark.

In summary, the quality factor has generated persistent premium in the large- and small-cap universes. To harvest the premium properly, market participants should consider a long-term investment horizon.

[i] Aye Soe. “The Quality Factor Beat the S&P 500 in 2019.” Indexology® Blog. January 2020. https://www.indexologyblog.com/2020/01/14/the-quality-factor-beat-the-sp-500-in-2019/.

[ii] Hamish Preston. “Quality: A Practitioner’s Guide?” S&P Dow Jones Indices. January 2017. https://www.spglobal.com/spdji/en/documents/education/education-quality-a-practicioners-guide.pdf.

[iii] Novy-Marx, R. 2013. The Other Side of Value: The Gross Profitability Premium. Journal of Financial Economics 108: 1-28. https://econpapers.repec.org/article/eeejfinec/v_3a108_3ay_3a2013_3ai_3a1_3ap_3a1-28.htm.

[iv] Fama, E. F. and K. R. French. 2017. International Tests of a Five-Factor Asset Pricing Model. Journal of Financial Economics 123: 441-463. https://www.sciencedirect.com/science/article/abs/pii/S0304405X1630215X.

The posts on this blog are opinions, not advice. Please read our Disclaimers.

S&P PACT™ Indices: Empowering Investors Looking to Align with a 1.5°C Scenario

How can indices provide greater insight into climate risk and help investors looking to go beyond traditional carbon reduction strategies? Take a closer look at the drivers behind the new S&P PACT™ Indices with S&P DJI’s Jaspreet Duhra and Andrew Innes.

Read more here: https://www.spglobal.com/spdji/en/education/article/transition-to-a-15-c-world-with-the-sp-paris-aligned-climate-transition-indices

The posts on this blog are opinions, not advice. Please read our Disclaimers.

June Heatwave for Metal and Petroleum Commodities

Contributor Image
Jim Wiederhold

Former Director, Commodities and Real Assets

S&P Dow Jones Indices

The S&P GSCI rose 5.09% in June and 10.47% for the second quarter of 2020. The recovery in the second quarter did not fully retrace the dramatic downside from the first quarter, as can be seen in the index’s -36.50% YTD return. Continued recovery in petroleum commodities contributed, but bullish sentiment in industrial metals such as copper helped keep the S&P GSCI in positive territory.

V-shaped moves off 2020 lows were not distinctive to just the S&P 500®. The S&P GSCI Brent Crude Oil rose 8.44% in June and 38.18% for Q2 2020. Reopening of economies across the world supported an increase of crude oil demand, as countries in lockdown slowly started to get back to pre-pandemic levels of activity. From a supply perspective, market participants will be closely monitoring the already shaky OPEC+ agreement to cut production with concerns that if it fell apart, there could be a repeat of the Saudi-Russia market share battle witnessed in Q1 2020.

The S&P GSCI Natural Gas tanked 10.13% after a similar severe drop in May, making it the lone energy-related commodity among the S&P GSCI’s 24 constituents with a double-digit percentage loss in June.

The S&P GSCI Industrial Metals rose 7.25% last month and 11.46% for the quarter. The S&P GSCI Copper was the biggest outperformer by far, up 11.91% in June and 21.07% for the second quarter. Higher PMI readings across the world and generally better economic data than the record weakness seen two months ago contributed to the positive sentiment for the building blocks of global industry.

The S&P GSCI Gold made a new high in June and is in striking distance of a new all-time high set back in August 2011. The S&P GSCI Silver experienced some profit taking but was up 29.17% for the second quarter and flat YTD. The gold-to-silver ratio remained above the 20-year average.

With abundant supply, the S&P GSCI Grains fell 0.56% in June. The S&P GSCI Wheat took the biggest hit for the month, down 6.61%. The S&P GSCI Sugar was the lone bright spot among the softs commodities, gaining 8.51% in June. Despite a recovery in prices since the beginning of the pandemic, higher sugar production is expected to weigh heavily on the market over the coming months. The two main products derived from sugarcane in Brazil, the world’s largest producer, are sugar and ethanol. Despite a recovery in oil prices, Brazilian mills continue to produce more sugar because the price of ethanol is low.

The S&P GSCI Livestock fell 7.43% in June. The S&P GSCI Lean Hogs fell 19.15% following ongoing cuts to U.S. slaughter capacity due to COVID-19 outbreaks at numerous plants and news that China would require all exporting countries to certify product free of COVID-19. China is a major export destination for U.S. pork, and in April the country accounted for approximately one-third of all U.S. pork exports.

The posts on this blog are opinions, not advice. Please read our Disclaimers.

Can Top-Performing Funds Stay on Top over Time?

Contributor Image
Berlinda Liu

Former Director, Multi-Asset Indices

S&P Dow Jones Indices

Many market participants attempt to identify future top-performing funds using managers’ track records. This practice implicitly assumes that managers’ successful track records reflect skill and that their superior performance will be repeated in the future. Since genuine skill is likely to persist, one key measure of active management skill is the consistency of a fund’s outperformance against its peers.

The U.S. Persistence Year-End 2019 Scorecard shows that few fund managers have consistently outperformed their peers.

The report tracks the top-quartile domestic equity funds of 2010-2014 and evaluates their relative performance for the 2015-2019 period. Contrary to the intuition that a top-quartile fund is more likely to stay in the leading pack, the report shows that their most likely outcome was liquidation or style change (39% together). Only 36% were able to beat the median performer of the peer group (see Exhibit 1). The same story occurred across all major domestic equity categories (see Exhibit 2); less than half of the 2010-2014 top-quartile funds stayed in the top half of the peer group for 2015-2019, and about one-third of them were merged, liquidated, or had a style change.

The most recent performance also cannot predict the future. For example, only 3.84% of domestic equity funds in the top half of the distribution in 2015 maintained that status annually through 2019, significantly below what random chance would predict.[1]  Similarly, just 0.18% of 2015’s top-quartile domestic equity funds maintained that performance over the next four years, again below random chance.[2]

Nevertheless, the report confirms that the worst-performing funds tend to end up in the merge or liquidation category. Fourth-quartile funds were generally the most likely to merge or liquidate over the subsequent three- and five-year windows, with nearly 38% of the bottom-quartile multi-cap funds of 2010-2014 disappearing by 2019.

Perhaps more surprisingly, style changes did not appear to be correlated with fund performance. Top, middle, and bottom performers within a category all generally had similar chances of style drift over the three- and five-year periods. Multi-cap funds had the highest percentage of style change, with 31% making a change over three years and 40% over five years.

The latest U.S. Persistence Scorecard underscores the general warning that past performance is no guarantee of future results. Like our previous reports, the study did not find evidence supporting performance persistence among active managers. Distilling skills from random success requires more complicated methodology beyond a mere peek at track records.

[1]   The odds of a top-half fund in one year randomly staying in the top half over the next four years are 50% * 50% * 50% * 50% = 6.25%, or 1/16.

[2]   25% * 25% * 25% * 25% = 0.39%, or 1/256.

The posts on this blog are opinions, not advice. Please read our Disclaimers.

Making Sense of the Active Manager’s Conundrum

Why are the market environments most conducive to generating positive absolute returns the least conducive to producing positive relative returns? Explore the active manager’s conundrum with S&P DJI’s Craig Lazzara and Anu Ganti.

Read more here: https://spdji.com/research/article/the-active-manager-s-conundrum

The posts on this blog are opinions, not advice. Please read our Disclaimers.