


Since the 2008/2009 financial crisis, BBB-rated bonds have seen significant growth in the U.S. Today, they constitute more than half of the U.S. investment-grade bond market. The increasing share of BBB-rated bonds has dragged the S&P U.S. Investment Grade Corporate Bond Index average credit rating lower, and is accompanied with higher leverage of BBB-rated bond issuers.
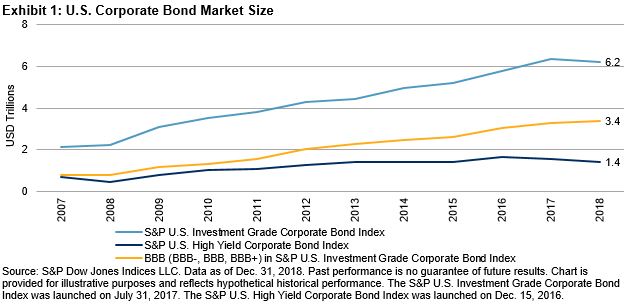
The U.S. corporate bond market has grown significantly since 1980. Issuance paused briefly in 2008 and the growth continued shortly after the global financial crisis. From 2007 to 2018, U.S. investment-grade and high-yield corporate bond markets[1] grew by 194% and 98%, respectively.
During the same time period, growth of BBB-rated bonds (which have the lowest credit rating among investment-grade bonds), outpaced both investment-grade bonds as a whole and high-yield bonds. BBB-rated bonds increased by 330%, or from USD 0.8 trillion to USD 3.4 trillion at year-end 2018 (see Exhibit 1). As of Dec. 31, 2018, BBB-rated bonds made up 55% of the S&P U.S. Investment Grade Corporate Bond Index, compared with 37% in 2007 (see Exhibit 2).

The investment-grade index’s larger share of BBB-rated bonds pulled down its average rating about one notch, as shown in Exhibit 3, from its pre-crisis rating of above A- to currently between A- and BBB+.[2] Most of the rating deterioration happened between August 2011 and June 2012, possibly reflecting the knock-on effects of the of U.S. credit rating downgrade of August 2011, particularly on insurance borrowers. The downward trend of the investment-grade index average rating has continued since late 2012, though at a milder rate.

The credit fundamentals of investment-grade bonds have evolved since 2007. Leverage for BBB-rated bonds as a whole has risen, as measured by net debt/EBITDA and debt/enterprise value (EV). We calculated net debt/EBITDA and debt/ EV for U.S.-domiciled nonfinancial corporate issuers (ultimate parent) of bonds of sizes greater than USD 750 million and maturity of less than 10 years. Our analysis included public companies only.[3]
Since 2007, the net debt/EBITDA ratio for U.S. issuers of investment-grade bonds went up from 1.49x to 2.16x at the end of 2018, while net debt/EBITDA for issuers of BBB-rated bonds rose faster, to an elevated 3.08x. Exhibit 5 illustrates the same up-trend in debt/EV for both investment-grade bond issuers as a whole and for BBB-rated bond issuers in particular.

[1] The S&P U.S. Investment Grade Corporate Bond Index and S&P U.S. High Yield Corporate Bond Index are used for this blog to approximate the U.S. investment-grade and high-yield corporate bond markets, respectively.
[2] An equal-paced mapping is applied to convert letter-graded ratings to numerical scales and aggregate ratings on index levels.
[3] For this analysis, we excluded bonds issued by the GE family because the combination of its volatile credit rating and high leverage ratio makes the index average leverage difficult to read.
The posts on this blog are opinions, not advice. Please read our Disclaimers.


