Get Indexology® Blog updates via email.

In This List

Transformational Change in the REIT Industry

Crude Oil Can Get Carried Away by Contango

2020 – The Dawn of the Passive Investing Era in India: Part Two

Is ESG a Factor? The S&P 500 ESG Index’s Steady Outperformance

Why The S&P 500® Matters in India

Transformational Change in the REIT Industry

Contributor Image
Michael Orzano

Head of Global Exchanges Product Management

S&P Dow Jones Indices

The economic and societal effects of the COVID-19 pandemic accelerated secular trends that have been reshaping the commercial real estate industry for years. Core U.S. REIT sectors such as Retail, Office, and Residential, which once dominated the REIT landscape, have ceded ground to specialized REITs—particularly those owning data centers and cell towers. Industrial REITs have also increased in importance, supported by e-commerce growth.

As of Dec. 31, 2015, Data Center, Tower, and Industrial REITs (in aggregate) accounted for 17% of the Dow Jones Equity All REIT Index—a broad index covering U.S. equity REITs. By the end of 2019, their share of the index weight rose to 30%, and by the end of May 2020, these sectors represented more than 42%. Meanwhile, Retail REITs dropped from 19% to 5%.

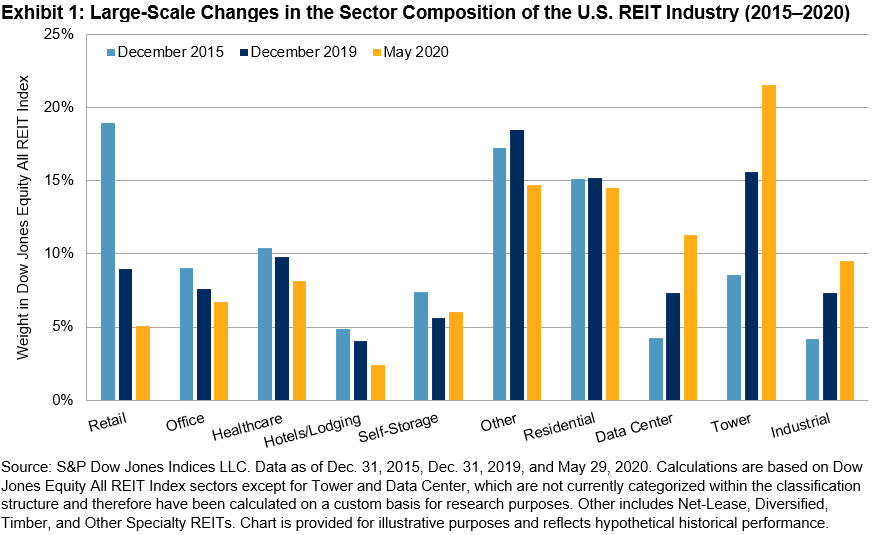
The Retail sector, in particular, has been hampered by the growth of e-commerce, as demand for space in malls and shopping centers has diminished due to increased online shopping. One of the primary beneficiaries of this trend was Industrial REITs—many of which support logistics for e-commerce. Tower REITs benefited from strong demand for infrastructure to support growing wireless data usage, while Data Center REITs boomed from the growing need for high quality space to store servers and other computing equipment.

All these trends were sharply accelerated by the pandemic, which has driven a far larger share of economic activity online, spurring even greater demand for data centers, wireless communication, and industrial warehouses. Meanwhile, travel has come to a near standstill, leaving hotel occupancies at record lows. Companies are now rethinking how much office space they will need in the future, as remote working becomes more common, and retirees are rethinking the safety of living in retirement communities owned by Healthcare REITs.

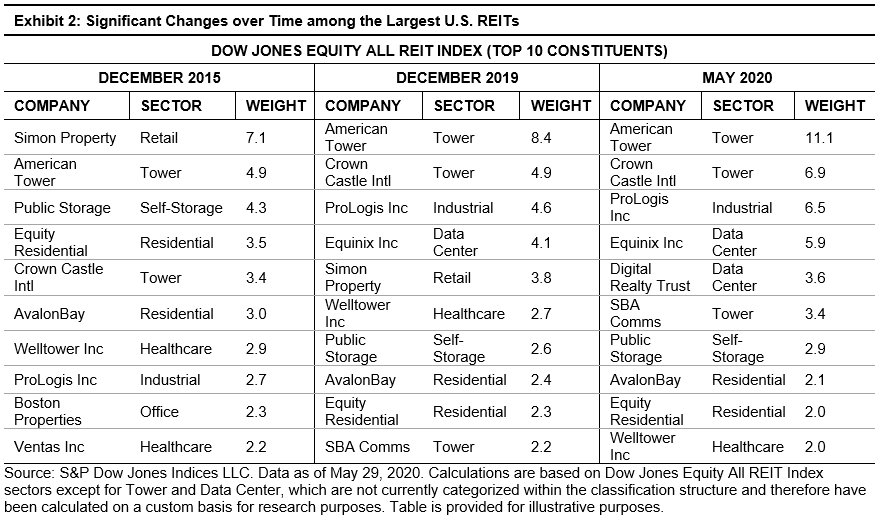
These changes in sector leadership are also illustrated through the top constituents of the Dow Jones Equity All REIT Index. As of the end of May 2020, five of the six largest U.S. REITs were either Tower or Data Center REITs. Furthermore, Simon Property—the largest U.S. REIT for many years—no longer resides within the top 10. The industry has also become somewhat more concentrated over the years, spurring demand for capped versions of headline indices, such as the Dow Jones Equity All REIT Capped Index.

These transformations in the composition of the U.S. REIT market have, of course, been driven primarily by relative performance. Perhaps more than any other equities market sector, the dispersion of sub-sector returns within the Real Estate sector has been highly variable both in the short- and longer-term. As shown in Exhibit 3, Data Center and Tower REITs gained 20% and 18%, respectively, YTD through May 29, 2020, while Industrial REITs also posted positive returns. On the other hand, Retail and Hotels/Lodging dropped 51% and 48%, respectively.

These performance trends were remarkably similar directionally over the longer term. Between the end of 2015 and May 2020, Tower, Data Center, and Industrial REITs experienced cumulative gains in excess of 130%, while Retail and Hotels/Lodging declined sharply.

In our paper, Understanding REIT Sectors, published in January 2020, we highlighted how the U.S. REIT industry has expanded over the years beyond traditional property types to include a diverse set of companies driven by a wide range of underlying factors. The COVID-19 pandemic has shined a bright light on the evolution underway in the REIT industry.

I would like to extend a special thanks to Qing Li for her contribution to this blog.

The posts on this blog are opinions, not advice. Please read our Disclaimers.

Crude Oil Can Get Carried Away by Contango

Contributor Image
Fiona Boal

Managing Director, Global Head of Equities

S&P Dow Jones Indices

The long-term impact of the COVID-19 pandemic on commodities markets is not yet known. There have undoubtedly been short-term impacts on supply and demand, ranging from a collapse in oil demand to supply disruptions at individual mines as a result of COVID-19 infections among mine employees.

The longer-term implications of these demand and supply shocks, while uncertain, will likely follow a well-trodden path that eventually leads to market equilibrium. What is less clear is the long-term impact on the commodity investment landscape. The negative price action in the WTI crude oil futures market in April 2020 may well force investors to rethink the standard narrative around investing in commodities.

For investors, it is extremely difficult to access the return streams of physical commodities traded in the spot market. The closest approximation is a strategy that invests in rolling front-month futures contracts. That is exactly what the S&P GSCI Crude Oil does. The headline S&P GSCI series of indices follows a rolling schedule that ensures that futures positions roll to the following month’s contract well before the expiration of the current contract. This ensures that investors do not hold any exposure as a futures contract enters expiration, which is particularly important for commodity futures that allow for physical settlement.

With that in mind, we examined the events that took place in the oil market in April and early May 2020. The S&P GSCI Crude Oil had already rolled into the June contract when the May WTI crude oil futures contract closed at USD -37.63 per barrel on the penultimate day of trading. The front-month rolling S&P DJI Commodities Indices that included WTI crude oil therefore did not directly contend with negative prices. Instead, they fell prey to the super contango in the WTI crude oil market.

When a futures curve is in contango, investors pay to roll futures contracts. Commonly referred to as a negative roll yield, contango results in a significant drag on index performance. Super contango occurs when the spot price for a commodity trades substantially below the futures price. Super contango usually occurs when storage space becomes scarce due to excess supply—meaning that the cost of carry (the cost of storing a physical commodity) increases. Exhibit 1 presents the impact of super contango on the WTI crude oil market by illustrating the difference in performance between the S&P GSCI Crude Oil spot return and the S&P GSCI Crude Oil Excess Return (ER) since the beginning of 2020.

The overarching lesson for investors from the oil market is that there are additional risks when investing in products that replicate price movements on a futures curve. The risk is particularly acute in extreme conditions when returns associated with the underlying product become magnified as futures prices react to market conditions.

In short, market participants need to be aware of the unique return streams associated with futures-based investment strategies, especially the investment implications of holding long-only commodity positions at the front of the futures curve during periods of extreme market stress.

The posts on this blog are opinions, not advice. Please read our Disclaimers.

2020 – The Dawn of the Passive Investing Era in India: Part Two

Contributor Image
Koel Ghosh

Former Head of South Asia

S&P Dow Jones Indices

The previous blog highlighted the significant shifts to passive investing in India. However, Indian passive trends have continued to favor plain vanilla indices due to their ease of understanding, rather than exploring alternative thematic indices, such as the S&P Kensho New Economies Indices or factor Indices. However, once the acceptability and acceptance of passive investment grows, the need for variety will arise. The simple progression would be toward factor play initially.

The month-end statistics for May 2020 revealed the parity of global and Indian markets in the quality factor. Companies with low leverage and high returns on equity have rewarded the quality factor. The S&P BSE Quality Index gained 2% in May 2020 and outperformed the S&P BSE SENSEX by 11%. The U.S., European, and Australian markets witnessed the same monthly trends (see Exhibit 1).

Taking a long-term perspective on any investment strategy is essential, including passive strategies. Exhibit 2 shows that market cycles over different time periods reflected different performance results for the quality factor, however, it was the long-term winner.

There is a need for more education and investor awareness on the benefits of passive investing. It is important that investors understand that passive investing involves an investment strategy that tracks or mimics an index. The advantages of diversification, low concentration risk, transparency, and lower costs strengthen the case for choosing this option. Index-based investing makes it easy for those who are not actively tracking markets by allowing them index-based returns.

Historically, Indian markets have been a pure active investing play in which funds were deployed by active fund managers in various strategies. With the dawn of passive investing, the value of low-cost indices with no active bias, consistent methodologies, and transparent rules started gaining attention. The SPIVA® (S&P Dow Jones Indices versus Active) India Scorecard added some more conviction to the passive claims. The SPIVA India Scorecard, which was first published in 2013, has laid witness to the fact that benchmarks have outperformed active funds. One such example has been the large-cap space that has witnessed a consistent 50% and above outperformance of benchmarks over active funds in the 5-year and 10-year investment horizons.[1]

The Indian passive wave has received the necessary nudge by initiatives from the Indian government, be it the Employees Provident Fund allocations to exchange-traded fund (ETFs) in benchmark indices, the disinvestment program being mobilized via the ETF route, or encouraging retail participation in fixed income via passive strategies. These initiatives have provided the necessary impetus to the passive market in India to gather more participation from product issuers and investors. While it is still early days for a wider selection and more innovative products, this is a great beginning to an optimistic growth trajectory for the Indian passive market.

[1] SPIVA India Year-End 2019 Scorecard.

The posts on this blog are opinions, not advice. Please read our Disclaimers.

Is ESG a Factor? The S&P 500 ESG Index’s Steady Outperformance

Contributor Image
Ben Leale-Green

Former Associate Director, Research & Design, ESG Indices

S&P Dow Jones Indices

Since launching the S&P ESG Index Series, we have been continuously asked the same question: Can environmental, social, and governance (ESG) be considered a factor that outperforms? In short, since its launch in January 2019, the S&P 500® ESG Index has outperformed (see Exhibit 1).

We further analyzed the performance characteristics of the S&P 500 ESG Index against our suite of S&P Factor and Style Indices (see Exhibit 2).

While growth, quality, and momentum fluctuated their way to a position of strong relative outperformance, ESG showed slow, steady outpeformance over the S&P 500. Size, low volatility, and value performed relatively worse over the period (see Exhibit 3). This distinction in behavior may be explained by the construction and objective of each index. While the S&P 500 ESG Index aims to deliver core-like returns with low tracking error to the S&P 500, the S&P Factor and Style Indices are designed to target differentiated and less correlated returns to the benchmark.

However, it is unsurprising to note that the excess return of the S&P 500 ESG Index was negatively correlated to the S&P 500 Equal Weight Index, which was likely attributable to the large-cap bias present in the S&P 500 ESG Index.

Given the variation of active risk of each index versus the S&P 500, we normalized the relative performance (excess returns/tracking error) to understand the consistency of outperformance observed. These form information ratios (see Exhibit 4).

What drove this outperformance and can we expect it to continue? The drivers of ESG outperformance require further analysis than this blog provides. The S&P 500 ESG Index’s outperformance may be attributed to a successful mix of factors during the period, uncorrelated ESG alpha, inflows into ESG strategies, a combination of these, or something else.

Factors such as value, momentum, and size have been studied in both industry and academia for many decades, whereas ESG score-based indices are a relatively recent phenomenon. In ESG’s shorter lifespan, there have been large-scale shifts to integrating sustainability-based criteria into the investment process. At S&P Dow Jones Indices, we are fortunate that S&P Global (our parent company) acquired SAM, who has been integrating ESG scores into the investment process for over 20 years. In this time, company disclosure has improved and methodologies have evolved with sustainability-based norms. When considering this, having the same degree of confidence in the future outperformance of ESG may be naive.

How has ESG performed in other regions? With the exception of Japan, which showed a small underperformance, each region outperformed, including Europe, the U.S., Latin America, and other global variants (see Exhibit 5).

Overall, since its launch, the S&P 500 ESG Index has seen slow, gradual outperformance over the S&P 500, with compelling information ratios compared with S&P Factor and Style Indices. Similar outperformance has been observed in other regions, too. Will this continue? We’ll need more time to gain reasonable confidence, but it does make an attractive graph for now.

The posts on this blog are opinions, not advice. Please read our Disclaimers.

Why The S&P 500® Matters in India

Contributor Image
Hamish Preston

Head of U.S. Equities

S&P Dow Jones Indices

We recently held a webinar examining the relevance of the S&P 500 to India-based investors, the potential diversification benefits of incorporating U.S equity exposure to an existing allocation, as well as showing how difficult active managers have found it to beat the index, historically.  You can watch a replay of the webinar here; here are a few highlights.

Having a U.S. view is important for investors around the world.

As we have highlighted before, having a U.S. view is vital in a global equity portfolio context.  U.S. companies account for a significant proportion of the global equity market capitalization, therefore trends impacting these companies will be relatively important in driving global equity returns.  For example, the total market capitalization of S&P 500 companies is many multiples larger than other country components of the S&P Global BMI, our global equity benchmark.

Combined with the fact that the S&P 500 accounts for over 80% of the U.S. market, it is perhaps unsurprising that so many people turn to the index to gauge U.S. market performance.  Indeed, our latest Survey of Indexed Assets shows that over USD 11.2 trillion was indexed or benchmarked to the S&P 500 at the end of 2019.

The S&P 500 can help to diversify domestic sector biases.

For exposure to certain sectors, Indian investors may find it beneficial to turn to the U.S. – S&P 500 companies accounted for most of index market capitalization in the S&P Global BMI Information Technology, Health Care and Communication Services sectors at the end of May.  Such sizeable representation helps to explain why the S&P 500 has higher weights in these market segments compared to the Indian equity market, as represented by the S&P BSE 500 index.  More broadly, differences in sector breakdowns in the two indices illustrate how the S&P 500 can help to diversify the Indian equity market’s sector biases.

Active managers have struggled to beat the S&P 500, historically.

An important choice for investors is whether to take an index-based approach or to employ an active manager to try and outperform the market. While this debate seems to be evergreen – there are ardent supporters on both sides – S&P Dow Jones Indices publishes semi-annual SPIVA® scorecards to inform the debate.  In particular, SPIVA scorecards compare the performance of active managers against their S&P index benchmarks across multiple regions.

Exhibit 3 shows the majority of large-cap U.S. active managers typically underperformed the S&P 500 since 2001:  the majority of funds underperformed in 16 of the last 19 calendar year periods.  Given this underperformance is frequently observed on a risk-adjusted basis and the start of 2020 offered active managers no place to hide, many may wish to consider the potential benefits of taking an index-based approach.

To sign up for S&P Dow Jones Indices’ scorecards and market commentary, use this link.

The posts on this blog are opinions, not advice. Please read our Disclaimers.