Get Indexology® Blog updates via email.

In This List

Business as Usual for the S&P Paris-Aligned Climate Indices

Impact of Dividend Announcements on S&P DJI Dividend Indices

Meet the S&P Paris-Aligned and Climate Transition Indices

Will April Pain Lead to May Gain for Commodities?

ETFs Add to African Access

Business as Usual for the S&P Paris-Aligned Climate Indices

Contributor Image
Leonardo Cabrer

Director, Global Research & Design

S&P Dow Jones Indices

On April 20, 2020, the S&P Eurozone LargeMidCap Paris-Aligned Climate Index (S&P Eurozone PA Climate Index) was launched (see press release). This index has been designed to align with recommendations from the Task Force on Climate-related Financial Disclosures and follow the new minimum standards for EU Paris-Aligned Benchmarks proposed by the EU,[1] while remaining as close as possible to its benchmark index, the S&P Eurozone LargeMidCap.

The current market conditions have put the effectiveness of the index methodology to the test. One of the main requirements of the regulation is that the carbon intensity of the index adheres to a strict trajectory of 7% reduction year-on-year.

In this short piece, we will analyze the impact of the recent market movements on the carbon intensity of the S&P Eurozone PA Climate Index and whether this has impeded the index’s ability to meet its 7% decarbonization goal.

First, we need to ask ourselves: why does market movement affect the index’s carbon intensity?

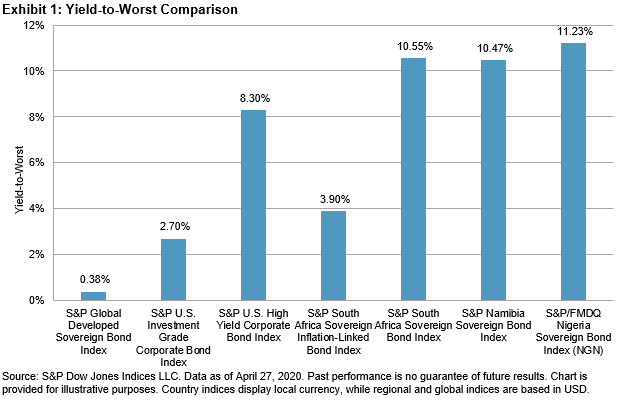
There are several approaches to measure the “carbon intensity” of a portfolio. The EU regulation stipulates that the carbon intensity of a company should be measured by dividing its Greenhouse Gas (GHG) emissions by its Enterprise Value Including Cash (EVIC). The index carbon intensity is the weighted-average carbon intensity (WACI) of its constituents. Therefore, when the EVIC of the index portfolio increases, the index WACI decreases and vice versa. Since the market capitalization of equities contributes substantially to EVIC, it is reasonable to assume that when the index level goes down, the carbon intensity of the index goes up.

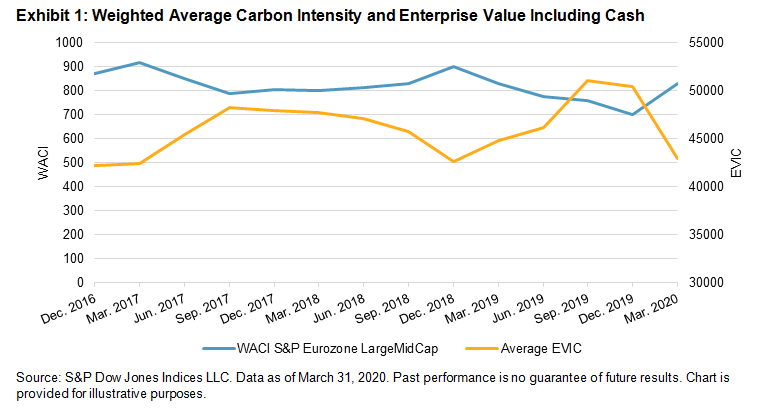
In the first quarter of 2020, the S&P Eurozone LargeMidCap’s WACI (including Scope 3 emissions) increased by 18%. However, the chart shows that the main driver of this change was the 14% decrease in the average EVIC of its constituents (see Exhibit 1). Put simply, the recent market drop has made the carbon intensity of the index appear worse even without any companies necessarily increasing their GHG emissions.

The question remains: has the S&P Eurozone PA Climate Index remained below its decarbonization trajectory during this period? The answer is a resounding yes (see Exhibit 2).

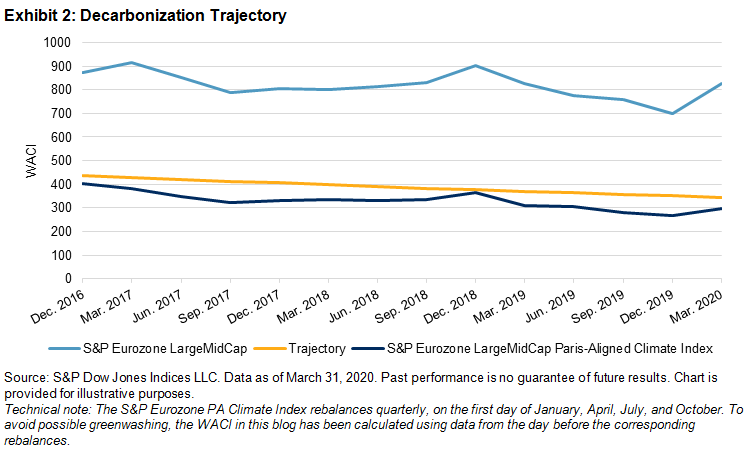
The yellow line indicates the 7% decarbonization trajectory required for the S&P Eurozone PA Climate Index. The index has remained below its allocated trajectory for every quarter since its inception. We can see that in the two periods (December 2018 and March 2020) when the EVIC suffered substantial decreases (see Exhibit 1) the S&P Eurozone PA Climate Index’s WACI moved closer to its required trajectory, but never exceeded it.

The dependency of EVIC on WACI was already noted by the Technical Expert Group (TEG) recommendations. To ensure that GHG emissions change is the main driver of the decarbonization of any climate benchmark, the TEG proposed adjusting the WACI by the average index-level EVIC increase/decrease (see Exhibit 3).

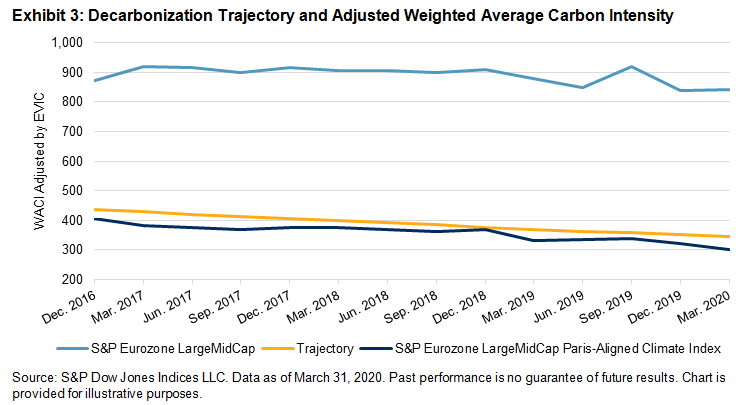
Exhibit 3 shows that the S&P Eurozone PA Climate Index’s adjusted-WACI tracks the required trajectory closely. This is because the WACI adjustment for index-level EVIC changes is an integral part of the methodology (see page 12 of the methodology).

In short, since the S&P Eurozone PA Climate Index targets decarbonization using the adjusted-WACI approach, we can rest assured that significant changes in the benchmark index level will have little impact on it meeting its climate objectives.

Exhibit 3 also shows that S&P Eurozone LargeMidCap-adjusted WACI has only reduced 3.4% since December 2016, while the S&P Eurozone PA Climate Index has reduced its WACI by 25.7%, well below the 21.0% required by the trajectory for the same period, without overshooting the required trajectory.

In summary, the current market conditions have provided an excellent opportunity to test the robustness of the methodology behind the S&P Paris-Aligned Climate Indices. The S&P Eurozone PA Climate Index passed with flying colors and successfully maintained its climate objectives. Now, back to business as usual.

The posts on this blog are opinions, not advice. Please read our Disclaimers.

Impact of Dividend Announcements on S&P DJI Dividend Indices

Contributor Image
Ari Rajendra

Senior Director, Head of Thematic Indices

S&P Dow Jones Indices

Dividend-paying companies have been in the spotlight as a direct consequence of the ongoing COVID-19 pandemic and crude oil glut crisis. A combination of strained corporate cash flows and political intervention has seen many companies cancel, cut or postpone payments globally.

In this blog, we examine the potential impact of these events on the S&P DJI Dividend Indices.

The Dividend Review Timetable

Broadly, there are two categories of reviews: monthly and annual/semiannual. Monthly reviews are intended for maintenance, typically to remove stocks that have cancelled their dividends, while annual or semiannual rebalances are full reviews of each index to ensure alignment with their respective methodologies. The schedule of reviews (see Exhibit 1) gives us a timeline of potential constituent changes for various dividend indices. Per the timeline, the most imminent change is the April monthly review (effective as of April 30, 2020, close).

April 2020 Monthly Review: 36 Securities Deleted across 12 Indices

The S&P DJI Index Committee confirmed the deletions from its dividend indices as part of its regular monthly reviews on April 23, 2020. However, it also announced that it will suspend the April and May 2020 monthly reviews for the S&P UK High Yield Dividend Aristocrats (HYDA) and the S&P Euro HYDA.

Exhibit 2 highlights all changes from the review; the S&P Global Dividend Aristocrats, S&P/TSX Canadian Dividend Aristocrats, and S&P 500® High Dividend Index will have the most changes in terms of number of securities and index weight.

Most Indices May See Limited Medium-Term Impact

Based on public announcements, we further analyzed the existing index constituents to evaluate potential turnover at the upcoming annual reviews or subsequent monthly reviews. To accomplish this, we assigned constituents into four main categories (see Exhibit 3):

  • Announced Drops: As confirmed by the S&P DJI Index Committee;
  • Cancel/Decrease: Companies that have publicly indicated or been advised to cancel or decrease dividends;
  • Increase/Maintain: Companies that have announced they would maintain or increase dividends;[1] and
  • Unknown: Companies that have not announced or postponed ex-dates.

With the exception of the S&P UK HYDA and S&P Euro HYDA, a large part of the S&P Dividend Aristocrats Indices could have a limited impact, with an average of 6% indicating a cancel or decrease, while 84% announced they would maintain or increase.

Looking across all dividend indices, we identified five indices that see greater than 20% of their respective compositions under the Cancel/Decrease category: the S&P UK HYDA, S&P Euro HYDA, S&P Emerging Markets Dividend Opportunities Index, Dow Jones EPAC Select Dividend Index, and Dow Jones Asia/Pacific Select Dividend 30 Index. The S&P UK HYDA stands out and is reflective of the dividend landscape in the UK, where over 40% of companies have cancelled dividends.

It is important to note that the Unknown category does not necessarily indicate negative action. Companies in this category have simply not made announcements or postponed their ex-dates.

Sectors Impacted Varied across Regions

The sectoral impact for indices with greater than 10% of their index compositions categorized under Cancel/Decrease and Announced Drops was relatively distinct for each region. The impact in Asia Pacific was largely concentrated among three sectors, in contrast to other regions that were more distributed. Exhibit 4 shows that Materials contributed meaningfully to all regions and Retailing also had a significant impact for most regions, particularly Asia Pacific.

These are unprecedented and testing times for dividend strategies, and the S&P DJI Index Committee continues to monitor and take necessary action to ensure its dividend indices conform to their objectives. While many of the S&P U.S. Dividend Indices have weathered the storm relatively well, the standout was the S&P 500 Dividend Aristocrats, which had no deletions announced for the April monthly review. Interestingly, it also incorporates the deepest sustainable screen by only including companies that have increased dividends over 25 years.

This blog does not provide any indication of the likely course of action by the S&P DJI Index Committee, with the exception of the confirmed and announced changes.

[1]   For the S&P High Yield Dividend Aristocrats and S&P MidCap 400® Dividend Aristocrats, only increases were considered in Increase/Maintain, while maintained dividends were classified under Cancel/Decrease.

The posts on this blog are opinions, not advice. Please read our Disclaimers.

Meet the S&P Paris-Aligned and Climate Transition Indices

How can investors look to reduce financially impactful exposure to transition risk and physical risks whilst gaining exposure to opportunities arising from climate transition?  S&P DJI’s Ben Leale-Green explores how our new indices go beyond the scope of the Paris Agreement aligning with a 1.5 degree climate trajectory.

The posts on this blog are opinions, not advice. Please read our Disclaimers.

Will April Pain Lead to May Gain for Commodities?

Contributor Image
Jim Wiederhold

Former Director, Commodities and Real Assets

S&P Dow Jones Indices

COVID-19 continued to wreak havoc across commodities markets in April. The S&P GSCI fell 9.67% in April and 47.92% YTD. Economic data continued to weaken into uncharted territory. Supply chains crucial to the flow of commodities from extraction to consumption experienced a sudden shut off and demand collapsed. Energy and agriculture underperformed, while metals offered some green shoots.

With the collapse of front-month oil prices on April 20, 2020, the full effect of the oil supply glut was revealed. Market historians can now add negative oil prices to the list of unprecedented market events of 2020. Demand disappearance, diminishing storage capacity, and physically settled May WTI crude oil contracts produced a perfect storm for energy-related commodities. Global energy demand could slump by 6% in 2020 due to the restrictions placed on transport and industrial activity in what would be the largest contraction in absolute terms on record, according to the International Energy Agency. Compounding the hit to price levels that the COVID-19 pandemic has had on demand, oil output from OPEC was the highest since March 2019. OPEC+ production cuts are expected to take effect from the start of May 2020. After falling 54.72% in March 2020, the S&P GSCI Crude Oil dropped another 40.69% in April 2020. Crude oil volatility spiked to all-time highs as the weakness was felt across all oil products.

The S&P GSCI Industrial Metals rose 0.96% in April, reversing some of the downside seen in March. Copper and nickel were both supported by China restarting production facilities that had been on lockdown, as well as supply chain disruptions.

With elevated levels of volatility across assets, the S&P GSCI Gold rose 6.03%, outshining all other commodities and demonstrating its safe-haven status during times of market uncertainty. According to the World Gold Council, investment demand for the yellow metal rose 80% in Q1 2020 compared to the same quarter last year, which offset a 39% fall in jewelry demand.

The S&P GSCI Grains fell 6.25%, with weakness seen across the board. The S&P GSCI Corn underperformed the most (-7.60%) due to its correlation to energy in the ethanol space. The dramatic increase in demand for grocery store food items could not offset the historic lack of demand for ethanol. Cocoa, cotton, and coffee reversed their divergent performance from the prior month. After a strong March, the S&P GSCI Coffee dropped 11.87% in April. After double-digit declines in March, the S&P GSCI Cotton and S&P GSCI Cocoa both advanced 11.56% and 7.12%, respectively.

The S&P GSCI Livestock dropped 5.15% in April. Millions of pounds of meat are expected to be missing from the U.S. supply chain as several major meat producers shut down plants and slaughterhouses. Meat shortages at grocery stores are expected in the near term, as farmers face the likely culling of herds because they will not have anywhere to sell their livestock to be processed. In April, it was estimated that nearly a third of U.S. pork processing capacity was offline.

The posts on this blog are opinions, not advice. Please read our Disclaimers.

ETFs Add to African Access

Contributor Image
Kevin Horan

Former Director, Fixed Income Indices

S&P Dow Jones Indices

The exchanged-traded fund (ETF) structure has led to increased investment options within fixed income, and the African markets are a clear example of this. Over the past few years, several African ETFs have been introduced to the market, tracking indices provided by S&P Dow Jones Indices in South Africa, Nigeria, and Namibia, giving investors options to participate in this investment space. With transparent indices and tight-knit local ties, S&P Dow Jones Indices and ETF providers have opened asset classes that historically were only accessible to large and more sophisticated investors. Market segments such as high yield, emerging markets, and international markets, which were inaccessible just a few years ago, have become an investment opportunity for all market participants. In addition to accessibility, the yields of African sovereign bonds have tended to be higher than both investment-grade and high-yield corporate bonds in the U.S.

The ETF structure has been around since the early 1990s and has become a popular approach to investing for both equity and debt investments. ETFs are no longer considered a niche product and a growing number of organizations utilize this investment vehicle. The ETF structure has made it easier and cheaper to own and trade big groups of securities at once, on demand. Investors can diversify their exposure by buying entire baskets of securities without buying and selling the underlying individual securities. Because of these efficiencies and benefits, ETFs are being used by investors and traders around the globe.

The popularity of ETFs can be understood by the benefits provided across asset classes. ETFs provide transparency and efficiency as an exchange-traded product that is priced continuously intraday. This makes it easy for an investor to discover the value, gain diversification, and trade in a tactical way. The ETF structure also provides low transaction fees, leading to low management costs, and it can also present tax efficiencies. Recent volatile times have provided a test to ETFs not seen since the global financial crisis of 2008. Nevertheless, ETFs have held their own and have been observed to be an efficient price indicator in challenging markets.

Despite the current economic challenges related to COVID-19, opportunities exist for investment in Africa. Over the past five years, Africa has gone from being a challenge in terms of its financial potential to an enticing prospect for emerging market investors.

A World Economic Forum study mentioned that by 2030, African household consumption is expected to reach USD 2.5 trillion. The study goes on to state: “Nearly half of that $2.5 trillion will be spent in three countries: Nigeria (20%), Egypt (17%), and South Africa (11%). But there will also be lucrative opportunities in Algeria, Angola, Ethiopia, Ghana, Kenya, Morocco, Sudan, and Tunisia. Any one of these countries would be a good bet for companies seeking to enter new markets.”

The African market continues to strengthen its position in the world by developing its economy, manufacturing capabilities, infrastructure, and technology. Additional investments will be required to keep African countries continually growing and achieving future expectations, but the efficiencies of an ETF can assist in making such an investment possible.

The posts on this blog are opinions, not advice. Please read our Disclaimers.