


Have the new beta-like ESG indices delivered on their objectives, notwithstanding the market turmoil? The answer is yes, and then some. The S&P 500® ESG Index has provided low tracking error relative to the S&P 500 and similar risk, but also a better return.
For decades, growth in ESG investing was unremarkable, held back by investors’ fears that they were inviting underperformance relative to the market by integrating their values into their investments. However, in 2019, assets in ESG funds suddenly spiked. In ETFs alone, assets increased from USD 22.1 to USD 56.8 billion.[1] What brought this about? The launch of popular new indices, like the S&P 500 ESG Index, which were built to maintain overall industry group weights characteristics similar to those of their underlying benchmarks.
These beta-like indices gave investors’ comfort that they could integrate ESG into the core of their portfolios. Was this warm feeling deserved? As Exhibit 1 shows, the ESG versions of the S&P 500, S&P Europe 350®, S&P Global LargeMidCap, and S&P Developed LargeMidCap indices all performed better than their beta counterparts. The only major category in which the ESG version underperformed was emerging markets.

Because these indices are new, however, it is important to acknowledge that three- and five-year return figures include history that was built before these indices launched in early 2019, as noted in the methodology. For this reason, investors should pay special attention to the past year or so, when the indices were live. As Exhibit 2 highlights, the ESG indices have posted low returns, in line with the market, but the ESG versions have mostly outperformed beta, with the S&P 500 ESG Index beating the S&P 500 by 100 bps YTD. Again, only the S&P Emerging Market LargeMidCap ESG Index underperformed its beta peer.

What produced these results? Simply put, it was how the index methodology sorted the largest companies that drove performance.
To recap our standard ESG index methodology, it was designed to retain most companies in the benchmark index, weighting those that remain by market capitalization. Companies are excluded only if they: (a) have a low ESG score relative to their industry peers; (b) are involved in controversial weapons or tobacco production or sales; (c) are not closely adhering to the UN Global Compact; or (d) are involved in severe controversies.
Because the index is market capitalization weighted, the ESG index methodology has to properly sift the largest companies for the ESG benchmark to perform in line with its objective. In this respect, the 2019 rebalance seems to have largely been on the mark. Some companies that were significant drivers of the S&P 500’s performance in the past 12 months, such as Apple and Microsoft, passed through the screens and remained in the S&P 500 ESG Index. Other major companies with less-than-stellar performance, such as Boeing, were excluded.[2]
Will the S&P 500 ESG Index continue to track and even improve on the performance of the S&P 500 in the future? Common sense and our lawyers prevent us from speculating, but it appears that the ESG indices are passing major tests—their first year live, their first rebalance, and their first bout with market volatility—even better than expected.
[1] Source: S&P Dow Jones Indices.
[2] Boeing was excluded from the S&P 500 ESG Index because of its involvement in controversial weapons.
The posts on this blog are opinions, not advice. Please read our Disclaimers.
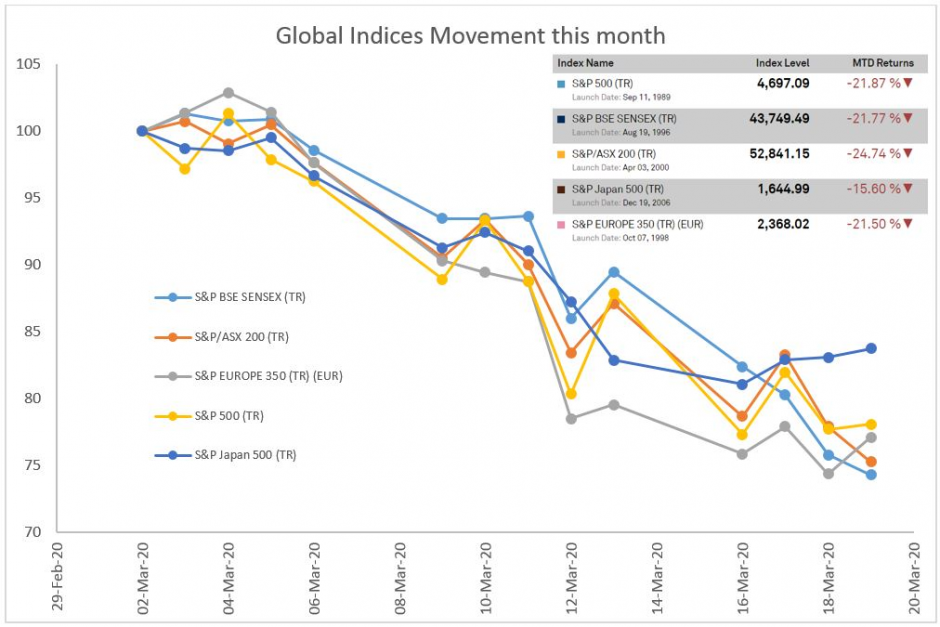 Source: S&P Dow Jones Indices LLC. Data from February 29, 2020, to March 20, 2020. Past performance is no guarantee of future results. Chart and table are provided for illustrative purposes.
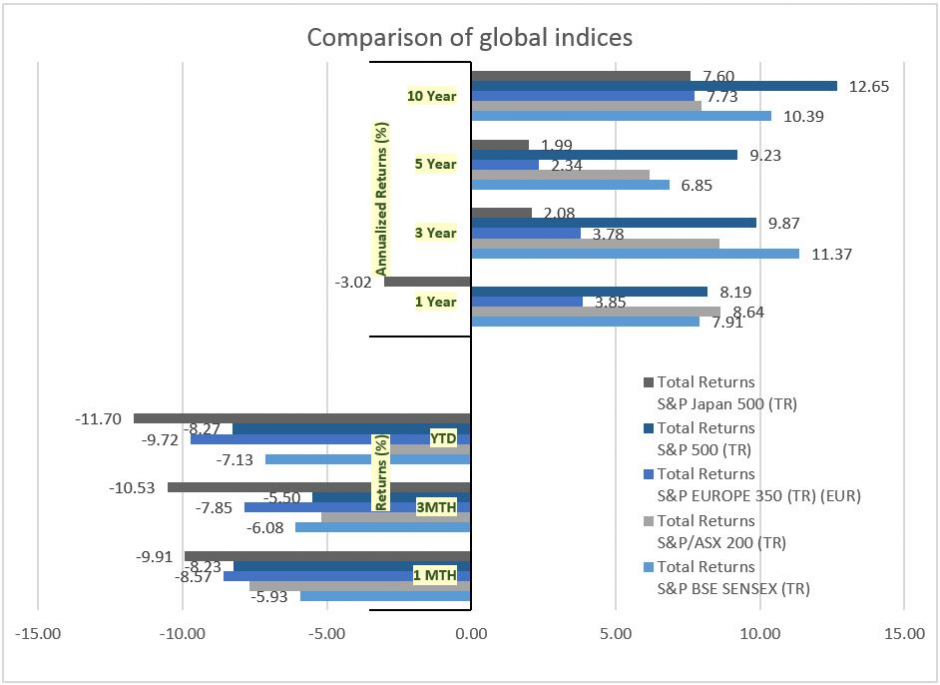 Source: S&P Dow Jones Indices LLC. Past performance is no guarantee of future results. Chart and table are provided for illustrative purposes.
 Source: S&P Dow Jones Indices LLC. Past performance is no guarantee of future results. Chart and table are provided for illustrative purposes.
 Source: S&P Dow Jones Indices LLC. Past performance is no guarantee of future results. Chart and table are provided for illustrative purposes.


