Get Indexology® Blog updates via email.

In This List

The Case for Information Technology Dividend Growers

Commodities Prices Slump in January

Divergence in Sector Returns

S&P Composite 1500®: Providing Efficient, Non-Overlapping Coverage of the U.S. Equity Market

Fixed Income Indices Take the Stage as Appetite for Credit-Focused Passive Strategies Grows

The Case for Information Technology Dividend Growers

Contributor Image
Karina Tjin

Former Analyst, Strategy Indices

S&P Dow Jones Indices

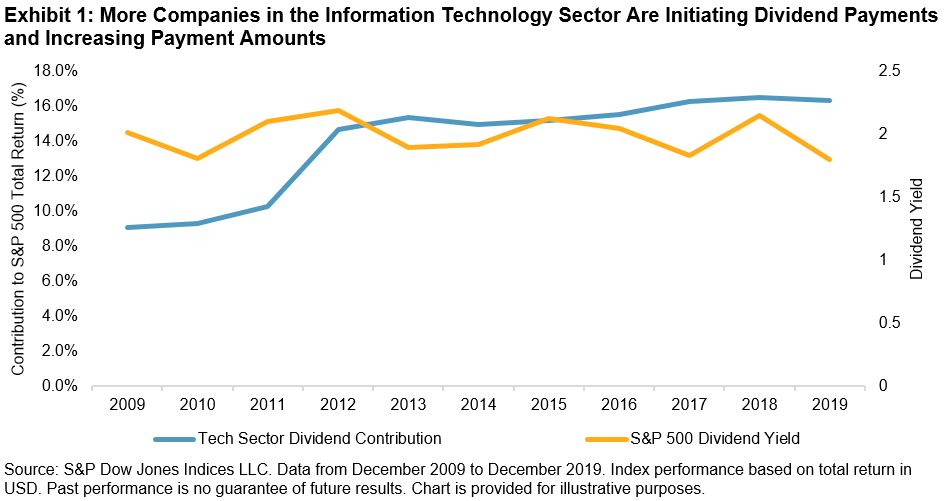
One of the common misconceptions in finance is that companies from the Information Technology (Tech) sector do not pay dividends. While this may have been the trend a long time ago, this has certainly not been the trend over the past 10 years. Over the past 10 years, within the Tech sector of the S&P 500®, 26 companies initiated dividend payments and 59 companies increased their dividends at various points throughout those years, for a total of 376 dividend increases in the sector.

During the same period, with an increasing number of Tech companies paying dividends, the contribution to S&P 500 total return by these companies rose from 9.07% in 2009 to 16.33% in 2019 (see Exhibit 1).

With the changing characteristics of the Tech sector, there is a need to measure the performance of dividend growers in this sector. Responding to market needs, S&P Dow Jones Indices recently launched the S&P Technology Dividend Aristocrats® Index, which seeks to track the performance of Tech companies that have a history of consistently increasing dividends.

Exhibit 2 shows the potential benefit of focusing on these companies: the S&P Technology Dividend Aristocrats Index provided similar risk-adjusted returns to the companies from the S&P TMI that are classified in the Tech sector over three- and five-year horizons, with lower volatility and higher dividend yield. The risk/return profile also compared favorably to the widely followed S&P 500 Dividend Aristocrats Index.

Given the results in Exhibit 2, it is perhaps unsurprising that the S&P Technology Dividend Aristocrats Index experienced lower volatility and lower drawdowns during a recent period of market turbulence. For example, the maximum drawdown for the S&P Technology Dividend Aristocrats Index (-19.5%) during Q4 2018 was less than that for the S&P TMI Information Technology (-23.6%). Exhibit 3 provides us with a more detailed view of the daily drawdown for this period.

The S&P Technology Dividend Aristocrats Index can be complementary to the S&P 500 Dividend Aristocrats, as the latter tends to be underweight in the Tech sector relative to the S&P 500—as of Dec. 31, 2019, the S&P 500 Dividend Aristocrats was 20% underweight in Tech. Given the growing importance of Tech companies in driving S&P 500 returns, the S&P Technology Dividend Aristocrats Index ensures relevant allocation to the sector.

Incorporating the S&P Technology Dividend Aristocrats Index in a portfolio with an existing allocation to the S&P 500 Dividend Aristocrats could provide greater diversification benefits. Exhibit 3 shows the back-tested returns of a hypothetical portfolio that allocates 80% to the S&P 500 Dividend Aristocrats and 20% to the S&P Technology Dividend Aristocrats Index. These weights were chosen to ensure a 20% weight in the Tech sector for the portfolio. We can see that combining the two Dividend Aristocrats indices in a single index resulted in a better risk/return profile than either individual index in the long-term.

The S&P Technology Dividend Aristocrats Index is designed to measure the performance of Tech companies with a history of raising dividends. The performance of the index has shown that it has a similar risk/return profile to the broader sector, with lower volatility and higher dividend yield. Ultimately, the index enables dividend-focused market participants to gain exposure to the Tech sector while maintaining growth and value characteristics.

The posts on this blog are opinions, not advice. Please read our Disclaimers.

Commodities Prices Slump in January

Contributor Image
Jim Wiederhold

Former Director, Commodities and Real Assets

S&P Dow Jones Indices

It was a tough start to the year for commodities. The S&P GSCI ended the first month of 2020 down 10.8%, the largest month-over-month decline since November 2018. The outbreak of the coronavirus in China’s Hubei Province flustered most financial markets, and the commodities markets were hit particularly hard given the potential impact on global supply chains and on the physical demand for commodities such as transportation fuel. There is also growing concern among market participants that, should the virus spread widely, it would weigh on global economic growth. Across the commodities markets, losses were driven by the petroleum complex and industrial metals, while only precious metals was accretive to headline performance.

China’s coronavirus outbreak rattled oil markets in January, sending prices sharply lower, as investors worried that efforts to prevent it spreading could harm the country’s economy and reduce demand for petroleum products. The S&P GSCI Petroleum was down 15.0% over the month. OPEC was reported to be mulling a cut in production to counter the decline in demand, but this news was not sufficient to allay price falls.

With approximately half of the base metals’ global demand coming from China, the S&P GSCI Industrial Metals dropped 7.09% in January. The S&P GSCI Copper and S&P GSCI Nickel contributed the most to the downside, falling 9.86% and 8.53%, respectively. Chinese businesses were allowed to request force majeure certificates, which excuse parties from not performing their contractual obligations due to the current conditions in which business with overseas partners is affected.

Gold broke to a new five-year high and was one of the only bright spots in the commodities space. The S&P GSCI Gold climbed 3.97% due to a safe haven bid on the back of heightened geopolitical tensions between the U.S. and Iran, along with the coronavirus contagion. The favorable environment for the S&P GSCI Palladium continued into 2020 and led to a positive outperformance of 16.67% for January.

The signing of the Phase One U.S.-China trade deal, which included a pledge by China to buy billions of dollars in additional agricultural goods from the U.S., had little immediate impact on the agricultural markets in January, with the focus shifting almost entirely to the ongoing health crisis gripping the world’s second-largest economy. The S&P GSCI Agriculture fell 2.65% in January. Even though China has recommenced purchasing U.S. soybeans, the S&P GSCI Soybeans was down 8.57% over the month, weighted down by plentiful supplies in North and South America. Sugar was the one sweet spot in the agricultural complex in January, with the S&P GSCI Sugar up an impressive 9.01% over the month. The International Sugar Organization has forecasted a global sugar deficit of 6.12 million metric tons in 2019-2020, and the slow pace of Indian exports has started to affect the market.

Lean hog prices nosedived in January, leaving the S&P GSCI Livestock down 10.23% over the month. Combined with concern regarding the persistence of demand in the largest market in the world for pork, China, was the fact that U.S. hog supplies continue to surprise to the upside, putting pressure on the U.S. slaughter capacity.

The posts on this blog are opinions, not advice. Please read our Disclaimers.

Divergence in Sector Returns

Contributor Image
Hamish Preston

Head of U.S. Equities

S&P Dow Jones Indices

After a pullback in the market over the last week, it remains to be seen if U.S. equities will finish the month in the black.  However, as of yesterday’s close, the S&P Composite 1500, which represents over 90% of U.S. equity capitalization, was up 1.21% since the turn of the year as large cap gains offset declines in mid and small caps.  Indeed, the S&P 500 stood 1.42% higher than at the end of 2019, while the S&P MidCap 400 (-0.73%) and the S&P SmallCap 600 (-1.58%) fell.

While the market has had its fair share of news to digest this month – including U.S.-Iran relations, corporate earnings, and the signing of a so-called “Phase One” trade agreement between the U.S. and China – news of a virus spreading in China has taken a lot of the headlines.  Indeed, fears of contagion weighed on global equity markets this week, and the S&P 500 recorded a daily price decline of 1.57% on January 27th – its first daily price decline of more than 1% since October 2019 and ending its 10th longest streak (74 trading days) in the last 50 years without such a decline.

At a sector level, Utilities has been the best-performing large and mid cap sector, perhaps reflecting the bouts of unease observed at various points this month.  And in signs of some good news impacting the market, the Information Technology and Communication Services sectors benefited from several strong earnings reports.  At the other end of the spectrum, Energy was by far the worst performing sector this month as a decline in oil prices provided headwinds: the S&P GSCI Crude Oil Index is set for its worst monthly total return since May 2019, down 12.47% as of yesterday’s close.

More broadly, and in large part because of Energy’s woes, there was a sizeable difference between the best- and worst-performing U.S. equity sectors this month.  For example, the 15.14% separating the best-performing S&P 500 sector (Utilities) and the worst-performing (Energy) is the largest monthly difference in large cap sectoral performance since October 2017. Similarly, the performance spread in S&P 400 sectors (22.84%) and S&P 600 sectors (24.88%) are the highest readings since September 2017 and September 2015, respectively.

As a result, although it remains to be seen which trends will continue to dominate headlines and shape sentiment – and caution should be taken when using January’s performance to try and predict subsequent returns – the performance of U.S. equities in January highlights the potential for sizeable divergence in returns based on idiosyncratic reactions to news.  Incorporating sectoral views may therefore be useful when navigating market movements.

For monthly updates on our indices, sign-up for our monthly dashboards here.


The posts on this blog are opinions, not advice. Please read our Disclaimers.

S&P Composite 1500®: Providing Efficient, Non-Overlapping Coverage of the U.S. Equity Market

Contributor Image
Aye Soe

Former Managing Director, Global Head of Core and Multi-Asset Product Management

S&P Dow Jones Indices

When it comes to measuring the performance of U.S. equity market, some broad market indices have more constituents than others. But having a larger number of constituents does not necessarily lead to significantly wider market capitalization coverage. That’s because broad equity benchmarks are usually market-capitalization weighted, with the majority of the index weight concentrated in the top 100 securities. Therefore, as one goes down the market cap spectrum, smaller companies understandably command less weight in the index.

For example, the S&P Composite 1500 and the Russell 3000 both seek to measure the performance of the U.S. equity market, with the latter including twice the number of companies. However, the S&P Composite 1500 covered 90% of the U.S. market cap at the end of 2019 (see Exhibit 1). That means the largest 1,500 stocks not included in the index, many of them members of the Russell 3000, only represented around 10% of the U.S. equity market capitalization.

Over the long-term investment horizon, the two indices had returns correlation of 99.8% and roughly identical risk/return profiles.[1] Therefore, there is no noticeable return premium for having a greater or lower number of securities in the universe. Nevertheless, market participants looking to passively replicate the returns of the U.S. equity market may wish to consider additional factors such as trading costs, liquidity, and turnover. Data show that, on average, the S&P Composite 1500 had lower annual turnover (4%) than the Russell 3000 (9.31%).[2] With half the names to trade, the S&P Composite 1500 appears to be more capital efficient and cost effective.

From a total portfolio perspective, another important consideration for market participants is ensuring non-overlapping market capitalization exposure. The S&P Composite 1500 is made up of distinct market cap ranges—the S&P 500®, the S&P MidCap 400®, and the S&P SmallCap 600®. In other words, there are clearly defined market capitalization cut-offs between each market cap segment with no overlapping securities.

Non-overlapping size segmentation means market participants can avoid taking on unintended exposure to size, style, or risk factors that they do not get compensated for. For example, consider an investor that is passively replicating a large-cap and a mid-cap index. If there is any overlap between the indices, the investor would be doubling down on their size exposures. Given the historical differences in risk/return characteristics between large- and mid-cap stocks, such exposure may have a sizeable impact on a portfolio’s characteristics

In sum, the S&P Composite 1500 represents an efficient, cost-effective way to measure the performance of 90% of the domestic equity market. And because of distinct market cap segmentation, the index avoids exposing market participants to unintended risk exposures that they do not wish to take.

[1] Based on monthly data from Dec. 30, 1994, through Dec. 31, 2019. The S&P Composite 1500 has annualized return and volatility of 10.36% and 14.65%. Russell 3000 has annualized return and volatility of 10.21% and 14.84%. Total returns in USD.

[2] Source: Factset. Turnover figures based on annual averages between 2006 and 2019. iShares Russell 3000 ETF used as a proxy for the Russell 3000 index.

The posts on this blog are opinions, not advice. Please read our Disclaimers.

Fixed Income Indices Take the Stage as Appetite for Credit-Focused Passive Strategies Grows

Contributor Image
Koel Ghosh

Former Head of South Asia

S&P Dow Jones Indices

There is healthy demand among global investors for reliable and transparent indices and benchmarks to gauge sector-level and overall market performance. This demand coincides with investors seeking out cost-efficient investment strategies and shifting their asset allocations to lower-cost passive or index-based products, such as exchange-traded funds (ETFs), from actively managed funds.

In India alone, passive investment strategies have been steadily increasing, with ETF assets crossing the USD 20 billion mark as of September 2019.[1] The Indian government has played a critical role in the growth of these passive strategies. For example, the Employee’s Provident Fund Organization’s (EPFO) equity ETF allocations and the Department of Investment and Public Asset Management’s (DIPAM) ETF usage in their disinvestment program have helped lead the way for growth in the Indian market.

Globally, the growing interest in passive strategies spans different asset classes, including equities, fixed income, and commodities. In addition to the cost effectiveness, investors tend to be attracted to passive strategies because of the performance records of vehicles such as ETFs, which by design closely mirror the risk/return profiles of their respective indices and benchmarks.

For nearly two decades, S&P Dow Jones Indices has been tracking the performance of actively managed funds against their benchmarks in key markets such as India. Although the results vary, certain trends emerge over time, such as actively managed funds underperforming their benchmarks over short-and long-term periods.

In India and globally, equity-focused strategies have historically been more popular among investors. In fact, global assets in equity ETFs account for USD 4 trillion of the total passive market segment, which was just above USD 5 trillion as of September 2019.[2]

Today, we are seeing passive strategies extend beyond equities to offer investors the tools to measure different segments of the global fixed income market. The launch of India’s first bond ETF, for instance, reflects the demand for more diversified exposures to equity and fixed income markets.

Indeed, fixed income passive strategies were one of the high points of 2019, with roughly USD 1 trillion in assets invested in credit-focused passive vehicles,[3] and many asset owners expect this number to grow in the years to come. The underlying principle that anchors fixed income passive strategies is similar to that of the more established equity-focused offerings, although instead of a basket of stocks, investors buy into a basket of fixed income securities.

As the potential risks and opportunities of fixed income investing generate more attention, so does the need for independent and reliable global indices and benchmarks that enable investors to effectively monitor the performance of different segments of the debt market in order to make informed decisions. Each credit segment, whether it be investment grade, high yield, money market, or sovereign and public finance debt, has its own unique risk/return characteristics.

Lastly, independence, transparency, and liquidity are crucial factors for fixed income passive strategies to gain momentum and build an investor base in India and globally. While we make no predictions surrounding asset growth, we believe that an ongoing commitment to investor education and awareness will be key to the increased adoption of passive fixed income strategies.


[1]   Etfgi.com, September 2019.

[2]  Ibid.

[3]   Ibid.

The posts on this blog are opinions, not advice. Please read our Disclaimers.