Get Indexology® Blog updates via email.

In This List

S&P Composite 1500®: Providing Higher Quality U.S. Equity Exposure

The Case for Information Technology Dividend Growers

Commodities Prices Slump in January

Divergence in Sector Returns

S&P Composite 1500®: Providing Efficient, Non-Overlapping Coverage of the U.S. Equity Market

S&P Composite 1500®: Providing Higher Quality U.S. Equity Exposure

Contributor Image
Hamish Preston

Head of U.S. Equities

S&P Dow Jones Indices

Over the last few years, mega-cap companies have played an increasingly important role in driving U.S. equity market returns. Indeed, the five largest names in the S&P 500® accounted for 16.8% of the index at the end of last year, the highest year-end weight since 1982 and higher than the 16.6% reached at the end of 1999 during the Tech Bubble.

The sizeable representation of mega-cap companies in the U.S. equity market means that indices seeking to measure the performance of the market – such as the S&P Composite 1500 and the Russell 3000 – often have similar weights in these companies.  Perhaps unsurprisingly, the two indices exhibited similar risk/return characteristics, historically.

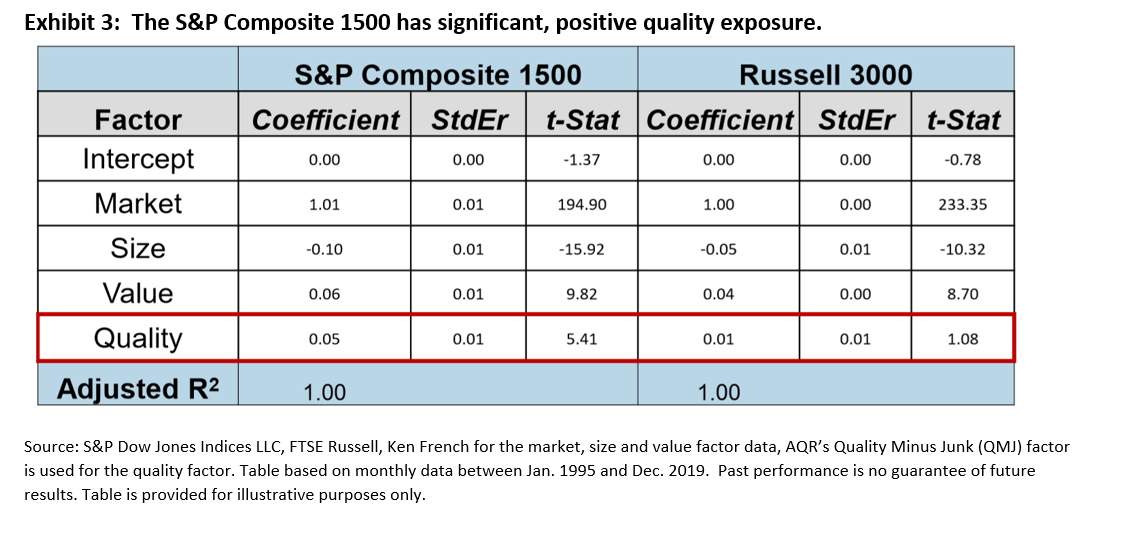
However, it is important to remember that not all indices are created in the same way.  For example, unlike the Russell 3000, the S&P Composite 1500 focuses on profitable U.S. companies by incorporating earnings criteria.  Exhibit 3 shows that this focus meant the S&P 1500 has significant, positive quality exposure, which was also observed for each of the S&P 500, S&P MidCap 400® and the S&P SmallCap 600®.

Differences in index construction, especially the S&P 1500’s earnings screen, may also be relevant given the proportion of IPOs with negative earnings:  2019 saw 74% of IPOs with negative 12-month trailing earnings per share, following 2018’s record-equaling figure (81%).  To the extent that these companies are expected to out- or underperform, differences in index methodologies may help to explain any divergence in index performance.

As a result, the sizeable representation of large-cap stocks means indices designed to track the U.S. equity market often have similar weights in these companies, resulting in similar risk/return profiles.  However, understanding the different factor exposures of the S&P Composite 1500 and its competitors may be useful for assessing the impact of various market drivers on index returns.


The posts on this blog are opinions, not advice. Please read our Disclaimers.

The Case for Information Technology Dividend Growers

Contributor Image
Karina Tjin

Former Analyst, Strategy Indices

S&P Dow Jones Indices

One of the common misconceptions in finance is that companies from the Information Technology (Tech) sector do not pay dividends. While this may have been the trend a long time ago, this has certainly not been the trend over the past 10 years. Over the past 10 years, within the Tech sector of the S&P 500®, 26 companies initiated dividend payments and 59 companies increased their dividends at various points throughout those years, for a total of 376 dividend increases in the sector.

During the same period, with an increasing number of Tech companies paying dividends, the contribution to S&P 500 total return by these companies rose from 9.07% in 2009 to 16.33% in 2019 (see Exhibit 1).

With the changing characteristics of the Tech sector, there is a need to measure the performance of dividend growers in this sector. Responding to market needs, S&P Dow Jones Indices recently launched the S&P Technology Dividend Aristocrats® Index, which seeks to track the performance of Tech companies that have a history of consistently increasing dividends.

Exhibit 2 shows the potential benefit of focusing on these companies: the S&P Technology Dividend Aristocrats Index provided similar risk-adjusted returns to the companies from the S&P TMI that are classified in the Tech sector over three- and five-year horizons, with lower volatility and higher dividend yield. The risk/return profile also compared favorably to the widely followed S&P 500 Dividend Aristocrats Index.

Given the results in Exhibit 2, it is perhaps unsurprising that the S&P Technology Dividend Aristocrats Index experienced lower volatility and lower drawdowns during a recent period of market turbulence. For example, the maximum drawdown for the S&P Technology Dividend Aristocrats Index (-19.5%) during Q4 2018 was less than that for the S&P TMI Information Technology (-23.6%). Exhibit 3 provides us with a more detailed view of the daily drawdown for this period.

The S&P Technology Dividend Aristocrats Index can be complementary to the S&P 500 Dividend Aristocrats, as the latter tends to be underweight in the Tech sector relative to the S&P 500—as of Dec. 31, 2019, the S&P 500 Dividend Aristocrats was 20% underweight in Tech. Given the growing importance of Tech companies in driving S&P 500 returns, the S&P Technology Dividend Aristocrats Index ensures relevant allocation to the sector.

Incorporating the S&P Technology Dividend Aristocrats Index in a portfolio with an existing allocation to the S&P 500 Dividend Aristocrats could provide greater diversification benefits. Exhibit 3 shows the back-tested returns of a hypothetical portfolio that allocates 80% to the S&P 500 Dividend Aristocrats and 20% to the S&P Technology Dividend Aristocrats Index. These weights were chosen to ensure a 20% weight in the Tech sector for the portfolio. We can see that combining the two Dividend Aristocrats indices in a single index resulted in a better risk/return profile than either individual index in the long-term.

The S&P Technology Dividend Aristocrats Index is designed to measure the performance of Tech companies with a history of raising dividends. The performance of the index has shown that it has a similar risk/return profile to the broader sector, with lower volatility and higher dividend yield. Ultimately, the index enables dividend-focused market participants to gain exposure to the Tech sector while maintaining growth and value characteristics.

The posts on this blog are opinions, not advice. Please read our Disclaimers.

Commodities Prices Slump in January

Contributor Image
Jim Wiederhold

Former Director, Commodities and Real Assets

S&P Dow Jones Indices

It was a tough start to the year for commodities. The S&P GSCI ended the first month of 2020 down 10.8%, the largest month-over-month decline since November 2018. The outbreak of the coronavirus in China’s Hubei Province flustered most financial markets, and the commodities markets were hit particularly hard given the potential impact on global supply chains and on the physical demand for commodities such as transportation fuel. There is also growing concern among market participants that, should the virus spread widely, it would weigh on global economic growth. Across the commodities markets, losses were driven by the petroleum complex and industrial metals, while only precious metals was accretive to headline performance.

China’s coronavirus outbreak rattled oil markets in January, sending prices sharply lower, as investors worried that efforts to prevent it spreading could harm the country’s economy and reduce demand for petroleum products. The S&P GSCI Petroleum was down 15.0% over the month. OPEC was reported to be mulling a cut in production to counter the decline in demand, but this news was not sufficient to allay price falls.

With approximately half of the base metals’ global demand coming from China, the S&P GSCI Industrial Metals dropped 7.09% in January. The S&P GSCI Copper and S&P GSCI Nickel contributed the most to the downside, falling 9.86% and 8.53%, respectively. Chinese businesses were allowed to request force majeure certificates, which excuse parties from not performing their contractual obligations due to the current conditions in which business with overseas partners is affected.

Gold broke to a new five-year high and was one of the only bright spots in the commodities space. The S&P GSCI Gold climbed 3.97% due to a safe haven bid on the back of heightened geopolitical tensions between the U.S. and Iran, along with the coronavirus contagion. The favorable environment for the S&P GSCI Palladium continued into 2020 and led to a positive outperformance of 16.67% for January.

The signing of the Phase One U.S.-China trade deal, which included a pledge by China to buy billions of dollars in additional agricultural goods from the U.S., had little immediate impact on the agricultural markets in January, with the focus shifting almost entirely to the ongoing health crisis gripping the world’s second-largest economy. The S&P GSCI Agriculture fell 2.65% in January. Even though China has recommenced purchasing U.S. soybeans, the S&P GSCI Soybeans was down 8.57% over the month, weighted down by plentiful supplies in North and South America. Sugar was the one sweet spot in the agricultural complex in January, with the S&P GSCI Sugar up an impressive 9.01% over the month. The International Sugar Organization has forecasted a global sugar deficit of 6.12 million metric tons in 2019-2020, and the slow pace of Indian exports has started to affect the market.

Lean hog prices nosedived in January, leaving the S&P GSCI Livestock down 10.23% over the month. Combined with concern regarding the persistence of demand in the largest market in the world for pork, China, was the fact that U.S. hog supplies continue to surprise to the upside, putting pressure on the U.S. slaughter capacity.

The posts on this blog are opinions, not advice. Please read our Disclaimers.

Divergence in Sector Returns

Contributor Image
Hamish Preston

Head of U.S. Equities

S&P Dow Jones Indices

After a pullback in the market over the last week, it remains to be seen if U.S. equities will finish the month in the black.  However, as of yesterday’s close, the S&P Composite 1500, which represents over 90% of U.S. equity capitalization, was up 1.21% since the turn of the year as large cap gains offset declines in mid and small caps.  Indeed, the S&P 500 stood 1.42% higher than at the end of 2019, while the S&P MidCap 400 (-0.73%) and the S&P SmallCap 600 (-1.58%) fell.

While the market has had its fair share of news to digest this month – including U.S.-Iran relations, corporate earnings, and the signing of a so-called “Phase One” trade agreement between the U.S. and China – news of a virus spreading in China has taken a lot of the headlines.  Indeed, fears of contagion weighed on global equity markets this week, and the S&P 500 recorded a daily price decline of 1.57% on January 27th – its first daily price decline of more than 1% since October 2019 and ending its 10th longest streak (74 trading days) in the last 50 years without such a decline.

At a sector level, Utilities has been the best-performing large and mid cap sector, perhaps reflecting the bouts of unease observed at various points this month.  And in signs of some good news impacting the market, the Information Technology and Communication Services sectors benefited from several strong earnings reports.  At the other end of the spectrum, Energy was by far the worst performing sector this month as a decline in oil prices provided headwinds: the S&P GSCI Crude Oil Index is set for its worst monthly total return since May 2019, down 12.47% as of yesterday’s close.

More broadly, and in large part because of Energy’s woes, there was a sizeable difference between the best- and worst-performing U.S. equity sectors this month.  For example, the 15.14% separating the best-performing S&P 500 sector (Utilities) and the worst-performing (Energy) is the largest monthly difference in large cap sectoral performance since October 2017. Similarly, the performance spread in S&P 400 sectors (22.84%) and S&P 600 sectors (24.88%) are the highest readings since September 2017 and September 2015, respectively.

As a result, although it remains to be seen which trends will continue to dominate headlines and shape sentiment – and caution should be taken when using January’s performance to try and predict subsequent returns – the performance of U.S. equities in January highlights the potential for sizeable divergence in returns based on idiosyncratic reactions to news.  Incorporating sectoral views may therefore be useful when navigating market movements.

For monthly updates on our indices, sign-up for our monthly dashboards here.


The posts on this blog are opinions, not advice. Please read our Disclaimers.

S&P Composite 1500®: Providing Efficient, Non-Overlapping Coverage of the U.S. Equity Market

Contributor Image
Aye Soe

Former Managing Director, Global Head of Core and Multi-Asset Product Management

S&P Dow Jones Indices

When it comes to measuring the performance of U.S. equity market, some broad market indices have more constituents than others. But having a larger number of constituents does not necessarily lead to significantly wider market capitalization coverage. That’s because broad equity benchmarks are usually market-capitalization weighted, with the majority of the index weight concentrated in the top 100 securities. Therefore, as one goes down the market cap spectrum, smaller companies understandably command less weight in the index.

For example, the S&P Composite 1500 and the Russell 3000 both seek to measure the performance of the U.S. equity market, with the latter including twice the number of companies. However, the S&P Composite 1500 covered 90% of the U.S. market cap at the end of 2019 (see Exhibit 1). That means the largest 1,500 stocks not included in the index, many of them members of the Russell 3000, only represented around 10% of the U.S. equity market capitalization.

Over the long-term investment horizon, the two indices had returns correlation of 99.8% and roughly identical risk/return profiles.[1] Therefore, there is no noticeable return premium for having a greater or lower number of securities in the universe. Nevertheless, market participants looking to passively replicate the returns of the U.S. equity market may wish to consider additional factors such as trading costs, liquidity, and turnover. Data show that, on average, the S&P Composite 1500 had lower annual turnover (4%) than the Russell 3000 (9.31%).[2] With half the names to trade, the S&P Composite 1500 appears to be more capital efficient and cost effective.

From a total portfolio perspective, another important consideration for market participants is ensuring non-overlapping market capitalization exposure. The S&P Composite 1500 is made up of distinct market cap ranges—the S&P 500®, the S&P MidCap 400®, and the S&P SmallCap 600®. In other words, there are clearly defined market capitalization cut-offs between each market cap segment with no overlapping securities.

Non-overlapping size segmentation means market participants can avoid taking on unintended exposure to size, style, or risk factors that they do not get compensated for. For example, consider an investor that is passively replicating a large-cap and a mid-cap index. If there is any overlap between the indices, the investor would be doubling down on their size exposures. Given the historical differences in risk/return characteristics between large- and mid-cap stocks, such exposure may have a sizeable impact on a portfolio’s characteristics

In sum, the S&P Composite 1500 represents an efficient, cost-effective way to measure the performance of 90% of the domestic equity market. And because of distinct market cap segmentation, the index avoids exposing market participants to unintended risk exposures that they do not wish to take.

[1] Based on monthly data from Dec. 30, 1994, through Dec. 31, 2019. The S&P Composite 1500 has annualized return and volatility of 10.36% and 14.65%. Russell 3000 has annualized return and volatility of 10.21% and 14.84%. Total returns in USD.

[2] Source: Factset. Turnover figures based on annual averages between 2006 and 2019. iShares Russell 3000 ETF used as a proxy for the Russell 3000 index.

The posts on this blog are opinions, not advice. Please read our Disclaimers.