Get Indexology® Blog updates via email.

In This List

Diwali, the Festival of Lights, Illuminates the Glistening Qualities of Gold

The Gift of a Benevolent Providence

The Outperformance of S&P and Dow Jones Islamic Market Indices versus Conventional Indices through Q3 2019

Unicorns: Only in Fairy Tales

S&P Risk Parity Indices: Positioning for Uncertainty

Diwali, the Festival of Lights, Illuminates the Glistening Qualities of Gold

Contributor Image
Jim Wiederhold

Former Director, Commodities and Real Assets

S&P Dow Jones Indices

In India, the festival of lights known as Diwali brings with it a seasonal uptick in gold imports. A feature of this renowned festival involves the exchange of gifts among friends, families, and colleagues. The most popular gift to give during the festival is gold. The propitious sentiment toward the precious metal makes it a perfect gift during this time. Jewelry is also prominently worn by families throughout the five-day festival, making gold an integral piece of this ancient tradition.

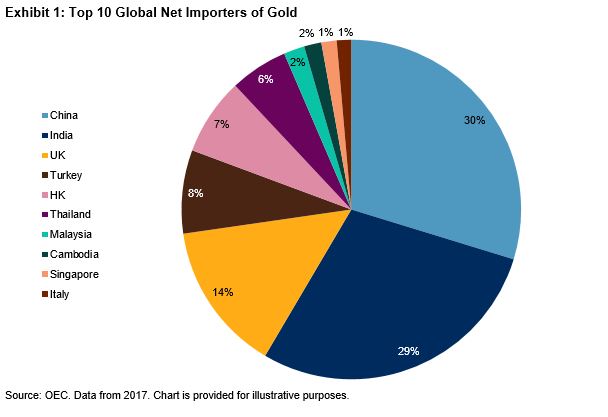
Gold tends to shine bright during the second half of the year as demand picks up. It is estimated that Diwali accounts for approximately one-fifth of annual gold purchases in India—more than any other time of the year. Jewelers and gold coin dealers in India frequently see a spike of 20%-30% in sales leading up to the festival. India is the second-largest consumer of gold after China, although they are close in size, with each accounting for approximately 30% of net global imports of the yellow metal in 2017. Gold is the second-largest import in India after crude oil, illustrating how important the country is to the global gold market and likewise how important it is for Indian consumers to appreciate the global supply/demand dynamics of gold.

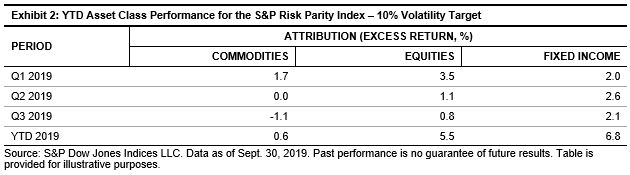
 The consumption of gold during the Diwali festival and peak wedding season running from August to December is unlike anywhere else in the world. This year, Diwali demand will compete directly with a favorable cyclical environment for gold investment. Gold has been one of the best-performing commodities this year. As of Sept. 30, 2019, the S&P GSCI Gold was up 14.21% YTD and on par with the S&P 500®, which was up 18.74% YTD. Historically, the metal tends to perform well in times of global economic uncertainty, low interest rate regimes, and periods of U.S. dollar weakness. In an environment in which negative-yielding government debt is only increasing, investors have shown their willingness to allocate a larger portion of their portfolio to gold, for which there is no yield that could turn negative. Data from the World Gold Council suggests that investor and central government demand for gold has grown at a faster pace than jewelry demand through the first six months of this year.

The Indian gold market has shown its resilience even when import taxes are raised, as they were in July of this year, from 10% to 12%. Gold prices simply marched higher, as can be seen by Exhibit 4. There was a similar outperformance in 2013, the last time India raised import tax duties. What is interesting about 2013 is the S&P GSCI Gold saw a drastic move lower on the year, down almost 30%, while local gold prices in India moved less than half that amount. A tax increase can usually be seen as a headwind for demand, but it was overcome by the sheer force of gold buying in India. This year, local gold prices in India have outperformed the S&P GSCI Gold, albeit not as pronounced as in 2013. Regardless, the cultural significance of gold in India provides a firm base for demand and prices.

The posts on this blog are opinions, not advice. Please read our Disclaimers.

The Gift of a Benevolent Providence

Contributor Image
Craig Lazzara

Former Managing Director, Index Investment Strategy

S&P Dow Jones Indices

Suppose that I buy a popular exchange traded fund (ETF) tracking the S&P 500® today, leave it in my brokerage account for 20 years, and then sell it.  What return should I expect?  The answer, obviously, is that my return should reflect the movements in the S&P 500 (net of fees) over my 20-year holding period.  That this actually happens is a remarkable thing, and no less remarkable for being unappreciated.

The S&P 500, after all, is just a list of stocks, and its path depends upon the weighted average fluctuation in their prices.  The return of my ETF depends upon what someone is willing to pay me at whatever time I decide to sell.  That these two returns are the same is not the gift of a benevolent Providence.  It happens for two distinct reasons.

First, there is an active arbitrage community that continually monitors the relationship between the value of my ETF and the value of the underlying members of the S&P 500.  If the ETF is too cheap relative to the value of the index’s constituents, arbitrageurs will buy the ETF and short the constituents; if the ETF is too expensive, the arbitrage goes in the opposite direction.  In either case, arbitrage pushes the ETF toward its fair value.

Second, popular ETFs and indices are widely scrutinized by the investment and journalistic communities.  If something looks “off,” a news story or a cacophony of investor queries may follow.  This scrutiny helps to ensure that both index and ETF deliver on their objectives (in the S&P 500’s case, to reflect the most important companies in the U.S. stock market and, in the ETF’s case, to hold a portfolio tracking them).  Problems in a less-scrutinized product will be noticed less quickly, if at all.

Index funds are sometimes criticized for failing to promote market efficiency since, at the stock level, efficient pricing depends on the ability of fundamental analysts to assess firm values accurately, and index funds don’t do fundamental analysis.  For the market as a whole, however, trading in index-linked instruments is orders of magnitude greater than trading in individual stocksOne investors opinion of the proper value of the market as a whole is, a priori, no less valuable than another investors opinion of the proper value of Microsoft or Amazon.

 “Markets work best,” writes The Wall Street Journal’s Jason Zweig, “when they are both deep and wide, integrating sharp differences of opinion from many people into a single price at which investments can trade.”  Arbitrage and scrutiny forge a connection between prices at the macro and micro levels, improving the efficiency of the whole.

The posts on this blog are opinions, not advice. Please read our Disclaimers.

The Outperformance of S&P and Dow Jones Islamic Market Indices versus Conventional Indices through Q3 2019

Contributor Image
John Welling

Director, Global Equity Indices

S&P Dow Jones Indices

Developed Market Indices Lead, Emerging Markets Lag the Broad Market

Global S&P and Dow Jones Shariah-compliant benchmarks outperformed their conventional counterparts YTD in 2019, as Information Technology—which tends to be overweight in Islamic indices—continued to lead the sectors, while Financials—which is underrepresented in Islamic indices—continued to underperform the broader market. The S&P Global BMI Shariah and Dow Jones Islamic Market (DJIM) World gained 19.1% and 18.7%, respectively, outperforming the conventional S&P Global BMI by approximately 300 basis points.

The outperformance trend played out across major regions, as Shariah-compliant benchmarks for U.S., Europe, Asia-Pacific, developed, and emerging markets each outperformed conventional equity benchmarks by meaningful margins. The Pan Arab region was the lone exception, with the S&P Pan Arab Composite Shariah underperforming the conventional regional index.

U.S. Equities Continued to Lead the Rest of World through Q3 2019

Despite ongoing U.S.-China trade policy concerns, positive U.S. equity performance continued throughout Q3 2019, leading conventional global equities YTD. Strong earnings early in the quarter combined with a rate cut by the Federal Reserve contributed to gains. Regionally, European equities followed in performance, with double-digit gains over the period.

MENA Country Results Varied

MENA equity returns (in USD) suffered losses in Q3 2019 (-4.3%), as measured by the S&P Pan Arab Composite. However, its YTD return mimicked broad emerging market benchmarks, with a gain of 7.6%. The S&P Bahrain BMI continued to lead the region YTD, with a gain of 30.5%, followed by the S&P Egypt BMI, which added 26.5%. The S&P Kuwait BMI, which was promoted to emerging market status, gained 16.3% YTD, joining other emerging market countries such as Egypt, Qatar, Saudi Arabia (promoted in March), and the UAE. The S&P Qatar BMI lagged the most, falling 0.1% YTD.

Varied Returns of Shariah-Compliant Multi-Asset Indices

The DJIM Target Risk Indices—which combine Shariah-compliant global core equity, sukuk, and cash components—generally underperformed the S&P Global BMI Shariah and DJIM World YTD. Performance of the comparably more risk-averse DJIM Target Risk Conservative Index was constrained by its 20% allocation to global equities in the expanding market environment, ultimately gaining a favorable 11.0% YTD. Meanwhile, the performance of the DJIM Target Risk Aggressive Index was driven by its 100% allocation to a mix of Shariah-compliant global equities, returning 18.8%, in alignment with the broader S&P Global BMI Shariah and DJIM World.

For more information on how Shariah-compliant benchmarks performed in Q3 2019, read our latest Shariah Scorecard.

The posts on this blog are opinions, not advice. Please read our Disclaimers.

Unicorns: Only in Fairy Tales

Contributor Image
Chris Bennett

Former Director, Index Investment Strategy

S&P Dow Jones Indices

“A company for carrying on an undertaking of great advantage, but nobody to know what it is”

-Description of company marketed during the South Sea Bubble (1720)

Private companies, particularly those hailing from Silicon Valley and combining just the right mix of buzzwords, have captured both headlines and investor attention.  The media report breathlessly on the increasing herd of “unicorns” – private companies that have managed to achieve valuations of over a billion dollars – while a pursuing pack of venture capital and private equity funds competes to place ever higher valuations on their portfolio companies in advance of their initial public offering (IPO).

However, a post-IPO pop up in pricing is not guaranteed.  The additional price transparency that comes from a public listing can be challenging: earnings must be reported, sceptical market participants can short stocks and thereby act to deflate bubbles, and (perhaps most importantly) the existence of an actual stock price eliminates the ability of venture capital and private equity funds to assign arbitrary valuations to their holdings, at a time of their convenience.

Recently, there have been signs of trouble in tech paradise, with Uber and Lyft’s post-IPO struggles and WeWork’s “failure to launch” highlighting the potential challenge of transferring private valuations onto the public stage.  The S&P U.S. IPO and Spin-Off Index, which measures the performance of U.S. companies worth over $1 billion that have IPO’d or spun-off within the last five years, has underperformed the S&P 500® by 11% over the last 6 months.

There could be more hard times ahead.  According to Professor Jay Ritter at the University of Florida, last year, 81% of companies to IPO in the U.S. did so with negative 12-month trailing earnings on the day they went public. This was the highest such proportion since the tech bubble days of 2000, up from 76% in 2017 and 67% in 2016.

According to our analysis, this trend has continued in 2019.  80 percent of this year’s IPOs with data available reported negative earnings over the 12 months preceding their launch.  Had not WeWork and Endeavor pulled their IPOs in recent weeks, the figure would have been on track for the highest reading ever.

These trends may give investors pause regarding the stellar valuations currently held by pre- IPO companies, particularly those without a clear path to profitability.  The current environment also emphasizes the importance of benchmark construction for ‘market’ indices, some of which place constraints on the additions of newly-listed, or unprofitable companies, and some of which don’t.  Investors tracking the S&P Composite 1500® family of indices, which includes the S&P 500, the S&P MidCap 400® and the S&P SmallCap 600®, may be less exposed: each of these indices requires both a history of positive earnings, and a one year seasoning period (for new listings), before companies become eligible for inclusion.

Sometimes, requiring a demonstrated profit before investing in a company means missing out on the next “big thing”.  However, the problem with unicorns is that they are most often found in fairy tales.

The posts on this blog are opinions, not advice. Please read our Disclaimers.

S&P Risk Parity Indices: Positioning for Uncertainty

Contributor Image
Rupert Watts

Head of Factors and Dividends

S&P Dow Jones Indices

Uncertainty has been a common theme throughout 2019, and the third quarter proved no different. The quarter was dominated by uncertainties surrounding the U.S.-China trade talks as well as falling global growth forecasts. Demand for high-quality fixed income assets increased, pushing the yield on the 10-Year U.S. Treasury Bond down 34 bps. In spite of the mixed economic data and trade tensions, equities finished the quarter in positive territory, with the S&P 500® returning 1.7%.

As Exhibit 1 shows, the S&P Risk Parity Indices built upon the new highs set in Q2 2019 to post modest gains in Q3 2019.

Exhibit 2 shows the performance attribution for the S&P Risk Parity Index – 10% Volatility Target, where we can observe that the majority of the YTD performance came from equities and fixed income in the midst of contrasting sentiments across these two core asset classes.

Looking to the future, with many unpredictable variables at play—such as interest rates, bond yields, equity volatility, inflation, and more—what does the S&P Risk Parity Index Series have to offer?

The short answer is: a lot. These indices aim to generate stable returns across a range of economic environments, specifically growth and inflation. By allocating across three core asset classes—equities, fixed income (nominal bonds), and commodities—the indices strive to perform well or outperform traditional investments across rising and falling growth and inflation.

Across the growth dimension, equities and bonds are complementary. As growth rises or is better than expected, stocks tend to rise due to better earnings, whereas nominal bonds tend to perform less well. The opposite is true when growth falls or is weaker than expected.

Across the inflation dimension, equities and bonds are less complementary, as both are expected to perform well during periods of low or falling inflation, and less well during periods of rising inflation. Hence, commodities play an important role by offering inflation protection.

Exhibit 3 shows the average monthly risk-adjusted returns across asset classes during the four economic environments since 1973. The growth indicator uses the Chicago Fed National Activity Index (CFNAI), a monthly index designed to gauge overall economic activity (growth up if greater than 0; growth down if less than 0). The inflation indicator uses the US CPI Urban Consumers YoY NSA series (inflation up if higher than prior month; inflation down if lower than prior month).

Unsurprisingly, equities performed strongly during a growth up environment, and nominal bonds performed well during a growth down environment. With respect to inflation, commodities provided a natural hedge to equities and nominal bonds during rising inflation and vice versa. Thus, within each environment, one or more asset class historically served to offset any underperformance.

The foregoing begs the question: are the S&P Risk Parity Indices expected to outperform in every environment? The answer is no. The S&P Risk Parity Indices tend to underperform during strong bull markets. This could be expected given the higher equity allocation that traditional portfolios often have. Additionally, the indices tend to underperform during a rapidly rising rate environment. However, it is important to note that when rates rose gradually over time, risk parity historically performed fairly well.

It is hard to predict what the future has in store, but the S&P Risk Parity Indices appear to be well-positioned for whatever lies ahead in this uncertain landscape.

The posts on this blog are opinions, not advice. Please read our Disclaimers.