Get Indexology® Blog updates via email.

In This List

2018 Institutional SPIVA®: A Couple of Takeaways

Happy 20th Birthday to the DJSI!

S&P High Yield Dividend Aristocrats Part II: Risk/Return

The Outperformance of the S&P U.S. High Yield Low Volatility Corporate Bond Index since Q4 2018

Coffee Drips to a New Low

2018 Institutional SPIVA®: A Couple of Takeaways

Contributor Image
Hamish Preston

Head of U.S. Equities

S&P Dow Jones Indices

S&P Indices Versus Active (SPIVA) scorecards provide mainstay performance comparisons between active managers and benchmarks.  Our latest Institutional SPIVA scorecard shows once again how difficult active managers found it to beat benchmarks, net- or gross-of-fees.  Here are a couple of highlights.

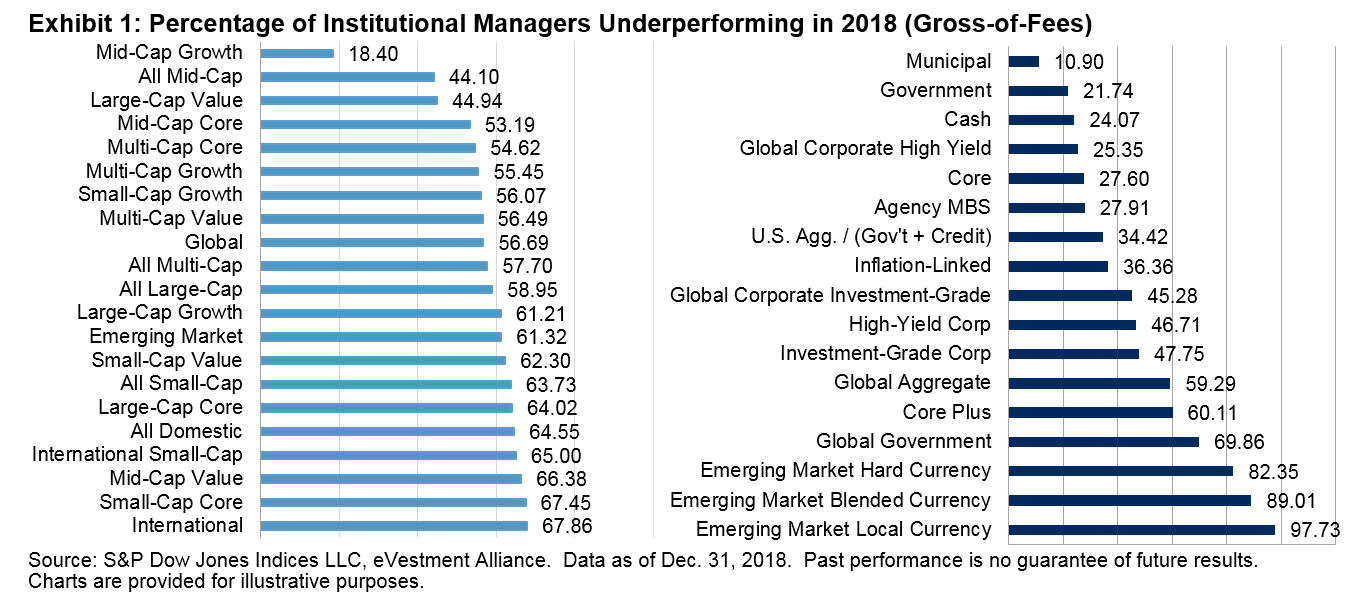
2018 proved challenging for institutional equity managers, although institutional fixed income managers showed some strength.

The fourth quarter of 2018 witnessed a complete turnaround in sentiment, as uncertainty over Fed policy and renewed trade tensions between the U.S. and China contributed to a rise in volatility.  Although such conditions are commonly believed to favor active managers, the data suggests otherwise: in most categories, a majority of institutional equity funds underperformed their benchmarks last year, even gross-of-fees.

However, institutional active fixed income managers navigated the turbulence more surefootedly: a majority of managers beat their benchmarks, before fees, in 11 out of the 17 fixed income categories in 2018.


Incorporating a profitability screen in small cap benchmarks would have made them harder to beat.

We have written quite recently about the potential benefits of incorporating a profitability screen in small caps and S&P Dow Jones Indices launched the S&P Global SmallCap Select Index Series earlier this year in order to allow benchmark comparisons.  Exhibit 2 shows the impact on the SPIVA statistics when switching our international small cap benchmark to one of these small cap select indices – the S&P Developed Ex-U.S. SmallCap Select Index.

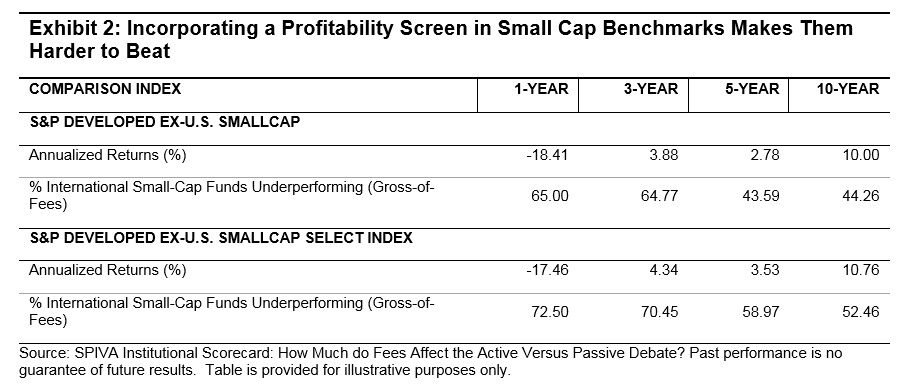
Over every timeframe, more funds beat the S&P Developed Ex-U.S. SmallCap Index (which does not require small cap companies to have a track record of positive earnings) than the corresponding small cap select index (which does).  And over the 5- and 10-year periods ending December 2018, such a switch in benchmarks would convert the international small cap category from one in which a majority of institutional active funds outperformed, to a one in which a majority underperformed.

To find out more about the latest results and for more information on the active versus passive debate, visit out SPIVA microsite.

The posts on this blog are opinions, not advice. Please read our Disclaimers.

Happy 20th Birthday to the DJSI!

Contributor Image
Manjit Jus

Managing Director and Global Head of ESG Research & Data

S&P Global

On Friday, Sept. 13, 2019, the annual rebalancing of the Dow Jones Sustainability Indices (DJSI) took place. This year marks the 20-year anniversary of the DJSI World, the oldest and most iconic global corporate sustainability benchmark in existence. For the companies that have been selected for this index each year over the last two decades, this is a significant accomplishment. It reflects their sustained commitment to driving forward the improvement of sustainability-related issues across all aspects of their business, and their transparency in disclosing their performance, to become sustainability “pioneers” within their respective fields.

This year, 1,166 companies actively provided detailed insights into their corporate sustainability efforts through the SAM Corporate Sustainability Assessment (CSA). This record-breaking participation in the SAM CSA is a clear sign that the topic of sustainability has firmly cemented itself in the core business strategies of companies, and that the demand from investors for sustainability data is greater than ever.

The sustainable investment space is growing more rapidly than ever, and the variety of products, services, and benchmarks available to investors has increased significantly since the DJSI World was launched in 1999. Despite this fast-paced change, the DJSI remains the leading sustainability benchmark in the world, and after two decades it continues to serve as an important compass for companies, investors, employees, and other stakeholders as they navigate through emerging sustainability issues.

As part of the annual review of the CSA methodology, RobecoSAM focused on key financially relevant themes that are shaping the corporate sustainability landscape, including adding Cybersecurity and Privacy Protection to a number of new industries, as companies are finding themselves affected by new technology risks. Questions around product offerings in the areas of Sustainable Finance were enhanced in the Banking, Diversified Financials, and Insurance industries. Similarly, questions for companies in the Oil & Gas industry were updated to refocus on transition risks and the resilience of current business models. In addition, growing concern from investors around agricultural themes like palm oil and other raw materials led to changes in the Raw Material Sourcing criterion.

For a number of years, we have observed a growing interest from our clients and other stakeholders in the “living wage.” This is a theme that is at the heart of the UN Sustainable Development Goals —holding corporates accountable for paying their employees in an equitable and fair way, improving the livelihoods and living standards of employees and families. This year, we introduced questions on the living wage in order to collect unique data on the topic while raising awareness amongst corporates. The calculation of living wages in different countries and regions is complex, and the calculation methodologies have not yet been standardized. Based on our assessment of company responses, we see that they are only starting to tackle this topic and efforts in this area will mature over time.

We have again prepared our Annual Scoring & Methodology Review document, providing deeper insights into the major methodology changes. You can read the document here.

For more about the CSA, visit www.robecosam.com/csa.

The posts on this blog are opinions, not advice. Please read our Disclaimers.

S&P High Yield Dividend Aristocrats Part II: Risk/Return

Contributor Image
Wenli Bill Hao

Director, Factors and Dividends Indices, Product Management and Development

S&P Dow Jones Indices

From Dec. 31, 1999, to June 30, 2019, the S&P High Yield Dividend Aristocrats® generated a total return of 590.3%. Of the contribution, about 57% was from dividend income, while 43% came from price appreciation. In this blog, we will look at the risk/return characteristics in detail.

Favorable Risk-Adjusted Returns

The S&P High Yield Dividend Aristocrats delivered significant outperformance against its benchmark, the S&P Composite 1500®, over the long-term horizon. Rebasing both indices to 100 on Dec. 31, 1999, the S&P High Yield Dividend Aristocrats reached 690.30 on June 30, 2019, whereas the S&P Composite 1500 reached 315.15 over the same period, as shown in Exhibit 1.

Exhibit 2 shows the detailed risk/return profile of the S&P High Yield Dividend Aristocrats versus the S&P Composite 1500. Over the studied period, the S&P High Yield Dividend Aristocrats outperformed the S&P Composite 1500 by 4.3% on an annualized return basis. The reduced volatility helped the strategy deliver a much better risk-adjusted return (0.75) than the S&P Composite 1500 (0.41). Furthermore, the S&P High Yield Dividend Aristocrats also had superior risk-adjusted returns over the 5-, 10-, and 15-year periods.

Defensive Characteristics

The S&P High Yield Dividend Aristocrats demonstrated defensive features during the down markets of the studied period, with the strategy having a smaller maximum drawdown, less loss, and a lower beta than the S&P Composite 1500, as shown in Exhibit 3.

Upside Participation and Downside Protection

Another defensive feature of the S&P High Yield Dividend Aristocrats was that it participated in the upside when the market[1] was up and provided downside protection when the market was down. As illustrated in Exhibit 4, the S&P High Yield Dividend Aristocrats, on average, participated in 88.2% of market returns during the up months. On the other hand, it experienced only 59% of market drops during the down months. Overall, the strategy tended to outperform, with a persistent hit ratio[2] of 75.9% in down markets and 37.8% in up markets.

In the next blog, we will discuss the performance attributions of the S&P High Yield Dividend Aristocrats.

For more information, please see the first part of this blog series here.

[1] The market is defined as the monthly performance of the S&P Composite 1500 from Dec. 31, 1999, to June 30, 2019.

[2] The persistent hit ratio is defined as the total number of periods when the strategy outperforms the benchmark and is expressed as a percentage.

The posts on this blog are opinions, not advice. Please read our Disclaimers.

The Outperformance of the S&P U.S. High Yield Low Volatility Corporate Bond Index since Q4 2018

Contributor Image
Hong Xie

Former Senior Director, Global Research & Design

S&P Dow Jones Indices

The S&P U.S. High Yield Low Volatility Corporate Bond Index[1] is designed as a low volatility strategy in the high yield bond universe. The index aims to deliver higher risk-adjusted returns than the underlying broad-based benchmark through mitigating uncompensated credit risk. The back-tested index performance demonstrated the efficacy of the low volatility strategy, with reduced return volatility and drawdowns in stressed markets (please refer to our previous research paper).

In 2017 and the first three quarters of 2018, high yield credit spreads continued grinding lower, reflecting persistent yield chasing (see Exhibit 1). On Jan. 26, 2018, the option-adjusted spread (OAS) for the S&P U.S. High Yield Corporate Bond Index reached its tightest level since the 2008 financial crisis, at 266 bps. However, in Q4 2018, global risk assets sold off sharply amid concerns over global trade and slowing economic growth. The S&P U. S. High Yield Corporate Bond Index’s OAS widened by 174 bps as the S&P 500® declined by -14%.

How did the S&P U.S. High Yield Low Volatility Corporate Bond Index perform during the recent market turmoil? In this blog, we show that in the latest spread widening, the low volatility strategy outperformed the broad-based underlying universe, with the outperformance being driven by spread positioning.

Exhibit 2 displays the stress scenario analysis for the S&P U.S. High Yield Low Volatility Corporate Bond Index since 2000. During the Q4 2018 and early January 2019 sell-off, when the broad market high yield bond index OAS widened by 199 bps from trough to peak, the S&P U.S. High Yield Low Volatility Corporate Bond Index outperformed the broad-based S&P U.S. High Yield Corporate Bond Index by 1.2%, while the latter suffered a loss of 4.1%. Other periods of market stress are also included that point to the defensive nature of the S&P U.S. High Yield Low Volatility Index.

Exhibit 3 details the monthly relative returns from October 2018 to August 2019. Cumulatively, the S&P U.S. High Yield Low Volatility Corporate Bond Index outperformed the broad-based universe by 1.75%, with positive performance during 7 out of the 11 months over the studied period. Most of the outperformance came from credit spread positioning, confirming that uncompensated credit risk mitigation could improve the performance of a low volatility strategy.


[1]   For information about the methodology, please refer to https://spdji.com/documents/methodologies/methodology-sp-us-high-yield-corporate-bond-strategy-indices.pdf.

The posts on this blog are opinions, not advice. Please read our Disclaimers.

Coffee Drips to a New Low

Contributor Image
Jim Wiederhold

Former Director, Commodities and Real Assets

S&P Dow Jones Indices

Over the past five years, the S&P GSCI Coffee underperformed the other soft commodities, as can be seen in Exhibit 1. Broad oversupply issues that have been seen in most commodities have been particularly pronounced in the coffee market. In addition to the major coffee-producing countries’ respective economic problems, these countries also generally suffer from high exposure to commodities, a strong U.S. dollar, and the ripple effect of the ongoing trade war between the U.S. and China. One alternative to stem the price decline may be for these countries to collaborate, similar to the way cocoa-producing countries do. In July 2019, Ghana and Côte d’Ivoire reached an agreement for a price floor in an attempt to counteract the lower cocoa prices in the past few years.

The supply picture is not helping coffee at the moment. In early September 2019, the International Coffee Organization increased its 2018-2019 global surplus estimate to 4.96 million bags from 3.92 million bags estimated the prior month. This estimate compares with the 2017-2018 surplus of 2.05 million bags and would be the second consecutive year with a surplus. This contrasts with a deficit of 1 million bags during 2016-17, and so the oversupply is worsening even with demand picking up globally.

Two of the top three coffee-producing countries have experienced big shifts in their economies over the past five years. Brazil, the largest exporter with 16% of global coffee exports, recently came out of a multi-year recession ending in 2017. Meanwhile, Colombia’s GDP was cut in half over that time as its exports declined by an annualized rate of 9%. About half of Colombia’s exports are crude petroleum and coal, two markets that, along with coffee, experienced extensive price declines over the past five years. Vietnam was the only one of the top three exporters to see an uptick in economic growth, although recent growth forecasts have been more pessimistic owing to elevated debt levels and large fiscal deficits. The World Bank believes Vietnam’s real GDP peaked in 2018.

Coffee consumption globally continues to creep higher, but due to the latest record harvests in Brazil, coffee prices have continued to decline. Starbucks recently proposed it may see a boost from lower costs, as the company projects coffee prices to continue to underperform. However, it is unclear where coffee prices might go from here given the uncertainty present in the global economy and associated levels of consumer consumption. Tastes and habits of consumers are also constantly shifting throughout the world. The S&P GSCI Coffee is designed to provide investors with a reliable and publicly available benchmark for investment performance in the coffee market. S&P Dow Jones Indices offers different versions of this index to cater to the needs of market participants. These versions include enhanced roll yields, dynamic roll yields, covered calls, forwards, and currency and regional indices. Single-commodity indices could offer investors an efficient way to access the return streams of unique assets such as coffee.

The posts on this blog are opinions, not advice. Please read our Disclaimers.