Get Indexology® Blog updates via email.

In This List

Using Sectors To Express Views

Performance Characteristics of the S&P/B3 Low Volatility High Dividend Index

S&P High Yield Dividend Aristocrats Part I: Strategy Characteristics

Not All Strategies Are Created Equal: A Look at the S&P MARC 5% (ER) Index versus Other Multi-Asset Strategies

What’s Inside the S&P China A-Share Factor Indices? Sector Allocation versus Stock-Selection Effect

Using Sectors To Express Views

Contributor Image
Hamish Preston

Head of U.S. Equities

S&P Dow Jones Indices

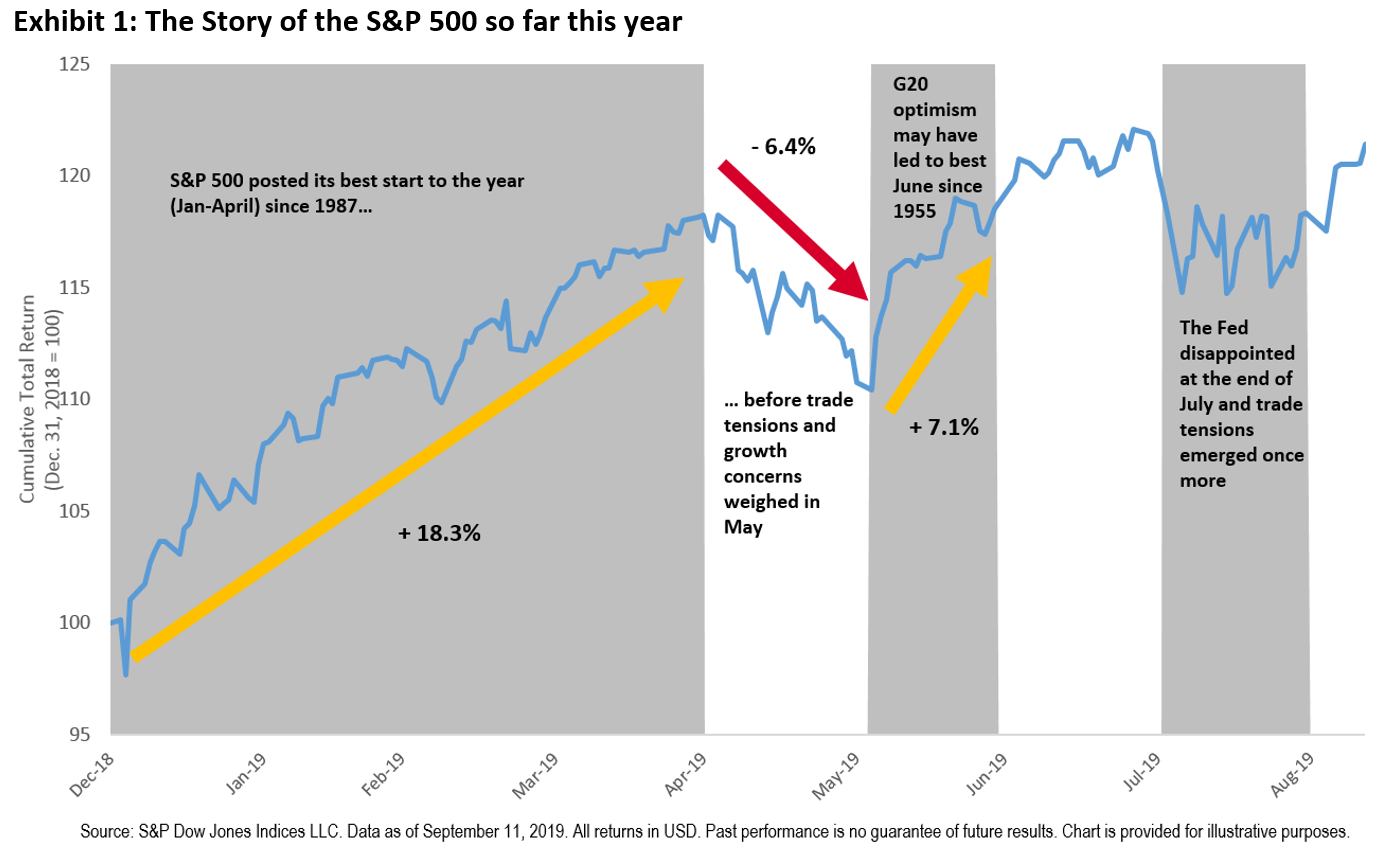
The S&P 500® is up 21.42% year-to-date and is within striking distance of its all-time high.  Although this may suggest the presence of a strong “risk-on” environment, there are signs that the bull market’s stride is changing.  Defensive assets have fared relatively well amid concerns over economic growth and trade tensions, while the inversion of several sovereign yield curves points to the unease being felt by many market participants.

Against this backdrop, many market participants may have considered switching asset allocations to adopt a more defensive approach – moving from equities to bonds, for example.  However, such a strategy is not without its challenges:  given the difficulty in timing the market correctly, one runs the risk of missing out on equity market gains or not having the desired downside protection when it is most desired.  An alternative approach may be to use equity sectors.

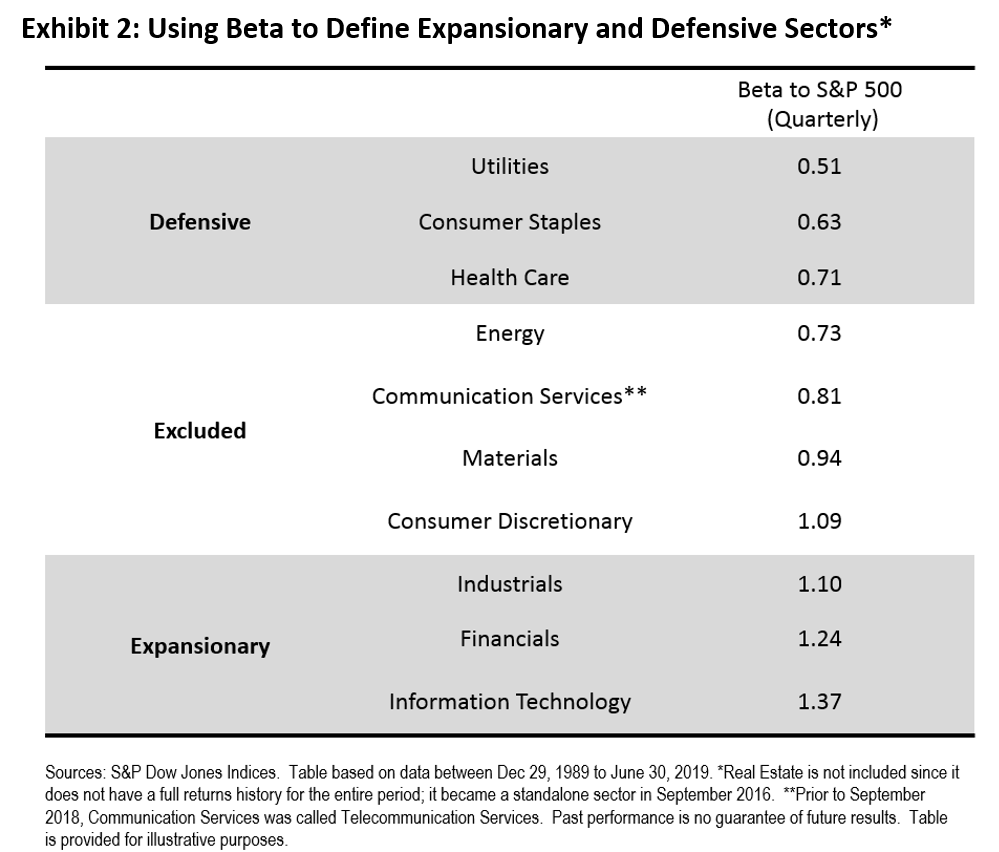
When implementing forecasts, it is imperative to know two pieces of information.  First, what is going to happen?  And once in possession of that information, what is to be done?  Bypassing the challenges involved with predicting the future, we assume that market participants have perfect foresight over U.S. GDP growth.  In order to help answer the second question, Exhibit 2 offers a simple categorization of S&P 500 sectors according to their betas to the S&P 500, based on quarterly total returns between Dec. 1989 and Jun. 2019.  These categorizations are used in the hypothetical sector rotation strategy.

Next up, we compare the performance of 3 hypothetical portfolios, each of which rebalances at the end of each quarter and maintains approximate 60/40 equity/bond allocations.  The “Benchmark 60/40” portfolio maintains a 60% allocation to the S&P 500 and a 40% allocation to the S&P U.S. Treasury Bond Index.  The “Asset Rotation” strategy prescribes a 70/30 (or 50/50) ratio between the S&P 500/S&P U.S. Treasury Bond Index when U.S. GDP growth over the next quarter is above (or below) its median value for the period between Dec. 1989 and June 2019.  The “Sector Rotation” portfolio maintains 40% allocations in each of the S&P 500 and the S&P U.S. Treasury Bond Index, and allocates 20% to an equally-weighted portfolio of expansionary (defensive) sectors when U.S. GDP growth in the next quarter is above (below) its median value for the entire period.

Exhibit 3 shows that both the hypothetical “Asset Rotation” and “Sector Rotation” portfolios offered similar risk/return characteristics, with higher annualized returns than the hypothetical “Benchmark 60/40” strategy.

Although this example involves substantial look-ahead bias – one would have needed perfect foresight over U.S. GDP growth to implement the hypothetical rotation strategies described above – the results illustrate a broader point: sector rotation strategies can be just as powerful as asset allocation in allowing market participants to express views.

The posts on this blog are opinions, not advice. Please read our Disclaimers.

Performance Characteristics of the S&P/B3 Low Volatility High Dividend Index

Contributor Image
Smita Chirputkar

Former Director, Global Research & Design

S&P Dow Jones Indices

After exploring the rationale behind the implementation of a low volatility high dividend strategy in Brazil in our previous blog, we will now examine the recently launched S&P/B3 Low Volatility High Dividend Index.

The index is designed to measure the performance of the least volatile stocks among a specified group of high-dividend-yielding constituents from its benchmark, the S&P Brazil BMI, and is subject to diversification and tradability requirements. The constituents are weighted by their trailing 12-month dividend yield. To accommodate trading capacity, the maximum weight is capped at the lower of 15% and five times its liquidity weight.[1]

Historically, the S&P/B3 Low Volatility High Dividend Index exhibited better risk/return characteristics than the benchmark, especially over the mid- and long-term periods. In investment horizons longer than five years, the index outperformed the benchmark on an absolute and risk-adjusted basis. In the 12-year back-tested period ending in August 2019, the strategy exhibited a significantly lower maximum drawdown (-26.9%) compared with the S&P Brazil BMI (-49.5%; see Exhibit 1).

 The S&P/B3 Low Volatility High Dividend Index provided downside protection in periods of market turbulence. During all the months in which the benchmark was down between June 2007 and August 2019, the S&P/B3 Low Volatility High Dividend Index outperformed 82.3% of the time and generated a monthly average excess return of 2% over the benchmark.[2] This defensive characteristic is typical of a low volatility strategy (see Exhibit 2).

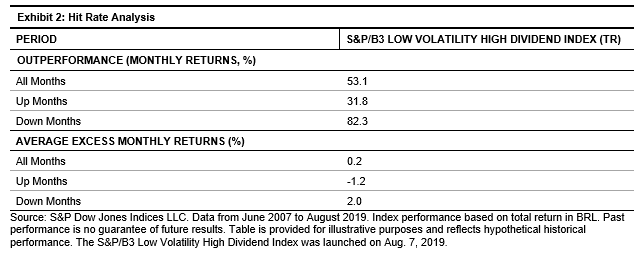
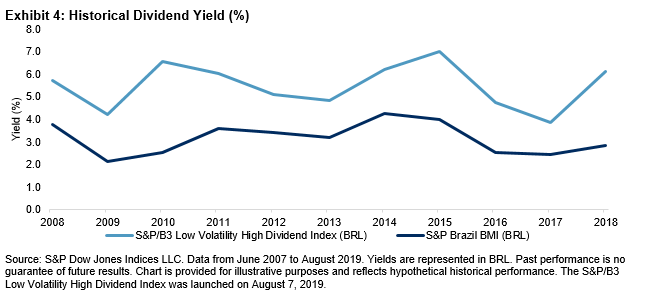
The S&P/B3 Low Volatility High Dividend Index was also able to generate higher yield than the S&P Brazil BMI. Over the studied period, the S&P/B3 Low Volatility High Dividend Index had an average historical yield of 5.5%, compared with 3.1% for the benchmark.

We will explore more about dividend strategies in Brazil in our next blog.

[1] Liquidity weight is measured as a security’s six-month median daily value traded.

[2] Up months are defined as periods when the S&P Brazil BMI had a positive monthly return. Down months are defined as periods when the S&P Brazil BMI had a negative monthly return.

The posts on this blog are opinions, not advice. Please read our Disclaimers.

S&P High Yield Dividend Aristocrats Part I: Strategy Characteristics

Contributor Image
Wenli Bill Hao

Director, Factors and Dividends Indices, Product Management and Development

S&P Dow Jones Indices

With the 10-Year Treasury yield around just 1.5% and the potential for more interest rate cuts on the horizon, yield-seeking investors may become more interested in equity dividend yield strategies. Dividend strategies can satisfy investors’ needs in several regards, namely higher dividend income, favorable risk-adjusted returns, lower volatility, and more downside protection in bearish market environments.

Here and in subsequent blogs, we introduce the S&P High Yield Dividend Aristocrats®. We will cover its methodology and yield characteristics, risk/return profile, and performance attribution.

The S&P High Yield Dividend Aristocrats was launched in November 2005. The index is designed to track a basket of stocks from the S&P Composite 1500® that have consistently increased their total dividends per share every year for at least 20 consecutive years.[1] The index universe covers large-cap, mid-cap, and small-cap stocks in the U.S. equity market.

As shown in Exhibit 1, the S&P High Yield Dividend Aristocrats has consistently had higher yields than its benchmark. The average yield of the index was 3.5%, ranging from 2.5% to 5.8%. In contrast, the average yield of the S&P Composite 1500 was 1.8%, with a range from 1.5% to 2.8%. On average, the dividend yield gap between these two indices was 1.7%.

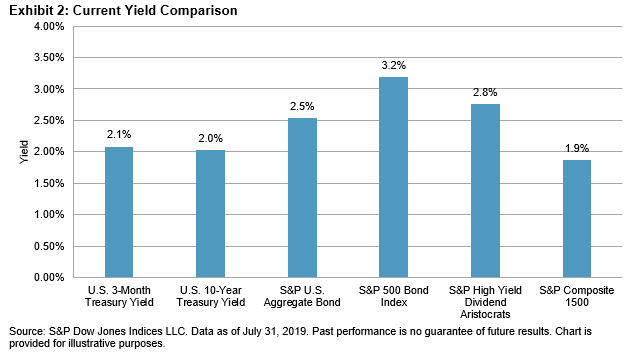
For comparison purposes, Exhibit 2 lists recent yields of selected securities and indices. As of July 31, 2019, the S&P High Yield Dividend Aristocrats had a dividend yield of 2.8%, which was higher than the yields of the other securities and indices shown, with the exception of the S&P 500 Bond Index.

In the next blog, we will take a deeper dive into the risk/return profile of the S&P High Yield Dividend Aristocrats.

[1] For further information about the index, please see the S&P High Yield Dividend Aristocrats Methodology.

The posts on this blog are opinions, not advice. Please read our Disclaimers.

Not All Strategies Are Created Equal: A Look at the S&P MARC 5% (ER) Index versus Other Multi-Asset Strategies

Contributor Image
Joe Kairen

Former Senior Director, Strategy & Volatility Indices

S&P Dow Jones Indices

In this blog, we compare the S&P MARC 5% Excess Return (ER) Index with a peer group of 16 multi-asset 5% volatility-controlled excess return strategy indices currently in the market.[1] Overall, we observed that the diversification and weighting strategy of the S&P MARC 5% (ER) Index provided potential for upside while avoiding some of the broader market drawdowns and selloffs.

As part of the analysis, we made several different comparisons. First, we looked at the annualized returns over different periods across two different categories. Second, we compared relative performance across three different categories. After that, we looked at annualized returns over different periods by grouping the strategies into three performance groups over the respective periods. Finally, we examined these groups on a calendar year basis.

Comparison 1: Looking at the annualized returns over different periods, we used two different metrics.[2]

  • The simple average return of all the strategies; and,
  • The median return of all the strategies.

The S&P MARC 5% (ER) Index consistently outperformed the average and median of all the strategies over all timeframes with the exception of the seven-year period (see Exhibit 1). In the latter, the index was on par with the median and only slightly below the average performance.

Comparison 2: During the one-year period, we could see that much of the outperformance of the S&P MARC 5% (ER) Index was because it did not suffer from the market selloffs that other strategies experienced in October and December of 2018 (see Exhibit 2). The strategy ended the year positive, despite the challenging fourth quarter. From January 2019 to July 2019, the index experienced strong, sustained outperformance due to the asset diversification within the strategy. Each of the asset classes within the index saw 4%-18% growth between Dec. 31, 2018, and July 31, 2019.

Comparison 3: We looked at the relative performance of the S&P MARC 5% (ER) Index compared with other strategies, including the average returns of the top five, bottom five, and middle six strategies over a given period (see Exhibit 3). Similar to what we saw in Comparison 1, with the exception of the seven-year period, the S&P MARC 5% (ER) Index outperformed the middle six strategies across all periods. In addition, the index outperformed the bottom five strategies across all periods.

Comparison 4: We looked at how the performances stacked up on a calendar year basis. While it was not always the top-performing strategy, the S&P MARC 5% (ER) Index provided relatively consistent outperformance over the bottom five strategies in any given year, and typically performed in line with the average and median of each universe (see Exhibit 4).

[1]   The data is aggregated and anonymized to avoid focusing on any specific index strategy. We have also standardized the holiday convention to match the S&P MARC 5% (ER) Index.

[2]   The number of strategies in a given period may vary depending on the availability of history; these groupings do not include the S&P MARC 5% (ER) Index.

The posts on this blog are opinions, not advice. Please read our Disclaimers.

What’s Inside the S&P China A-Share Factor Indices? Sector Allocation versus Stock-Selection Effect

Contributor Image
Liyu Zeng

Director, Global Research & Design

S&P Dow Jones Indices

After examining the risk factor exposure of the S&P China A-Share Factor Indices in our previous blog, we further explore the sector bias and associated impact on index performance.

Apart from the S&P China A-Share Enhanced Value Index, all the S&P China A-Share Factor Indices tended to underweight the Financials sector,[1] though other unique sector biases were observed in various factor indices. While the S&P China A-Share Enhanced Value Index was historically overweight in the Financials and Materials sectors, the S&P China A-Share Short-Term Momentum Index was tilted more toward the Information Technology and Health Care sectors. The S&P China A-Share Low Volatility Index, which weights constituents by the inverse of their volatility, allocated more to the Utilities and Industrials sectors, while the S&P China A-Share Quality Index showed bias toward the Consumer Staples and Health Care sectors. The S&P China A-Share Dividend Opportunities Index had an average sector bias toward Consumer Discretionary and Industrials (see Exhibit 1).

Despite significant sector biases observed among the S&P China A-Share Factor Indices, the performance attribution analysis over the period from July 31, 2006, to April 30, 2019, indicated that, except for the S&P China A-Share Quality Index, a larger part of the active returns were attributed to the stock-selection effect (see Exhibit 2).

Apart from the S&P China A-Share Short-Term Momentum Index, the stock-selection effect contributed positive active returns across the majority of sectors for all of the factor indices, implying the effectiveness of these factor strategies across different sectors. In comparison, active returns attributed to the sector allocation effect were less consistently positive across sectors, except for the S&P China A-Share Short-Term Momentum Index (see Exhibit 3). The underweight in Financials, one of the best-performing sectors over the studied period, resulted in negative sector excess return contributions in the small cap portfolio, S&P China A-Share Dividend Opportunities Index, and S&P China A-Share Quality Index.

[1] Compared to the eligible universe, which includes constituents of the S&P China A BMI and S&P China A Venture Enterprises Index with a float-adjusted market capitalization of no less than RMB 1 billion and a three-month average daily value traded not below RMB 20 million.

The posts on this blog are opinions, not advice. Please read our Disclaimers.