The S&P 500® was up 3.93% in April, marking the fourth consecutive month of gains. The YTD gain of 17.51% was the best since 1987 and the fifth-best in the entire history of the index. The index set a new all-time high in April, surpassing the previous high close from Sept. 20, 2018. This completed a full recovery from the 19.86% decline in the fourth quarter of 2018. Over the past 30 years, the first four months were all consecutively positive six other times, averaging YTD returns of 10.59%. Notably, all six instances ended the respective year higher than the April-end level, with an average annual return of 25.10% (see Exhibit 1).

Both the S&P MidCap 400® (18.5%) and SmallCap 600® (15.4%) have had their best-ever start to the year through the end of April. Both mid and small caps were positive in April, rebounding after both were negative in March. Of the 11 sectors, 8 were positive in both the large- and mid-cap segments. Of the small-cap sectors, nine were positive. Financials was a top-performing sector, with the S&P 500 Financials the best at 8.84%. Health Care, Energy, and Real Estate were the bottom three sectors. The largest spread between size segments was within the Communication Services sector, with the large cap gaining 6.22% and small cap losing 2.15%. Additionally, value outperformed growth in all three size segments. Overall, 29 of the 42 segments of the U.S. equity market had higher returns in April compared with March, and only eight were negative.

Considering the historic YTD gains as the month of May begins, the common “Sell in May and Go Away” adage comes back into focus. Despite being somewhat of an investing axiom, it is a recurring debate. The over 90-year history of the S&P 500 can be used to evaluate historic results for the November through April and May through October periods. Overall, the S&P 500 averaged a 1.98% return in the May through October periods and was positive in 59 of the 90 periods.
Performance has tended to be lower in the May through October periods. Over the 90 years since Oct. 31, 1928, the S&P 500 on average returned 3.25% less in the May through October period compared with the preceding November through April period. The performance on average was lower, but there were 29 instances that the May through October period return was higher than the preceding November through April, including 15 instances that the November through April period was negative and May through October was positive. This compares to 21 instances when the November through April period was positive and the following May through October period was negative. Regardless of which was higher, there were 43 instances that both the November through April and following May through October periods were positive, and 11 instances that observed negative returns in both periods.
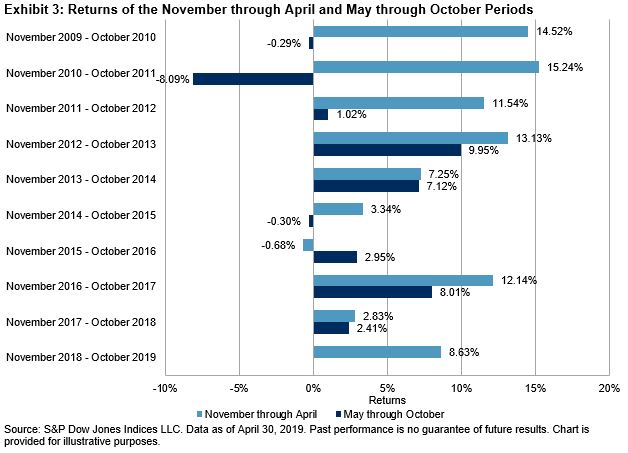
Throughout the ongoing bull market, the November through April period has outperformed the following May through October period by an average of 6.28%. The May through October period outperformed the prior November through April period only once (2016) and was negative three times (2010: -0.29%; 2011: -8.09%; 2015: -0.30%). However, the average return for the May through October periods remained positive, at 2.53%.