Get Indexology® Blog updates via email.

In This List

Do Indian Equity Mutual Funds Generate Alpha When Adjusted for Risk?

Synchronized Gains Push the S&P Risk Parity Indices to New Highs

Using GARP Strategies for Indices Part III – Risk and Return

Positioning for Market Volatility Using Passive Strategies

Commodities Performance Highlights – March 2019

Do Indian Equity Mutual Funds Generate Alpha When Adjusted for Risk?

Contributor Image
Akash Jain

Director, Global Research & Design

S&P BSE Indices

Risk-adjusted returns showcase the return accrued for every unit of risk held in a portfolio. If two portfolios have the same returns over a given time period, the one that has the lowest risk will have the better risk-adjusted return. Modern portfolio theory (MPT) assumes that an investment with higher risk should compensate the investor, on average, with higher returns.[1]

In addition to observing the performance of funds purely on a return basis (as seen in the SPIVA® India Year-End 2018 Scorecard), it may also be useful to determine whether funds, adjusting for risk, are able to beat their respective category benchmarks. This analysis seeks to establish whether actively managed funds are able to generate higher risk-adjusted returns than their corresponding benchmarks over long-term investment horizons.

The standard deviation of monthly returns was used as a measure of risk (volatility) for this analysis. We used the return/risk ratio to evaluate managers’ risk-adjusted performance. To make our comparison relevant, we also adjusted the returns of the benchmarks by their volatility.

The analysis resonates the same message that we saw in the SPIVA India Year-End 2018 scorecard (see Exhibits 1a and 1b)—on a risk-adjusted basis, a large proportion of actively managed equity funds underperformed their benchmarks over long-term horizons.

Exhibit 1b shows that adjusting for risk does not necessarily portray a stronger case for active fund managers. For example, in large-cap and Equity-Linked Savings Scheme (ELSS) categories, we can still see that more than 45% of the active fund managers underperformed their respective category benchmarks on a risk-adjusted return basis across different time horizons. However, in the case of the mid-/small-cap segment, active funds fared relatively better; a little more than 50% of funds outperformed the S&P BSE 400 MidSmallCap Index across the 3-, 5-, and 10-year horizons.

Exhibit 1a: Percentage of Funds Outperformed by the Index (by Returns)
FUND CATEGORY COMPARISON INDEX 3-YEAR (%) 5-YEAR (%) 10-YEAR (%)
Indian Equity Large Cap S&P BSE 100 90.59 57.55 64.23
Indian ELSS S&P BSE 200 88.10 40.54 51.52
Indian Equity Mid-/Small-Cap S&P BSE 400 MidSmallCap Index 56.52 39.68 55.26

Source: S&P Dow Jones Indices LLC, Morningstar, and Association of Mutual Funds in India. Data as of Dec. 31, 2018. Past performance is no guarantee of future results. Table is provided for illustrative purposes.

Exhibit 1b: Percentage of Funds Outperformed by the Index (by Risk-Adjusted Returns)
FUND CATEGORY COMPARISON INDEX 3-YEAR (%) 5-YEAR (%) 10-YEAR (%)
Indian Equity Large Cap S&P BSE 100 92.94 60.43 55.28
Indian ELSS S&P BSE 200 88.10 51.35 45.45
Indian Equity Mid-/Small-Cap S&P BSE 400 MidSmallCap Index 50.00 33.33 44.74

Source: S&P Dow Jones Indices LLC, Morningstar, and Association of Mutual Funds in India. Data as of Dec. 31, 2018. Past performance is no guarantee of future results. Table is provided for illustrative purposes.

At an aggregate level, the asset-weighted basket of mid-/small-cap active funds witnessed better risk-adjusted returns than the S&P BSE 400 MidSmallCap Index with a notably lower return volatility (see Exhibit 2). On the contrary, large-cap and ELSS active funds noted worse or similar risk-adjusted returns to the S&P BSE 100 and S&P BSE 200 benchmarks, respectively, across different investment horizons. Therefore, one may notice that it is becoming increasingly difficult for fund managers to beat their respective benchmarks both on an absolute return basis and risk-adjusted returns basis.

Exhibit 2: Risk/Return Characteristics of Asset-Weighted Active Funds versus Category Benchmarks
INDEX/PEER GROUP 3-YEAR 5-YEAR 10-YEAR
ANNUALIZED RETURN (%)
S&P BSE 100 12.8 13.6 16.1
Indian Equity Large Cap 10.8 14.2 15.8
S&P BSE 200 12.8 14.5 16.6
Indian ELSS 9.5 14.9 16.9
S&P BSE 400 MidSmallCap Index 10.5 18.8 18.4
Indian Equity Mid-/Small-Cap 9.2 18.7 19.3
ANNUALIZED VOLATILITY (%)
S&P BSE 100 14.7 14.1 19.6
Indian Equity Large Cap 14.8 14.5 18.2
S&P BSE 200 14.8 14.2 19.7
Indian ELSS 15.5 15.0 18.7
S&P BSE 400 MidSmallCap Index 19.3 17.9 23.6
Indian Equity Mid-/Small-Cap 17.1 16.3 20.7
RISK-ADJUSTED RETURN
S&P BSE 100 0.88 0.96 0.82
Indian Equity Large Cap 0.73 0.98 0.87
S&P BSE 200 0.86 1.02 0.84
Indian ELSS 0.62 0.99 0.90
S&P BSE 400 MidSmallCap Index 0.54 1.05 0.78
Indian Equity Mid-/Small-Cap 0.54 1.15 0.93

Source: S&P Dow Jones Indices LLC, Morningstar, and Association of Mutual Funds in India. Data as of Dec. 31, 2018. Past performance is no guarantee of future results. Table is provided for illustrative purposes.

Experience the active vs. passive debate on INDEXOLOGY®.

[1]   https://spindices.com/documents/research/research-risk-adjusted-spiva-scorecard.pdf

The posts on this blog are opinions, not advice. Please read our Disclaimers.

Synchronized Gains Push the S&P Risk Parity Indices to New Highs

Contributor Image
Rupert Watts

Head of Factors and Dividends

S&P Dow Jones Indices

The first quarter of 2019 was one of synchronized gains across stocks, bonds, and commodities. Stocks soared, with the S&P 500® up 13.6%, recording its largest first quarter gain since 1998. Amid a dovish tone from the Fed, U.S. Treasury yields declined, with the yield on the 10-year U.S. Treasury Bond falling to its lowest level since 2017. Commodities rebounded strongly, with the S&P GSCI finishing the quarter up 15.0%.

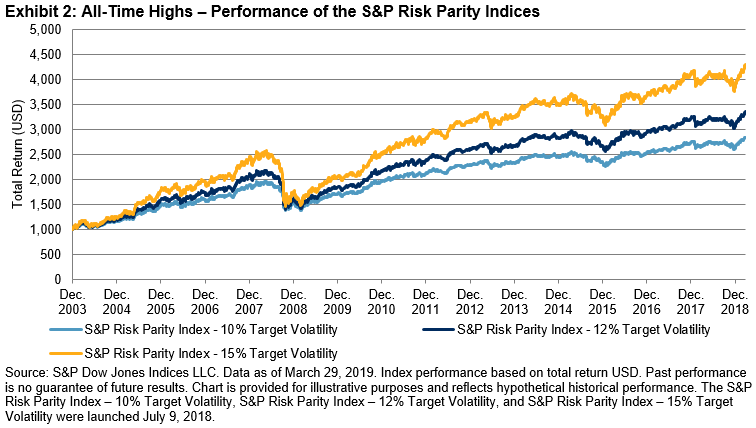
While their positive correlation is unlikely to continue long term, these three asset classes helped the S&P Risk Parity Indices to record attractive first quarter returns. In fact, the indices—which aim to spread risk equally across equities, fixed income, and commodities—have been propelled to new all-time highs.

Exhibit 3 shows the performance of the S&P 500, the hypothetical global 60/40 portfolio, and the S&P Risk Parity Indices from Q4 2018 and Q1 2019, as well as the cumulative return across both quarters. While the S&P 500 posted strong performance in Q1 2019, the impact of declines in Q4 2018 meant it ended about 1.7% off its closing level in September 2018. Furthermore, the “equity-concentrated” global 60/40 portfolio only managed to break even across the two quarters, despite strong performance from fixed income.

In contrast, the S&P Risk Parity Indices shrugged off their Q4 2018 weakness, as Q1 2019 helped to more than make up for those losses. This is largely due to their allocation methodology that aims to equalize the risk contribution of each asset class and hence is not “equity-concentrated.”

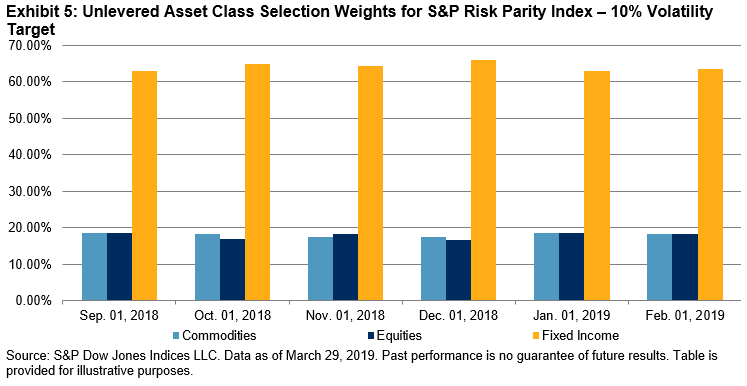
By examining the performance attribution and asset class weights across the S&P Risk Parity Index – 10% Volatility Target in Exhibits 4 and 5, it is clear where this outperformance comes from. It is the fixed income component, with back-to-back quarter gains and a higher proportion of weight, which has primarily driven the index to new highs. The 4.8% gain posted by fixed income since the end of September 2018 has more than offset the losses in the other two asset classes.

While inappropriate to judge the S&P Risk Parity Index – 10% Volatility Target based on two quarters worth of performance, this can be seen as an endorsement of its allocation methodology over the 60/40 portfolio. By equalizing the risk contribution of each asset class, the S&P Risk Parity Indices tend to exhibit a smoother return profile that is less exposed to equity market drawdowns. It is this mechanism that has brought active and passive risk parity products to investors’ attention.

The posts on this blog are opinions, not advice. Please read our Disclaimers.

Using GARP Strategies for Indices Part III – Risk and Return

Contributor Image
Wenli Bill Hao

Director, Factors and Dividends Indices, Product Management and Development

S&P Dow Jones Indices

In this blog, the third in our introduction to Growth at a Reasonable Price (GARP) strategies, we look at risk and return.

The main objective of the S&P 500® GARP Index is to capture the performance of growth stocks with relatively high quality and value composite scores over a long-term investment horizon. Historically, the GARP strategy has delivered higher returns than the underlying benchmark.

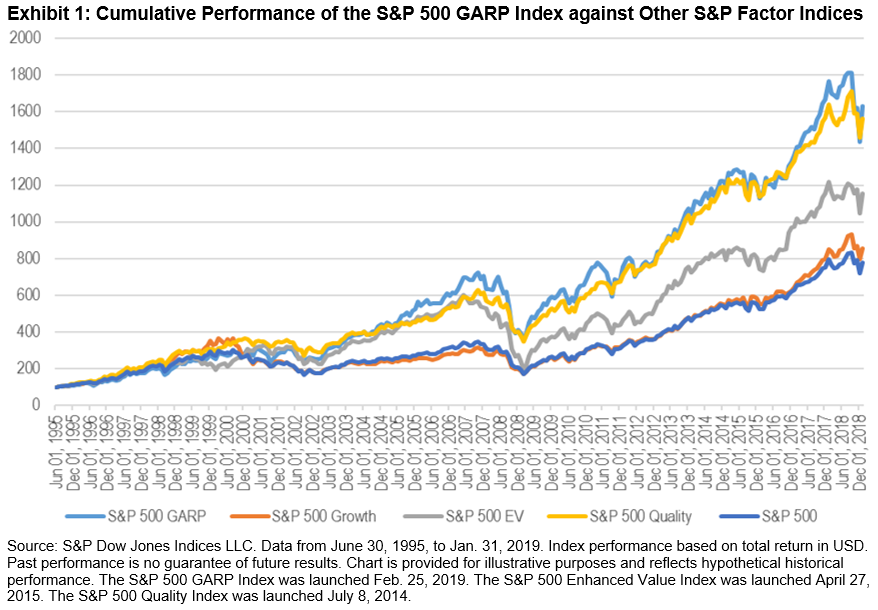
Rebasing all indices to 100 on June 30, 1995, the S&P 500 GARP Index reached 1,631.76 on Jan. 31, 2019, while the S&P 500 reached 777.91. In Exhibit 1, we compare the performance of the S&P 500 GARP Index with other factor indices—the S&P 500 Growth (855.24), the S&P 500 Enhanced Value Index (1155.30), and the S&P 500 Quality Index (1564.67).

Exhibit 2 shows the average risk/return profile of the S&P 500 GARP Index against single-factor indices. The S&P 500 GARP Index had the highest annualized average return, at 13.48%. On a risk-adjusted basis, the S&P 500 GARP Index ranked second (0.76) after the S&P 500 Quality Index (0.93), but was higher than the other factor indices—the S&P 500 Enhanced Value Index (0.66) and S&P 500 Growth (0.67)—as well as the S&P 500 (0.67).

With the S&P 500 as the underlying benchmark, we can use the information ratio (IR) to evaluate whether a strategy was able to add value for each incremental unit of active risk taken (see Exhibit 3). The IR is defined as the expected active return divided by the tracking error (TE), where active return is the difference between the return of a strategy and the return of the S&P 500, and the TE is the standard deviation of the active return.

In Exhibit 3, the S&P 500 GARP Index had a positive IR of 0.50 over a long-term investment horizon. The index had a higher IR than the S&P 500 Growth (0.12) and S&P 500 Enhanced Value Index (0.25), but had a lower IR than the S&P 500 Quality Index (0.57).

In our next blog, we will continue to cover targeted factor exposures, sector composition, and performance attributions of the GARP strategy.

The posts on this blog are opinions, not advice. Please read our Disclaimers.

Positioning for Market Volatility Using Passive Strategies

Contributor Image
Rupert Watts

Head of Factors and Dividends

S&P Dow Jones Indices

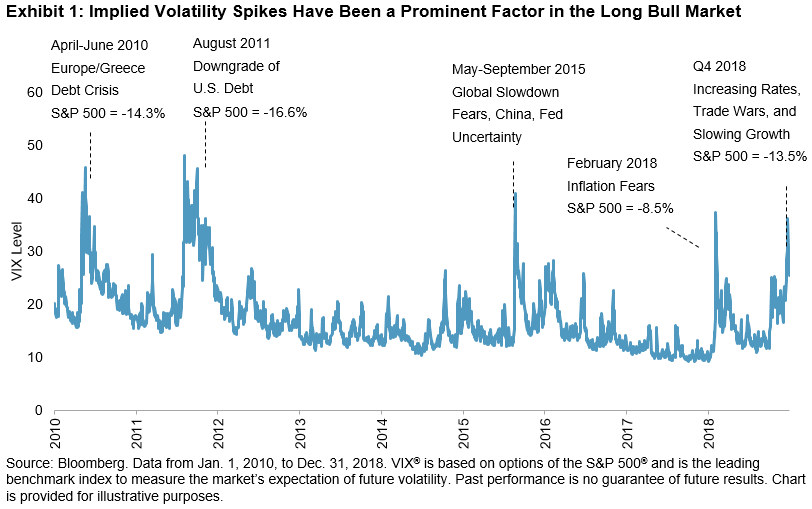
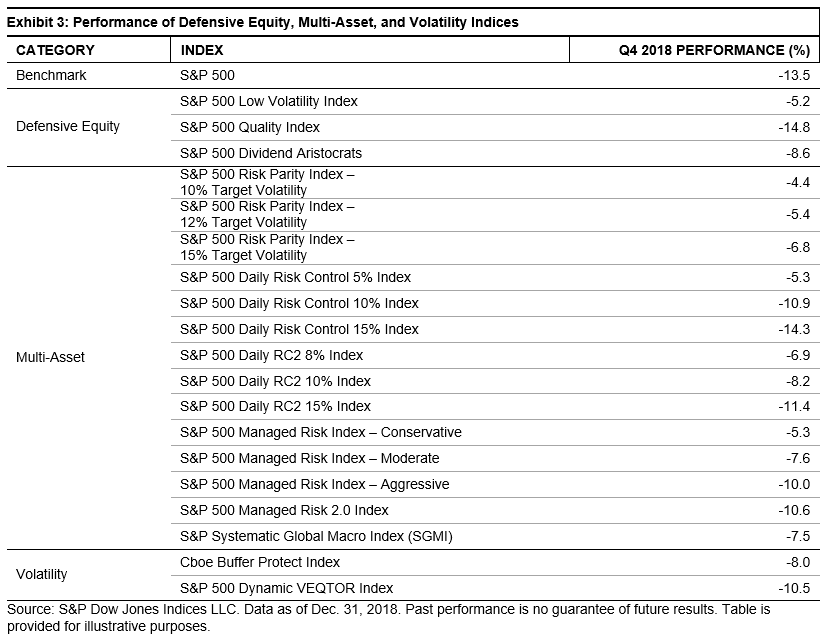
Fluctuating periods of “risk-on” and “risk-off” mean that spikes in equity market volatility and large drawdowns are increasingly common in today’s economy. Exhibit 1 shows events throughout the current market cycle causing notable rises in volatility and large drawdowns. With more of these likely in the future, as our long bull market cycle ages, how do investors best position portfolios to respond?

Many investors are familiar with the passive indices that exist to gain broad market exposure in a low-cost, liquid, and transparent manner. But one question worth asking is which passive strategies have the potential to outperform during periods of negative equity performance and increased volatility? The good news is there are several.

S&P DJI offers a variety of indices specifically designed to help smooth out equity market drawdowns and improve risk-adjusted return. These indices can be divided into three broad categories: defensive equity, multi-asset, and volatility.

Exhibit 3 highlights and provides links to some of the indices that fall into these categories and shows their performance during Q4 2018—the most recent high volatility event. Many of the indices listed in Exhibit 3 posted material outperformance in Q4 2018.

Passive strategies can take on a much more dynamic role than simply offering broad market exposure. Investors can consider these strategies a valuable tool as they seek to weather periods of increased market volatility and large drawdowns.

For an overview of the indices shown in Exhibit 3, as well as an examination of their performance during other notable periods of increased volatility, please check out our new paper, “Seeking Volatility Protection Using Indices”.

The posts on this blog are opinions, not advice. Please read our Disclaimers.

Commodities Performance Highlights – March 2019

Contributor Image
Fiona Boal

Managing Director, Global Head of Equities

S&P Dow Jones Indices

It has been a noteworthy start to 2019 for commodities. The S&P GSCI was up 1.6% in March and up 15.0% YTD. The performance of the Dow Jones Commodity Index (DJCI) was more modest in March, up 0.1%, and it was up 7.5% YTD, reflecting its lower energy weighting. Petroleum prices were the standout driver of broad commodity index performance over the first three months of the year. In contrast, the agricultural commodities proved to be a drain on overall performance, and, while investor interest in precious metals remains well above previous years, price moves have been meek. The later part of the economic cycle is typically characterized by the outperformance of commodities, particularly industrial commodities (namely energy and industrial metals). This implies that the continued strength in commodities will be highly dependent on global economic activity data remaining strong, the U.S. Federal Reserve maintaining its dovish bent, and top commodity consumers such as China continuing to support commodity-laden activity.

Oil prices posted their strongest quarterly price gain in almost 10 years in Q1 2019. The S&P GSCI Petroleum ended the month up 2.9% and up 27.1% YTD. In mid-March, OPEC scrapped its planned April meeting, declaring that it would now delay any decision to extend production cuts until June, once the market had assessed the impact of U.S. sanctions on Iran and the crisis in Venezuela. However, it is clear that cracks in the OPEC Plus union are emerging. OPEC’s de facto leader Saudi Arabia favors cuts for the full year, while Russia, which joined the agreement reluctantly, is seen as less keen to restrict supply beyond September. While supply has been the main driver of the recent price appreciation, it is worth recalling that demand is what led to the sizable price decline in the final months of 2018. There are nascent signs that Asian demand has stabilized, but there are growing concerns regarding European demand.

Performance across the industrial metals complex was more disparate, leaving the S&P GSCI Industrial Metals flat for the month. The rise in commodities this year has been partly fueled by hopes for an agreement to end a trade war between the U.S. and China. Zinc and nickel were the standout beneficiaries of such growing expectations, and, combined with critically low inventory levels, this pushed the S&P GSCI Zinc and S&P GSCI Nickel up approximately 21% YTD. Aluminum is the laggard industrial metal YTD, and the S&P GSCI Aluminum was down 0.2% in March and up a relatively meek 3.4% YTD. Investor concerns regarding rising aluminum supplies have been heightened since the Russian aluminum giant Rusal resumed sales to the U.S. market, following its removal from the U.S. sanctions list.

A stronger U.S. dollar, growing expectations of a trade deal between the U.S. and China, and a general rise in investors’ risk appetite all contributed to gold posting its second consecutive down month in March (down 1.6% for the month and up only 0.9% YTD). These factors were more than sufficient to offset any support from the apparent end of interest rate increases in the U.S. Gold is traditionally seen as a safe place to invest during periods of uncertainty; higher interest rates hurt gold because they make bullion, which pays no yield, meaning it is less attractive to investors, while a stronger U.S. dollar can depress demand by making gold more expensive for buyers in other currencies.

As is often the case, the release of the USDA’s Prospective Plantings report on the last trading day of the first quarter accounted for the bulk of the excitement in the agricultural markets in March. The USDA pegged U.S. corn plantings 1.5 million acres higher than the market expected, and domestic corn inventory halfway through the 2018/2019 marketing year came in 270 million bushels heavier than predicted. The S&P GSCI Corn ended the month down 3.7%. The USDA placed March 1, 2019, soybean stocks at record levels, while soybean acres came in 1.55 million below the trade estimate, but the S&P GSCI Soybeans still ended the month down 2.7%. The only bright spot in the agricultural sector in March was cotton, with the S&P GSCI Cotton up 6.8% for the month and up 6.2% YTD, reflecting the USDA’s forecast for considerably lower cotton acres. Grain market participants will now turn their focus to the planting season and specifically the impact, if any, of recent flooding on planting progress and the final U.S. acreage mix.

The standout performer across the commodity complex in March was lean hogs, with the S&P GSCI Lean Hogs up 23.8% for the month and up 6.9% YTD, pushing the broader S&P GSCI Livestock up 5.5% in March and up 3.9% YTD. Lean hogs spent the first two months of the year in the doldrums fixated on higher-than-expected levels of U.S. pork production and ongoing market access restrictions for U.S. pork in key export markets. By March, these factors were dwarfed by the realization that the scope, severity, and impact of the African swine flu outbreak in China had potentially been greatly misunderstood.

The posts on this blog are opinions, not advice. Please read our Disclaimers.