The first quarter of 2019 was one of synchronized gains across stocks, bonds, and commodities. Stocks soared, with the S&P 500® up 13.6%, recording its largest first quarter gain since 1998. Amid a dovish tone from the Fed, U.S. Treasury yields declined, with the yield on the 10-year U.S. Treasury Bond falling to its lowest level since 2017. Commodities rebounded strongly, with the S&P GSCI finishing the quarter up 15.0%.
While their positive correlation is unlikely to continue long term, these three asset classes helped the S&P Risk Parity Indices to record attractive first quarter returns. In fact, the indices—which aim to spread risk equally across equities, fixed income, and commodities—have been propelled to new all-time highs.
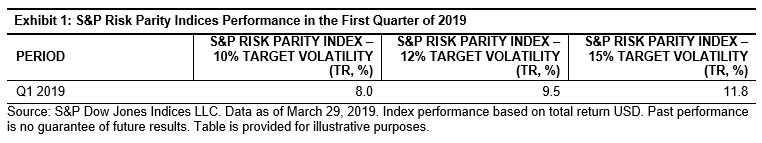
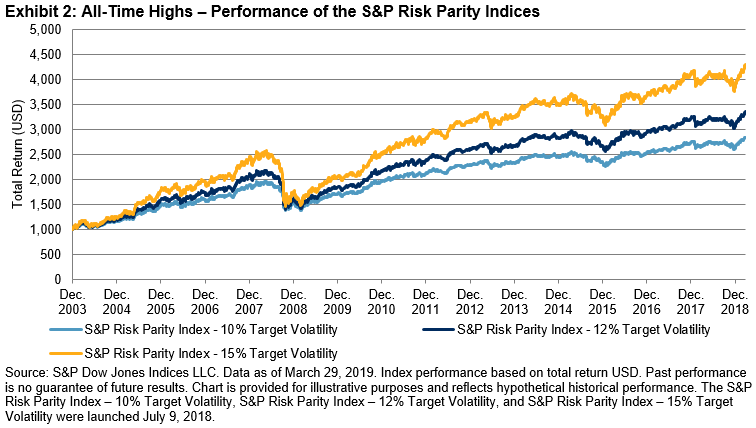
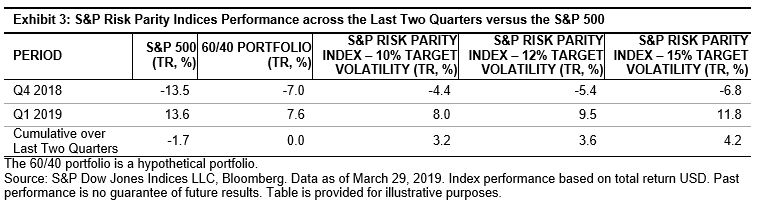
Exhibit 3 shows the performance of the S&P 500, the hypothetical global 60/40 portfolio, and the S&P Risk Parity Indices from Q4 2018 and Q1 2019, as well as the cumulative return across both quarters. While the S&P 500 posted strong performance in Q1 2019, the impact of declines in Q4 2018 meant it ended about 1.7% off its closing level in September 2018. Furthermore, the “equity-concentrated” global 60/40 portfolio only managed to break even across the two quarters, despite strong performance from fixed income.
In contrast, the S&P Risk Parity Indices shrugged off their Q4 2018 weakness, as Q1 2019 helped to more than make up for those losses. This is largely due to their allocation methodology that aims to equalize the risk contribution of each asset class and hence is not “equity-concentrated.”
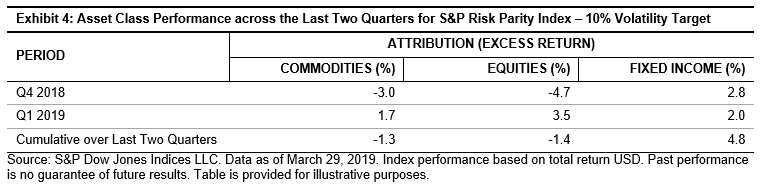
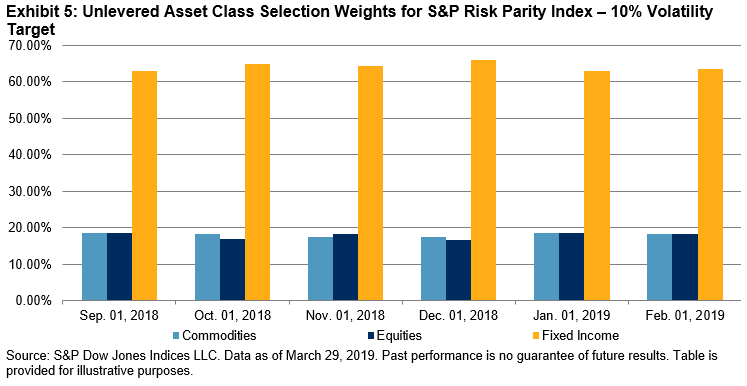
By examining the performance attribution and asset class weights across the S&P Risk Parity Index – 10% Volatility Target in Exhibits 4 and 5, it is clear where this outperformance comes from. It is the fixed income component, with back-to-back quarter gains and a higher proportion of weight, which has primarily driven the index to new highs. The 4.8% gain posted by fixed income since the end of September 2018 has more than offset the losses in the other two asset classes.
While inappropriate to judge the S&P Risk Parity Index – 10% Volatility Target based on two quarters worth of performance, this can be seen as an endorsement of its allocation methodology over the 60/40 portfolio. By equalizing the risk contribution of each asset class, the S&P Risk Parity Indices tend to exhibit a smoother return profile that is less exposed to equity market drawdowns. It is this mechanism that has brought active and passive risk parity products to investors’ attention.
The posts on this blog are opinions, not advice. Please read our Disclaimers.