Style, the name for the value (growth) factor, is one of the oldest known investment factors. It can be defined in different ways, but in the S&P Composite 1500 that includes the S&P 500, S&P MidCap 400 and S&P SmallCap 600, style is measured by growth and value along two separate dimensions, with three factors used to measure each style:
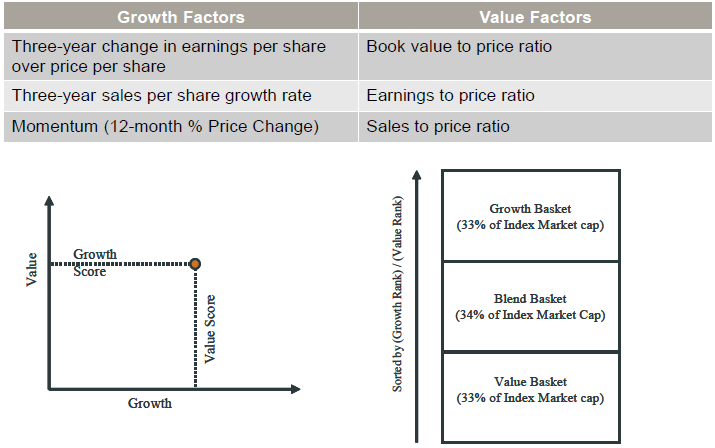
Once stocks are classified into value, growth or a combination of both, the stocks are weighted by market capitalization in the traditional style indices like the S&P 500 Growth and the S&P 500 Value. Historically, one of these style indices almost always beats the S&P 500. Going back to 1995, either growth or value outperformed the composite in every year except 2001. 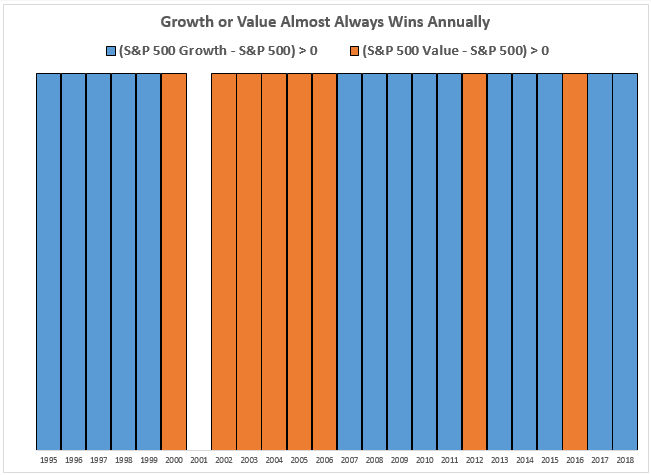 Source: S&P Dow Jones Indices
However, the winning style is not known in advance and both styles never beat the S&P 500 in the same year, so picking the winner might be like flipping a coin. Combining them is difficult also, because only a specific combination that is 54% growth and 46% value produced a more frequently winning combination. It beat the S&P 500 in 16 of 24 years, more than either style alone with growth winning 15 times and value winning 8 times. On average, over this time frame, the growth excess return has been 1.3% whereas value has lost 1.4%; however, when growth or value won, its alpha in either style was 4.1% annually.
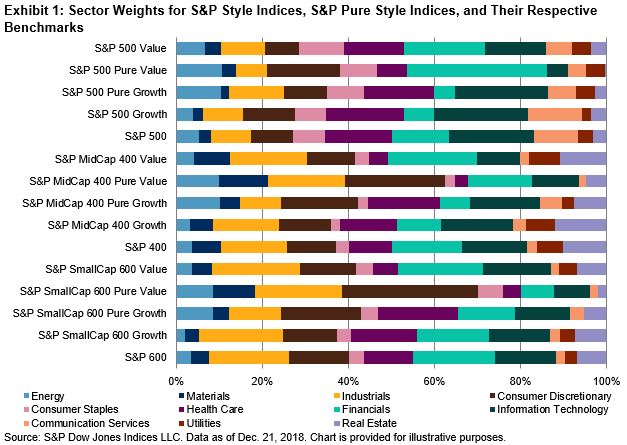
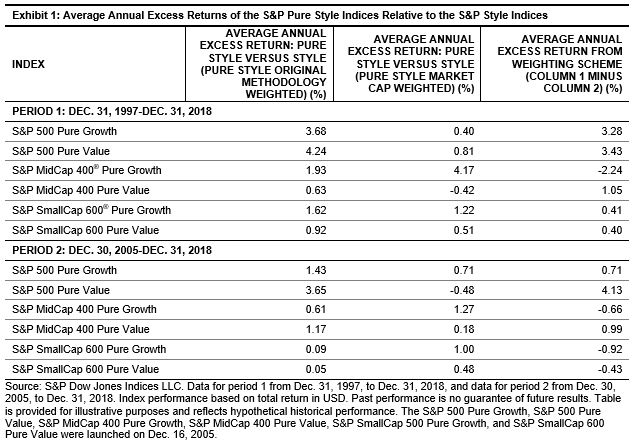
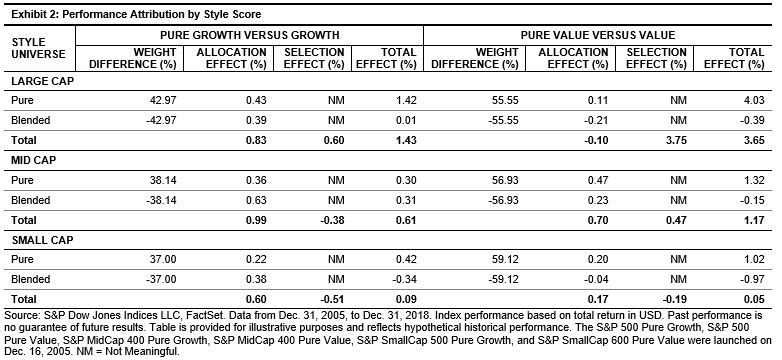
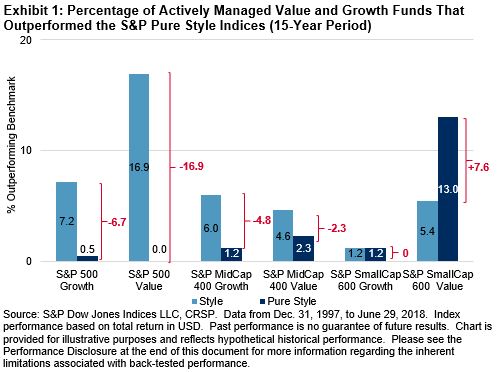
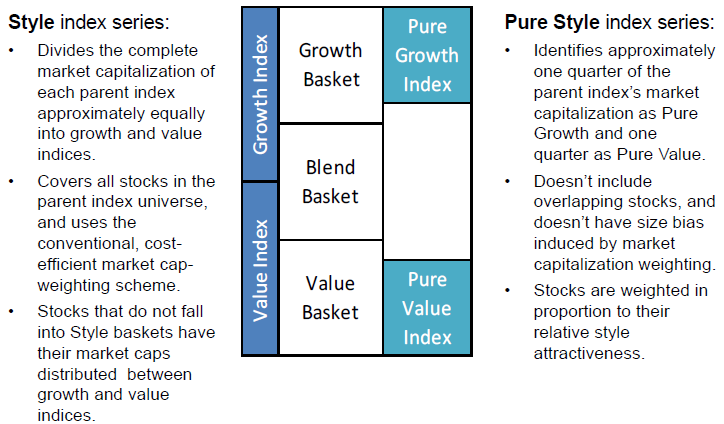
One way to possibly increase returns is to modify the constituents and weights. A more modern design to style is used to construct indices like the S&P 500 Pure Growth and S&P 500 Pure Value. Pure style indices include the stocks ranked in the top quarter of its style, without any overlap, so only about half the parent index is included in pure style. The other key distinction is that stocks in style are market capitalization weighted versus the stocks in pure style that are weighted by their style ranking.
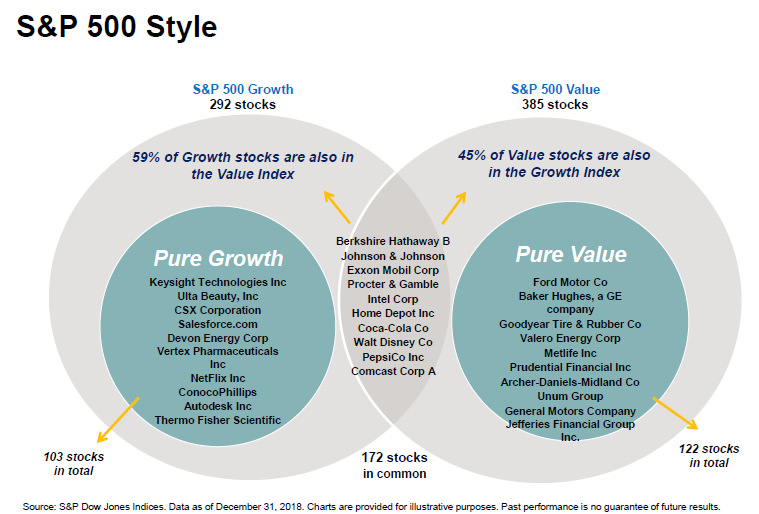
An example of the resulting constituents shows the pure style eliminates the stocks appearing in both styles of value and growth. While both pure styles lost in 1996, 1997 and 2008, both won in 2000, 2003, 2004, 2005, 2007, 2009, 2010, 2012 and 2013. On average when the S&P 500 Pure Value beat the S&P 500, it added 12.3%, and when the S&P 500 Pure Growth beat the S&P 500, it added 9.1%.
In order to explore the deeper reasoning of why pure styles outperform and by how much, S&P Dow Jones Indices recently hosted a webinar (replay here) with external content contributors from BDF, Ambruster Capital Management, Inc., and Cardan Capital Partners. BDF pointed out that while style and factor investing is helpful over the long term, there are certain behaviors to be mindful of when implementing those strategies. This is since tilting with factors can lead to outperformance compared to simple float market capitalization weighted benchmarks, but factors are not unique to one another. Ambruster Capital Management supported this with a periodic table of factors showing the performance rotation with all factors outperforming the S&P 500 over the past 20 years.
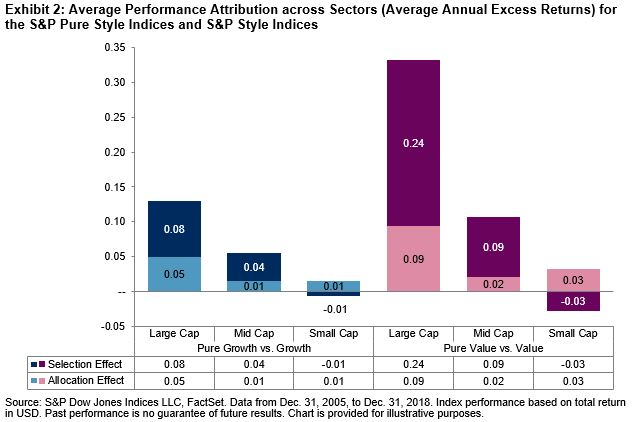
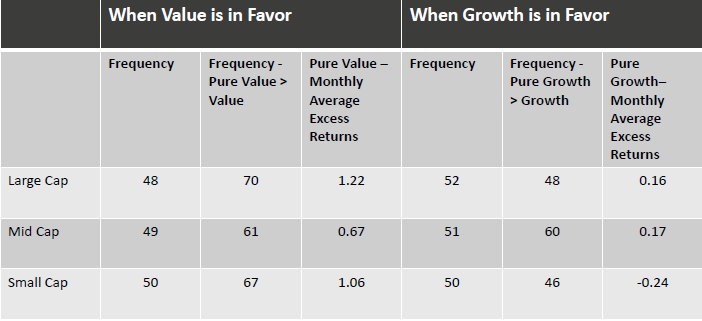
In S&P DJI’s own research, pure style indices offer a way to more precisely tilt and provide a higher exposure to the desired style that is more representative of what an investor may be getting from an actively managed strategy. Selection and weighting are the two key drivers of performance differences between style and pure style. The same factors used to select are used to weight, so there is an interaction effect. Pure style indices have more discriminatory power (ie when value is beating growth). Style indices have market beta near 1.00, while pure style indices have market beta higher than 1.00.
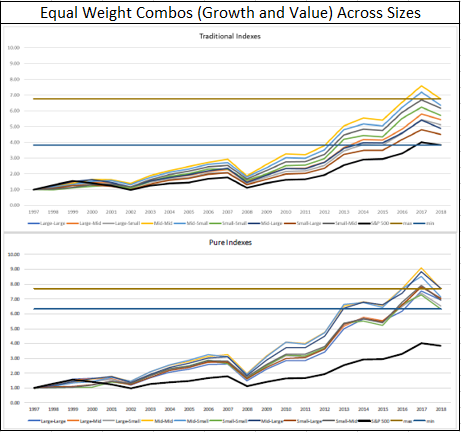
Finally, Cardan Capital Partners showed pure style is a more effective way to capture the old growth and value factors, but that it is important to use both value and growth rather than only value or growth. When equally weighting growth and value across sizes, almost any of the pure style combinations achieved nearly the best case scenario of the traditional styles. In other words, the worst performers in pure style are near the top of the traditional styles.
The posts on this blog are opinions, not advice. Please read our Disclaimers.