Get Indexology® Blog updates via email.

In This List

A Glance at the Performance of Emerging ASEAN Markets

Growth Is Still Hot Only In Small Caps

The Importance of Sector Diversification in a Yield-Focused Strategy – Part II

Proactive Fiscal Policy to Be More Proactive: Takeaways From China’s State Council Executive Meeting on July 23, 2018

Why is the GICS Telecommunications Sector Becoming the Communication Services Sector?

A Glance at the Performance of Emerging ASEAN Markets

Contributor Image
Utkarsh Agrawal

Associate Director, Global Research & Design

S&P Dow Jones Indices

In our previous blog, The Growth of Emerging ASEAN, we discussed why market participants are showing increased interest in this region. In this post, let’s take a deeper look at how the emerging ASEAN equity markets—consisting of Indonesia, Malaysia, Philippines, Thailand, and Vietnam—performed historically.

The emerging ASEAN equity markets collectively outperformed the Brazil, Russia, India, China, and South Africa (BRICS) equity markets as a whole on an absolute and risk-adjusted basis over the period from March 31, 2010, to Dec. 31, 2017 (see Exhibit 1).

The emerging ASEAN equity markets are much smaller than the BRICS markets. As of year-end 2017, their aggregate float market cap was approximately one-sixth of the size of the BRICS equity market. In general, smaller markets tend to have lower liquidity and efficiency. The largest companies in small markets tend be the most liquid. The top 100 largest and most liquid companies slightly underperformed the broad emerging ASEAN equity market over the period from March 31, 2010, to Dec. 31, 2017 (see Exhibit 2).

The portfolio of the top 100 largest companies weighted by float market cap was concentrated in stocks domiciled in Indonesia, Malaysia, and Thailand. A country-weight-capped portfolio may reduce the country-specific risk. The capped portfolio of the top 100 largest companies with a country weight capping of 25% and a stock weight capping of 8% outperformed the broad emerging ASEAN equity market over the same period (see Exhibit 3).

S&P Dow Jones Indices recently launched the Dow Jones Emerging ASEAN Titans 100 Index. It consists of companies from the emerging ASEAN equity markets based on composite rank by float market cap, revenue, and net income. The index constituents are weighted by float-adjusted market cap and subject to a country weight cap of 25% and a stock weight cap of 8% to reduce the country and stock concentration risk. It outperformed the top 100 capped portfolio purely selected by market cap over the period from March 31, 2010, to Dec. 31, 2017 (see Exhibit 4).

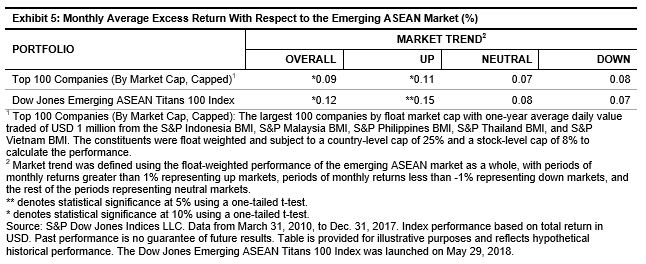
Historically, market participants in the emerging ASEAN equity markets tended to favor the companies with high revenue and income over other companies. The Dow Jones Emerging ASEAN Titans 100 Index outperformed the top 100 capped portfolio from the broad emerging ASEAN equity market trends in all the market cycles. The most significant outperformance was during the up market (see Exhibit 5).

Historically, the emerging ASEAN equity market outperformed the BRICS equity market. Revenue, income, or other fundamentals, along with weight limits to prevent excessive concentration in a particular country or stock, are also important when evaluating the markets for diversification purposes, in addition to market cap and liquidity.

The posts on this blog are opinions, not advice. Please read our Disclaimers.

Growth Is Still Hot Only In Small Caps

Contributor Image
Jodie Gunzberg

Former Managing Director, Head of U.S. Equities

S&P Dow Jones Indices

In July, the total return of the S&P SmallCap 600 Growth was 3.75%, which was 1.15% higher than the total return of 2.60% generated by the S&P SmallCap 600 Value.  This is interesting since typically growth does not outperform value in small caps when value outperforms growth in large and mid caps.  (In July, the total return of S&P MidCap 400 Growth, S&P MidCap 400 Value, S&P 500 Growth and S&P 500 Value was a respective 1.38%, 2.17%, 3.44% and 4.05%.)  In 255 months, going back to May 1997, there are only 17 times when growth outperformed value in only small caps.  It is even rarer to find growth performing better than value in just small caps with the current magnitude of outperformance.  It was in Sep. 2005, almost 13 years ago, when the outperformance of small cap growth over value was this big while value outperformed growth in large and mid caps.  It is also only the 5th biggest outperformance of growth over value in small caps in a month while value outperformed growth in large and mid caps in the entire history of the data. Source: S&P Dow Jones Indices

While all eleven sectors in the S&P 600 were positive in July, the best performing sectors were industrials, materials and health care, up a respective 6.6%, 4.4% and 3.7%.  Also industrials and health care are the two most overweighted sectors in small caps when comparing growth to value.  Health care has 13.2% more weight in growth than value in small caps, while small cap industrials weigh 3.6% more in growth than value.  The weights of growth over value in these sectors are bigger for small caps than large or mid caps.

Source: S&P Dow Jones Indices.

Also, in July, small caps outperformed large caps in materials by 1.4% and energy by 0.2%.  This helped contribute to the month’s small cap growth outperformance since although the growth weight was less than the value weight, it was by less than in the bigger stocks.

Overall, the total return for the S&P 500, S&P 400 and S&P 600 was 3.7%, 1.8% and 3.2%,  respectively, in July.  All sectors in large and small caps gained with industrials, health care and financials leading, likely from growth.  Historically financials and health care are the two sectors that benefit most from GDP growth, with small caps rising on average 6.9% and 6.4% with every 1% of growth.  Large caps in these sectors also benefit, each rising on average 4.5% for each 1% of GDP growth.  Also industrials benefit highly from rising interest rates with small caps and large caps gaining 8.6% and 8.2%, respectively, on average for every 100 basis point rise in rates.  Although rates didn’t increase, the market may be looking ahead to Sept. when there is a chance for an increase.  Lastly, industrials were also helped by the renewed trade negotiations between China and the U.S.

Source: S&P Dow Jones Indices

The posts on this blog are opinions, not advice. Please read our Disclaimers.

The Importance of Sector Diversification in a Yield-Focused Strategy – Part II

Contributor Image
Qing Li

Director, Global Research & Design

S&P Dow Jones Indices

In our previous blog (The Importance of Sector Diversification in a Yield-Focused Strategy – Part I), we highlighted that sector biases in an unconstrained yield strategy could detract from portfolio returns. In this blog, we will show that addressing the sector concentration issue can improve risk-adjusted returns.

We constructed three sector-diversified portfolios—the dividend yield portfolio, free cash flow yield portfolio, and dividend yield + free cash flow yield portfolio—with each portfolio selecting the top five highest ranking stocks from each sector (see Exhibit 1). Each portfolio was rebalanced on a quarterly basis from December 1990 to December 2017 and weighted equally.

Exhibit 2 shows that, compared with non-sector-diversified portfolios, the sector-diversified portfolios had smaller deviations in active sector weights relative to the underlying broad market. This reduction in sector concentration resulted in higher positive active returns—which is the difference between the total portfolio return and the total benchmark return as measured by the S&P 500® and indicated by total effect. We see the biggest difference in the utilities sector, where the non-diversified portfolios had negative return attributions but the diversified portfolios all displayed positive total effect. In fact, the diversified portfolios showed a positive effect for all sectors in the strategies tested.  

As shown in Exhibit 3, over the long-term investment horizon, the sector-diversified portfolios displayed higher returns and lower volatility than the non-sector-diversified portfolios and the broad market, without sacrificing yield.

In addition to higher risk-adjusted returns, we also found that sector diversified income portfolios provided larger downside protection than the non-sector-diversified ones. Exhibit 4 highlights the monthly average excess returns of the sector-diversified and non-sector-diversified portfolios over the market, which is represented by the S&P 500. We can see that sector-diversified portfolios, on average, had higher average monthly excess returns than the non-sector-diversified portfolios in most market environments, including down markets.

Our analysis highlights the importance of sector diversification for yield-seeking market participants. Across all three strategies—dividend yield, free cash flow yield, and the combined dividend yield + free cash flow yield—sector-diversified portfolios historically demonstrated higher risk-adjusted returns than the non-sector-diversified portfolios, without compromising yield.


[1]   The product of the z-scores of the dividend yield portfolio and free cash flow yield portfolio forms the aggregated score.

The posts on this blog are opinions, not advice. Please read our Disclaimers.

Proactive Fiscal Policy to Be More Proactive: Takeaways From China’s State Council Executive Meeting on July 23, 2018

Contributor Image
Jack Jiang

Senior ETF Specialist, Index and Quantitative Investment

ICBC Credit Suisse Asset Management (International) Co., Ltd.

On July 23, 2018, China’s state council executive meeting hosted by Premier Li Keqiang announced that fiscal and monetary policy will be further fine-tuned to boost domestic demand. The meeting reiterated that China will strike a balance between “easing and tightening” and keep liquidity “reasonable and sufficient.” It was also stressed that China will not resort to outright stimulus.

More tax incentives to support technology upgrading:

  • On top of 1.1 trillion yuan in reductions in levies and fees in the pipeline for 2018, the state council announced that it will further expand the promised R&D tax credit (75% of cost) from small- to medium-sized companies to all companies, which will bring additional tax cuts worth 65 billion yuan.
  • The government requested to end the refund of 113 billion yuan from the drawback of the withholding tax to the qualified enterprises in advanced manufacturing and modern service industry.
  • The state council also requested an acceleration of the issuance of 1.35 trillion yuan of special local bonds and funds for infrastructure projects.

Prudent monetary policy to keep sufficient liquidity:

  • Keeping an appropriate total social fund, “reasonable and sufficient” liquidity, and a smooth capital transition mechanism were stressed.
  • The government requested the implementation of various incentives to small- and micro-enterprises (SME). Financial institutions were instructed to support SME and the initiative of the debt-to-equity swap by specific funds with RRR reduction. China also encouraged commercial banks to issue financial bonds for SME, waiving the requirement of the issuer’s consecutive profit.
  • The meeting also set up the target to increase the 140 billion yuan loan to around 150 thousand for SME every year.

Faster investment growth:

  • The government boosted private investment in transport, oil and gas, and telecommunications projects.
  • The statement also seeks to guide financial institutions to guarantee reasonable funding to Local Government Financing Vehicles so that essential projects aren’t held up to facilitate construction and planning of a number of large-scale projects that will meet development purposes and public demand.

Furthermore, clearing “zombie enterprises” and related invalid capital were also mentioned.

In general, the Chinese government stepped up the effort to support growth, confirming the move from consolidation to a more neutral stance amid the economic headwinds. It seemed like Chinese financial markets were recovering an appetite for risk not seen in months, taking cues from the government’s push to invigorate the economy. We have seen a 2.8% rally of the S&P China 500 in the first three days of the week.

Given the 726 billion yuan deficit in the first half of 2018 versus around 2.38 trillion yuan as the budgeted full-year deficit (2.6% of 2018 GDP), together with 5 trillion yuan in fiscal deposits and robust land sales revenue, there is still ample room for further fiscal easing.

As for the monetary policy, below-target inflation and a stabilizing debt mean that the government can afford to further lower the RRR. This can increase lending funds to facilitate corporate development. Market players expect additional cuts of the RRR rate in the second half of 2018.


Sources:

The State Council of the People’s Republic of China, July 24, 2018, http://www.gov.cn/xinwen/2018-07/24/content_5308679.htm

Bloomberg, July 23, 2018, https://www.bloomberg.com/news/articles/2018-07-23/china-says-monetary-policy-will-balance-easing-and-tightening

Reuters, July 23, 2018, https://www.reuters.com/article/us-china-economy-policy/china-eyes-more-vigorous-fiscal-policy-short-of-strong-stimulus-idUSKBN1KD1AE

Reuters, July 24, 2018, https://www.reuters.com/article/us-china-economy-policy-breakingviews/breakingviews-chinas-fiscal-nudge-betrays-growth-jitters-idUSKBN1KE0BY


DISCLAIMERS

This communication is confidential, is for informational purposes and is only for the intended recipients. It is not intended as an offer, investment advice or solicitation for the purchase or sale of any financial instrument or as an official confirmation of any transaction.  Some of the information contained herein including any expression of opinion, forecast, market prices or data has been obtained from or is based on sources believed by us to be reliable as at the date it is made, are subject to change without notice but is not guaranteed.  ICBC Credit Suisse, its subsidiaries and affiliates (collectively, “ICBCCS”) do not warrant nor do ICBCCS accept liability as to adequacy, accuracy, reliability or completeness of such information.

This transmission may contain information that is proprietary, privileged, confidential, and/or exempt from disclosure under applicable law. If you are not the intended recipient, you are hereby notified that any disclosure, copying, distribution, or use of the information contained herein (including any reliance thereon) is STRICTLY PROHIBITED. If you received this transmission in error, please immediately contact the sender and destroy the material in its entirety, whether in electronic or hard copy format. Although this transmission and any attachments are believed to be free of any virus or other defect that might affect any computer system into which it is received and opened, it is the responsibility of the recipient to ensure that it is virus free and no responsibility is accepted by ICBCCS for any loss or damage arising in any way from its use. Please note that any electronic communication that is conducted within or through ICBCCS’s systems is subject to interception, monitoring, review, retention and external production; may be stored or otherwise processed in countries other than the country in which you are located; and will be treated in accordance with ICBCCS’s policies and applicable laws and regulations.

The posts on this blog are opinions, not advice. Please read our Disclaimers.

Why is the GICS Telecommunications Sector Becoming the Communication Services Sector?

Contributor Image
David Blitzer

Former Managing Director and Chairman of the Index Committee

S&P Dow Jones Indices

With the number of telecom companies shrinking, it is clear that communications is much bigger than telecom – Communication Services includes any content delivered on networks.  The old Telecommunications Sector was vanishing because it was missing new and popular ways people communicate now.

GICS – the Global Industry Classification Standard – is widely used to define sectors and industries in indices. The GICS structure of 11 sectors will be updated in September with a new Communication Services Sector combining the existing Telecommunications Sector with parts of the Information Technology and Consumer Discretionary sectors.  The new sector encompasses companies in these areas:

  • Networks — internet, broadband, cellular, broadcast, cable and land lines
  • Content – information, advertising, entertainment, news, social media

Communication is essential in a modern economy.  Without it, the economy would be a series of small isolated villages each trying to be self-sufficient.  With it, information is shared, companies specialize, and trade flourishes.

The content of communications used to be spread across different industries and delivery networks.   Today, interconnected networks deliver virtually any content to any device over any network: text, voice and video via wired, wireless or the internet, television via broadband, newspapers read via smart phones, movies via streaming while social interactions and media follow people everywhere.  Content is crucial for commerce, business, finance, securities trading, and people.

The development that created communication services is the interconnection and sharing of content on networks.

Communication Services is the young sector…

Many communication services companies are young.  Using the dates when companies in the S&P 500 IPO’ed, we can get a sense of how old companies in various GICS sectors are. Companies have been grouped into those that became public before 1973, those listing between 1973 and 1999, and those that IPO’ed this century.  Specific dates were not obtained for the pre-1973 group. Moreover, some mergers and corporate actions obscure the dates. For example, AT&T has a date of 1984; it was created as one of the “Baby Bells” when the original AT&T was broken up in 1984. The original AT&T was incorporated in 1877. The chart shows the proportion of companies in each sector by age group. Communication Services on the left-hand side has the largest green – young – bar of any sector. Utilities, at the right, is the oldest sector. Real Estate includes REITs.  REITs were not listed on the markets in large numbers until the 1970s, explaining the large portion in “middle age.”

Communication Services is clearly the youngest sector due to social media giants like Alphabet (Google) and Facebook. Technology is now the second youngest and dominates the 1973-99 period when Microsoft and Apple came of age. Industrials, Materials, Energy and Consumer Staples represent growth of the US economy during the first three-quarters of the last century.

The relative youth of Communication Services can be a challenge for security analysts. About 60% of the market capitalization of the sector has less than 20 years of history with little data to track performance over market cycles or to reliably classify stocks by factor. While some companies in the sector IPO’ed before 1973 and a few date back to the first half of the 20th century or earlier, the sector is still experiencing rapid changes.

But Communication Services Didn’t Appear Yesterday

We take communications for granted, acting as though smart phones and the web always existed. However, today’s communication networks weren’t always here; they developed in R&D labs and garages as technology and the economy developed and matured. The table shows how the elements of today’s communication networks moved from the laboratory to commercialization.

The growth of interlinked networks bringing virtually all content together and delivering anything to anyone anywhere is changing the way we view the stock market and driving merger activity. Verizon and AT&T – the bulwark of the old Telecommunication Services Sector – own Yahoo and Time Warner. Comcast owns NBC-Universal while competing with AT&T and Verizon by selling phone service. Slightly over half of smart phones in the US operate with Android. Google and Facebook capture a quarter of global spending on advertising.

Communication services are as important in the stock market as in the economy.  To track these developments in networking and content, GICS is introducing the Communication Services Sector by combining networks and content from the Telecommunications, Information Technology and Consumer Discretionary sectors. The old Telecommunication Services Sector disappears.

The posts on this blog are opinions, not advice. Please read our Disclaimers.