If you found a small-cap fund with a 23 year track-record that performed in the top 10th percentile of its peers over a 3-, 5-, 10-, and 15-year period, might you consider investing? How about if you found out it was also a fraction of the price of its peer group? Sounds pretty attractive, but unfortunately, there isn’t really “a fund” like this.
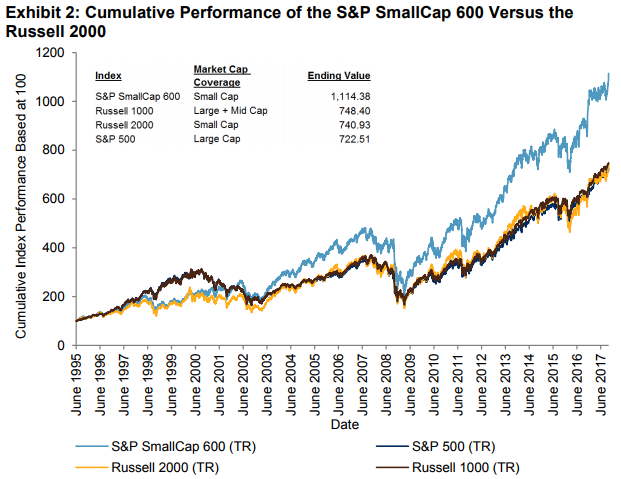
However, there is an index called the S&P SmallCap 600 that has performance like this, and it is possible to replicate it. In fact some managers already do replicate it, and with far lower fees than the average small-cap mutual fund. The industry average fee for a small-cap mutual fund is 1.37%, but there are ETFs that offer products tracking the S&P SmallCap 600 with expense ratios as low as 0.07%. (Here is a more complete list of S&P SmallCap 600 linked products from our website.)
This is the 3rd part of our blog series containing excerpts from our new paper where we discuss the outperformance of the S&P SmallCap 600 versus the Russell 2000, the performance of the indices compared with active managers, and the case supporting the performance.
SMALL-CAP INDEX PERFORMANCE VERSUS THE ACTIVE SMALL-CAP PEER GROUP
As mentioned in the introduction, the SPIVA U.S. Mid-Year 2017 Scorecard shows the S&P SmallCap 600 outperformed 93.8% of all small-cap funds over a five-year period. Moreover, the report calculates that over the 1-, 3-, 5-, 10-, and 15-year periods, the S&P SmallCap 600 beat 59.6%, 88.7%, 93.8%, 94.1%, and 94.4% of small-cap mutual funds in the University of Chicago CRSP database, respectively. This challenge in beating the index may contribute to why only 3% of funds are benchmarked to the S&P SmallCap 600.
To investigate the performance of small-cap benchmarks relative to institutional active managers, we utilized data from eVestment Alliance. In Exhibits 6-8, we compared the S&P SmallCap 600 and Russell 2000 with two S&P DJI small-cap factor indices that have exhibited strong relative performance over the past 20 years. The S&P SmallCap 600 Low Volatility Index is designed to measure the 120 stocks within the S&P SmallCap 600 with the lowest historical volatility, as measured by the standard deviation of daily price returns over the past 252 trading days. The S&P SmallCap 600 Quality Index is designed to measure the 120 stocks within the S&P SmallCap 600 that have the highest average z-score, which is based on three quality metrics: return on equity (ROE), balance sheet accruals ratio, and financial leverage ratio.
As shown in Exhibit 6, the S&P SmallCap 600 outperformed the Russell 2000 in all periods studied, ranging from one year to the entire period since the inception of the S&P SmallCap 600. The S&P SmallCap 600 also outperformed the median small-cap fund in the 1-, 3-, 5-, and 10-year periods ending Sept. 30, 2017.
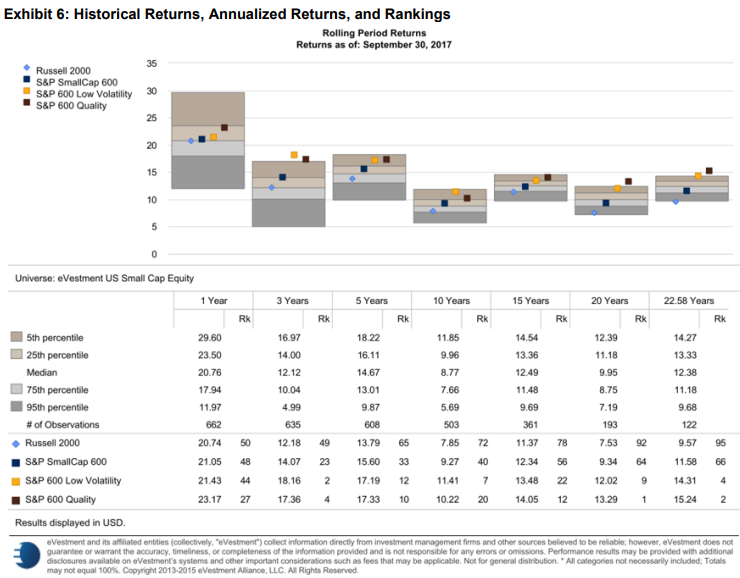
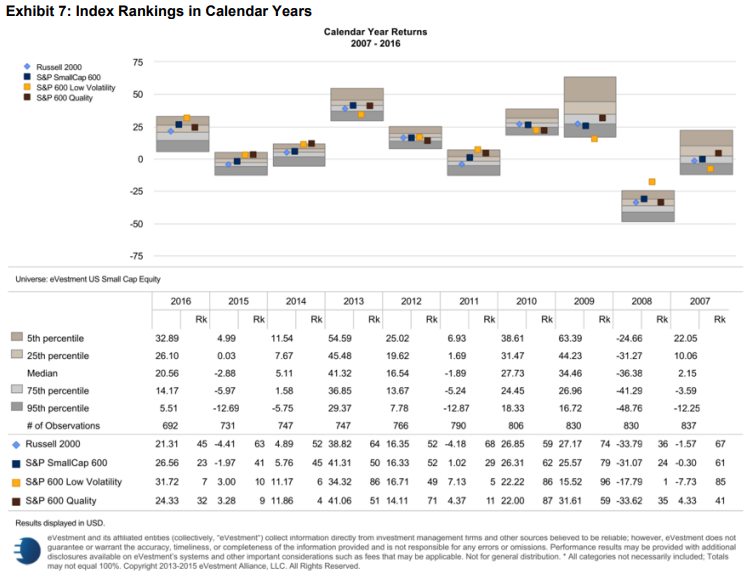
Exhibit 7 compares the returns of the S&P SmallCap 600 and Russell 2000 to the eVestment U.S. small-cap equity universe from 2007-2016. The S&P SmallCap 600 ranked higher than the Russell 2000 in seven years and tied in one year. Only in 2009 and 2010 did the Russell 2000 rank higher, with a 74th percentile ranking versus a 79th percentile ranking for the S&P SmallCap 600 in 2009, and a 59th versus 62nd percentile ranking in 2010. In 2014, 2015, and 2016, the S&P SmallCap 600 ranked even higher, in the 45th, 41st, and 24th percentiles, respectively.
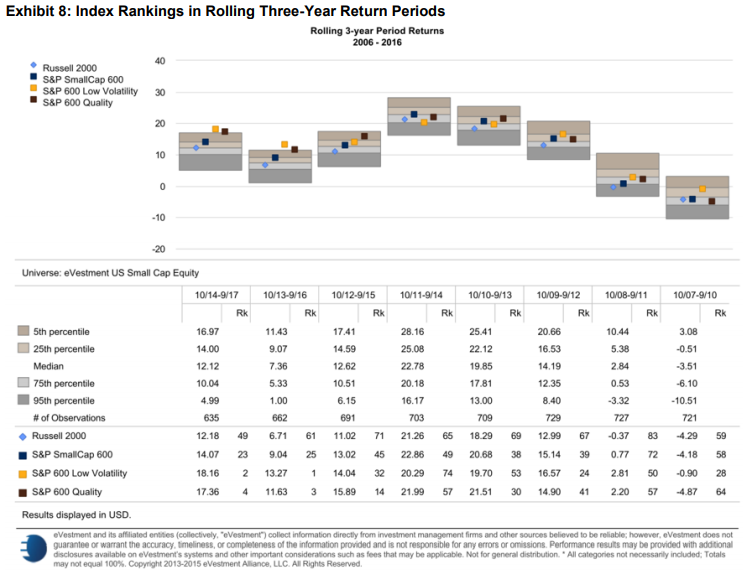
The three-year rolling periods are shown in Exhibit 8. There were a total of eight three-year periods, and the S&P SmallCap 600 ranked higher than the Russell 2000 over every period. The S&P SmallCap 600 was also competitive with the active manager universe, scoring in the top half in five of eight three-year periods.
The evidence of the S&P SmallCap 600’s outperformance over the Russell 2000 is clear, not just in plain comparison but juxtaposed to active managers. Conceivably, the S&P SmallCap 600 could be considered not just as a benchmark replacement, but rather it could more widely serve as the underlying index for investable passive funds.
We will explore the reasoning behind results this strong and steady in the next part of this blog series.
The posts on this blog are opinions, not advice. Please read our Disclaimers.