Historically, the sectors of Information Technology (Tech) and Financials have moved in cycles with Tech mostly outperforming since 2008. In the past 10 years (data ending Dec. 12, 2017,) Tech has outperformed annualized by 8.2% and the outperformance has been solid until last month. The levels hit their widest spread on Nov. 27, but the spread has started to narrow since then.
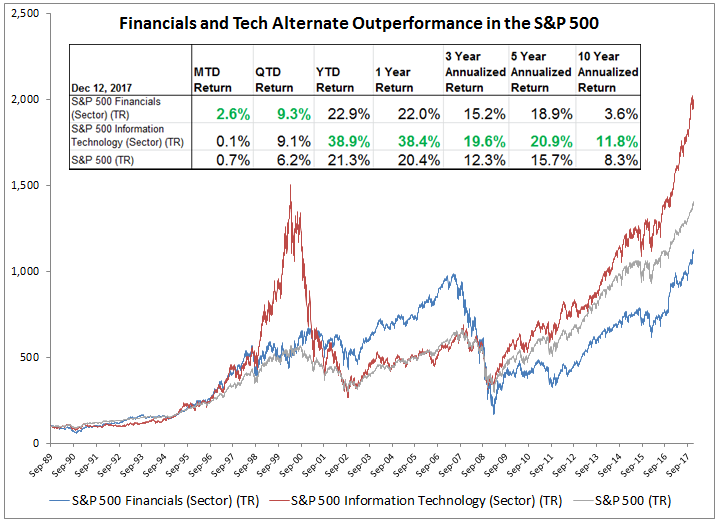
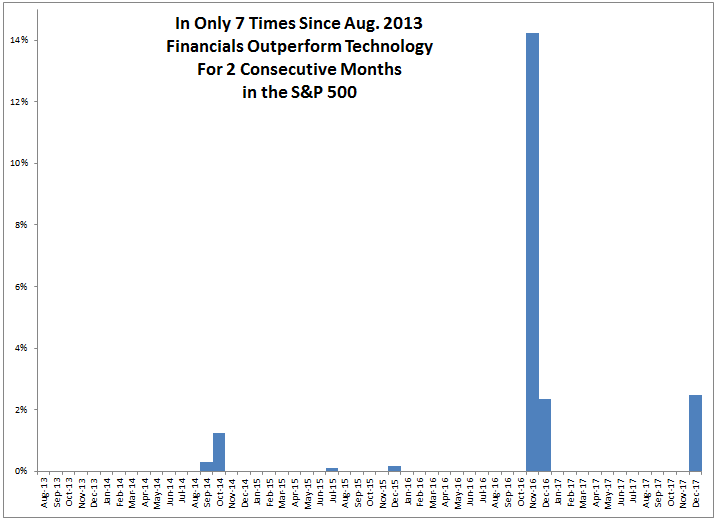
Although one month of Finanicals outperformance over Tech happened in about 53% of months going back to Oct 1989, 2 consecutive months of outperformance is much more rare, happening in less than 1 of every 4 months. If Dec. carries on with Financials outperforming Tech, then Nov. with 2.4% outperformance and Dec. with 2.5% outperformance (dropped to 1.2% outperformance as of Dec. 13, 2017) will be the first back-to-back monthly outperformance this year (since Nov. and Dec. 2016.) If one year doesn’t seem like a long time, when looking back to Aug. 2013 at monthly performance between the two sectors, Financials only outperformed Tech in 2 consecutive months 7 times out of 53 chances, or 13% of the time.
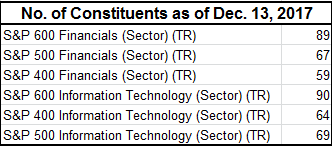
Information Technology and Financials matter so much since they are the two biggest sectors in the S&P 500 with respective weights of 24% and 14.8% (as of Nov. 30, 2017.) They are also the biggest sectors in the S&P MidCap 400 with respective weights of 17.8% and 17.2%. While they are not the biggest in the S&P SmallCap 600 (Industrials are the biggest and Consumer Discretionary is third in size) Financials (2nd) and Tech (4th) still have significant respective weights of 17% and 14.2%. From their size, they have robust industry groups, industries and sub-industries as classified by GICS (Global Industry Classification System.) Notice the smallest number of stocks is 59 in the S&P MidCap 400 Financials Sector.
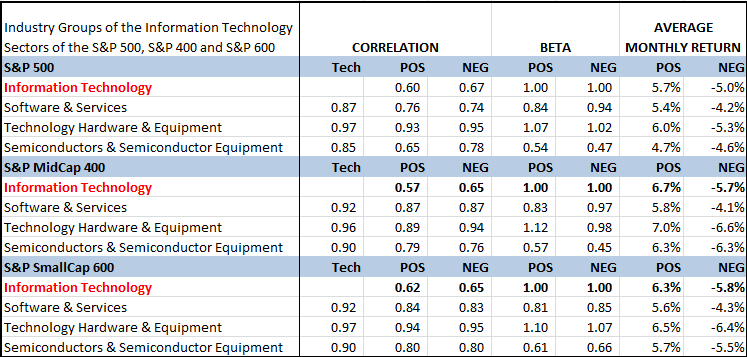
With so many stocks in each sector (the broadest of the GICS classification levels) that are classified into different industry groups (the next broadest, followed by industries and sub-industries,) it is interesting to look at how the different groups perform in up and down markets, especially if Tech might take a turn while Financials rally.
There are a total of 31 groups combined in information technology classifications and 24 in financials. So, for simplicity, the first level down, industry groups, that total 3 in each of these sectors will be mainly discussed. Across all market cap sizes, it is interesting that the correlation of the Technology Hardware & Equipment remains very high to the Tech Sector regardless of the direction of the returns. The widest correlation gap between the positive and negative performance happens in mid-caps between a very strong 0.89-0.94, with more correlation during negative months. This industry group has the highest beta and biggest losses when Tech falls. On the other hand, Semiconductors & Semiconductor Equipment have significant correlation drops when the performance is split into positive and negative Tech months, and has a low beta, especially in large and mid caps when the market is down. Perhaps the most interesting measure is the smaller losses from Software & Services with losses of 83, 72 and 74 basis points for each 1% monthly drop on average in the respective S&P 500, S&P 400 and S&P 600 Information Technology Sectors. Of all the sub-industries in Information Technology, only Home Entertainment Software in the S&P 400 holds up when the sector falls in a month; it gains on average 19 basis points for the average 5.7% sector loss.
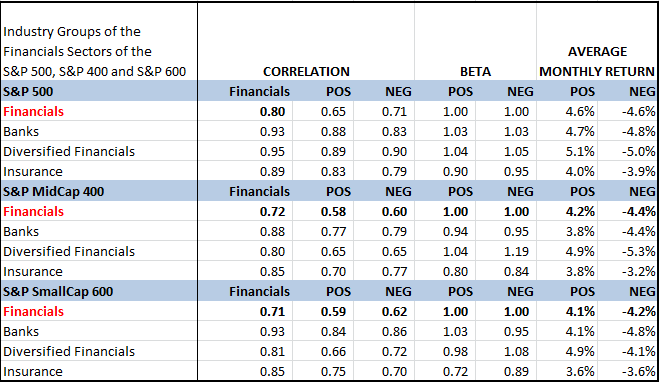
If Financials rise, high correlation, beta and average monthly returns are desirable. The Diversified Financials Industry Group consistently has the highest average monthly returns when the Financials Sector is up, and the industry group gains more than the sector across every market cap. While the correlation is only very high in the S&P 500 during positive months, the beta is close to 1 across the sizes but is notably higher in Diversified Financials than Insurance. Exceptionally performing Sub-Industries when the Finance Sector is positive are the S&P 400-Consumer Finance gaining on average 12.6% monthly with beta of 1.3, S&P 600-Other Diversified Financial Services gaining 6.5% on average, the S&P 600-Insurance Brokers with a positive market beta of 1.3, and in the S&P 500 the sub-industries Regional Banks has beta of 1.4, Multi-Sector Holdings has a beta of 1.8 and Consumer Finance gains 6.5% on average in an up month for Finance.
Overall, while positioning inside sectors can help in a potential turn of performance, sticking with large caps on a broader scale may be most beneficial since Information Technology has lost least on its way down and Financials have gained most on the rise in the whole sector spectrum.
The posts on this blog are opinions, not advice. Please read our Disclaimers.